3034
Nanodiamond Imaging with Hyperpolarized 13C MRI1ARC Centre of Excellence for Engineered Quantum Systems, School of Physics, University of Sydney, Sydney, Australia, 2School of Physics, University of New South Wales, Sydney, Australia
Synopsis
Hyperpolarized 13C MRI leverages an over 10 000 times increase in the 13C polarization of biomolecules, enabling new molecular imaging applications. However, metabolic applications are limited to processes on the timescale of a minute by the short lifetime of the hyperpolarized signal. Here, we hyperpolarize nanodiamonds and microdiamonds to achieve large, long-lived 13C polarizations. We then image these particles in phantoms, demonstrating the potential of hyperpolarized nanodiamonds for imaging over long timescales. As nanodiamond has been established as a biocompatible platform for drug delivery, our results will motivate further research into hyperpolarized MRI for tracking nanoparticles in vivo.
Purpose
Advances in dynamic nuclear polarization (DNP) technology have enabled the development of molecular imaging techniques based on MRI of isotopes with low gyromagnetic ratios and abundance.1 In particular, hyperpolarized 13C MRI, has demonstrated new clinical applications, with diagnostic capabilities that are unmatched by alternate techniques.2,3 However, the short T1 relaxation times of 13C in molecular compounds (approximately 60 s) limits the application of hyperpolarized 13C MRI to metabolic processes that occur on the timescale of a minute. Overcoming this limitation by using hyperpolarized nanoparticles with long T1 relaxation times has proven challenging. Whilst hyperpolarized silicon microparticles have been tracked in vivo over long timescales,4,5 reducing the size of these microparticles to the more biologically interesting nanometer regime compromises their polarizability and spin-lattice relaxation times such that they are of limited use in an imaging context.6 Subsequently, attention has turned to 13C hyperpolarization of nanodiamonds via intrinsic paramagnetic centers.7-10 Here, we present 13C hyperpolarization measurements on nanodiamonds, showing that paramagnetic defect composition is critical to achieving both large signal enhancements and long spin-lattice relaxation times. We then perform 13C MRI with micro- and nanodiamonds to demonstrate hyperpolarized imaging over long timescales. In combination with the established use of nanodiamond as a vehicle for targeted drug delivery,11 these results further the potential of the nanoparticle platform.Methods
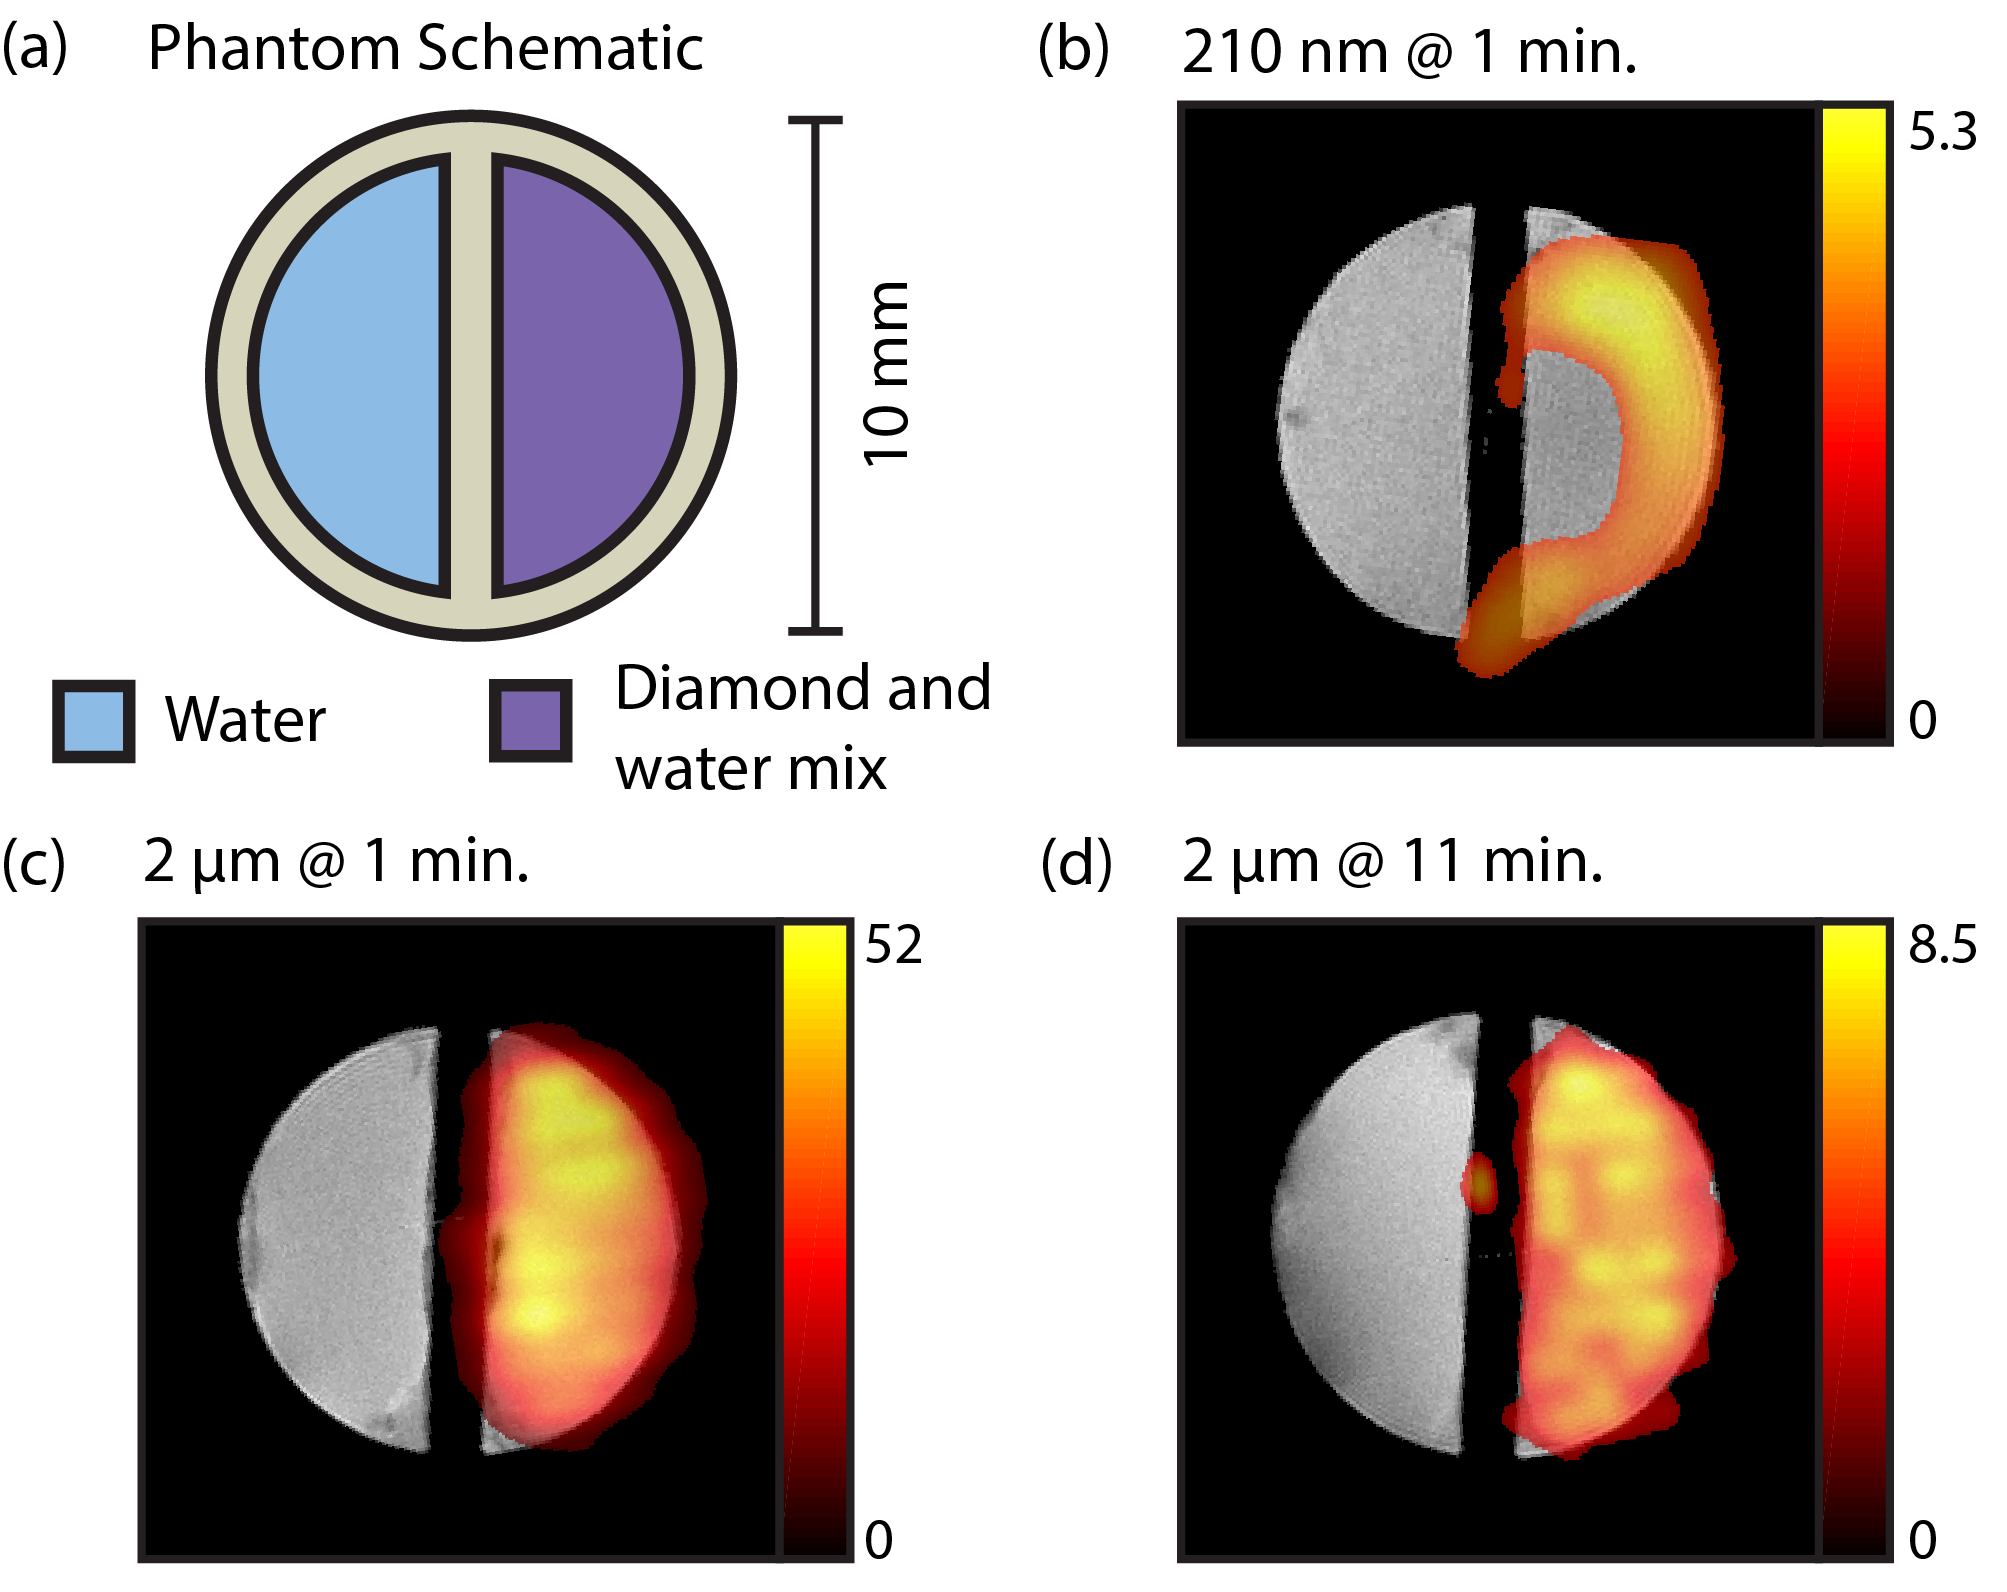
Synthetic and natural diamond particles were purchased from Microdiamant. 13C hyperpolarization of diamond particles was performed at 5 K and 2.88 T in a homebuilt system. Sample dissolution was completed in a 500 mT permanent magnet before transfer to a 7 T vertical-bore microimager. The custom phantom was loaded into a dual resonance 1H/13C 10 mm sample probe and imaged with a Fast Low Angle Shot (FLASH) sequence. 13C images were acquired with 0.7 mm x 0.8 mm resolution and interpolated onto a 0.1 mm x 0.1 mm grid. Values less than three standard deviations above the noise floor were set to zero. Coregistered 1H images were acquired with 0.1 mm x 0.1 mm resolution and 3 mm slice thickness.Results
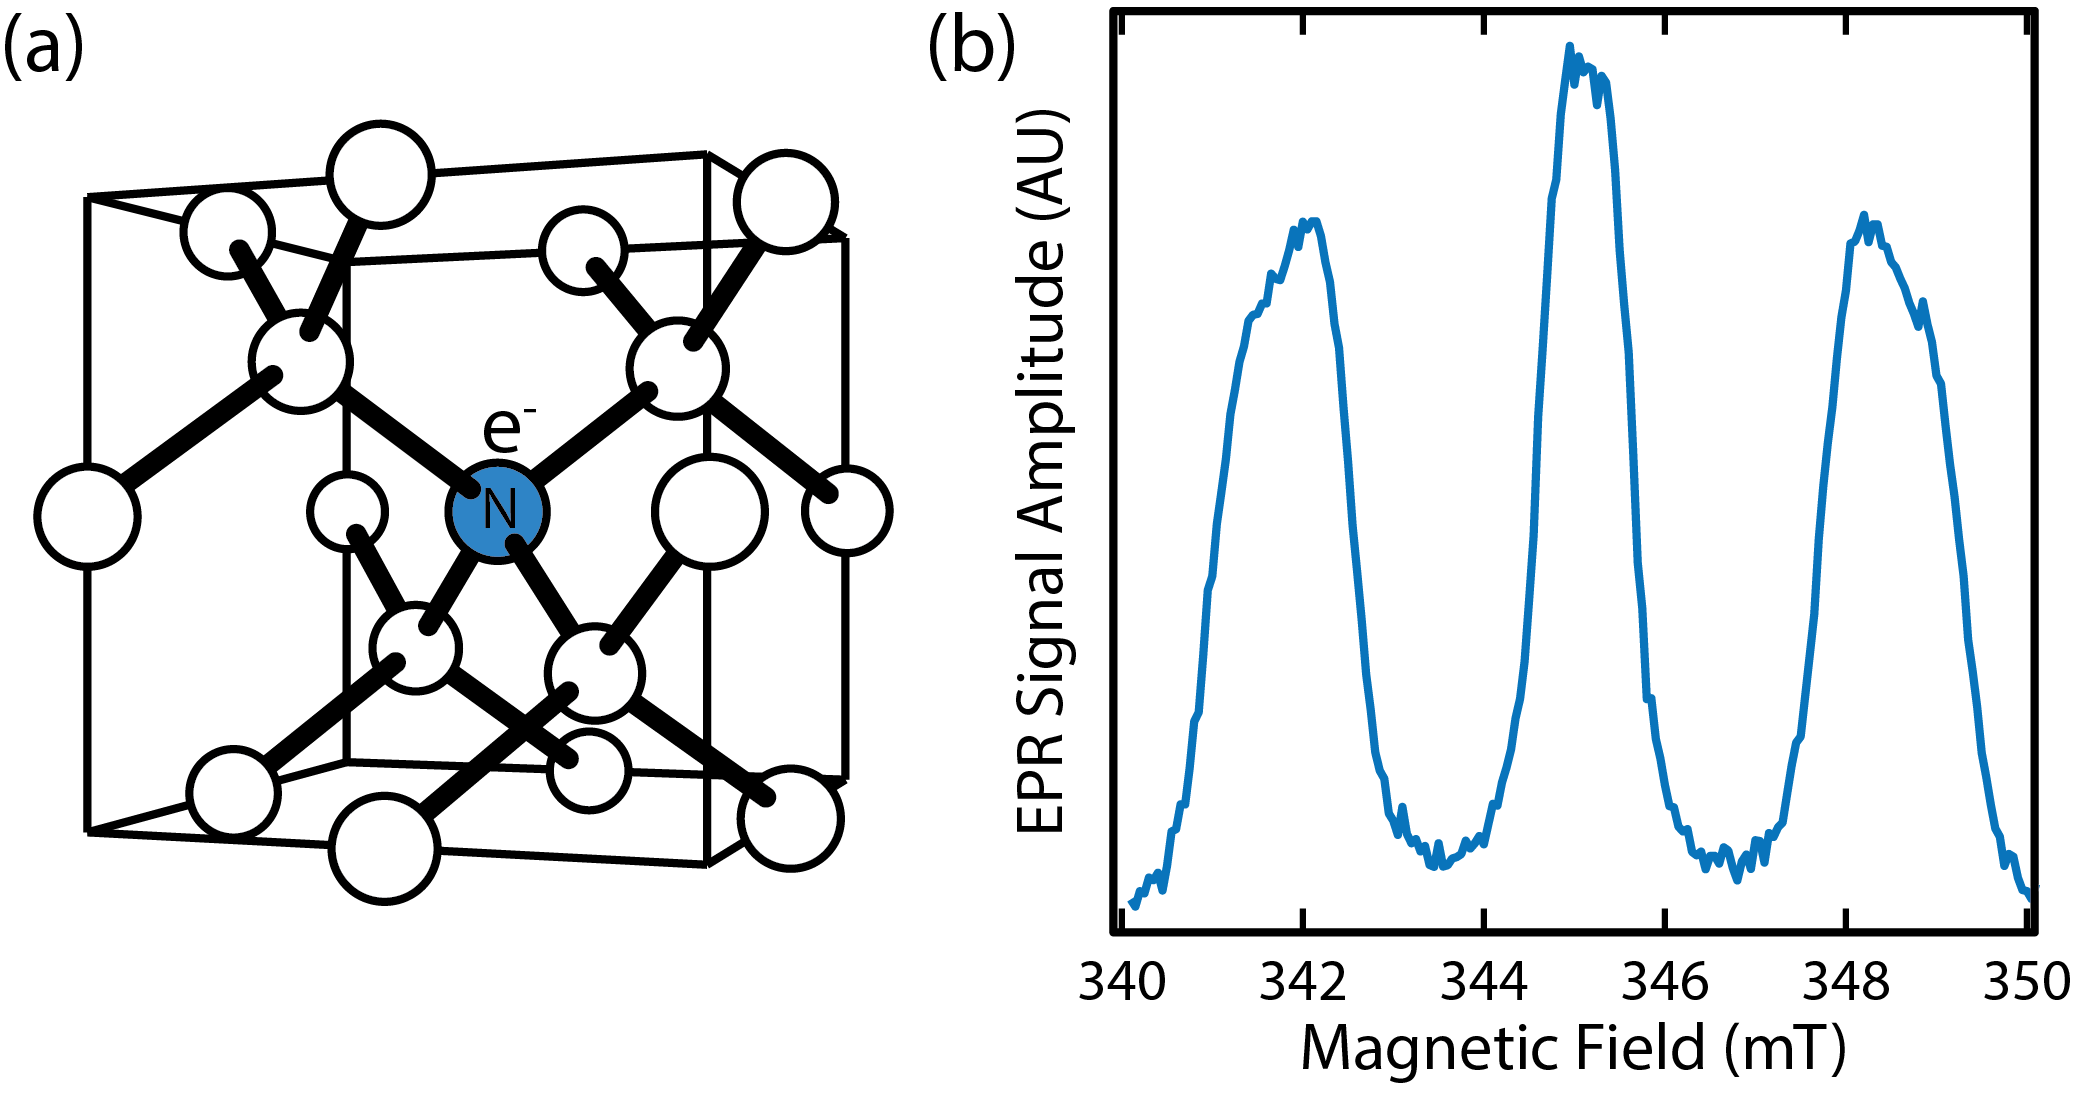
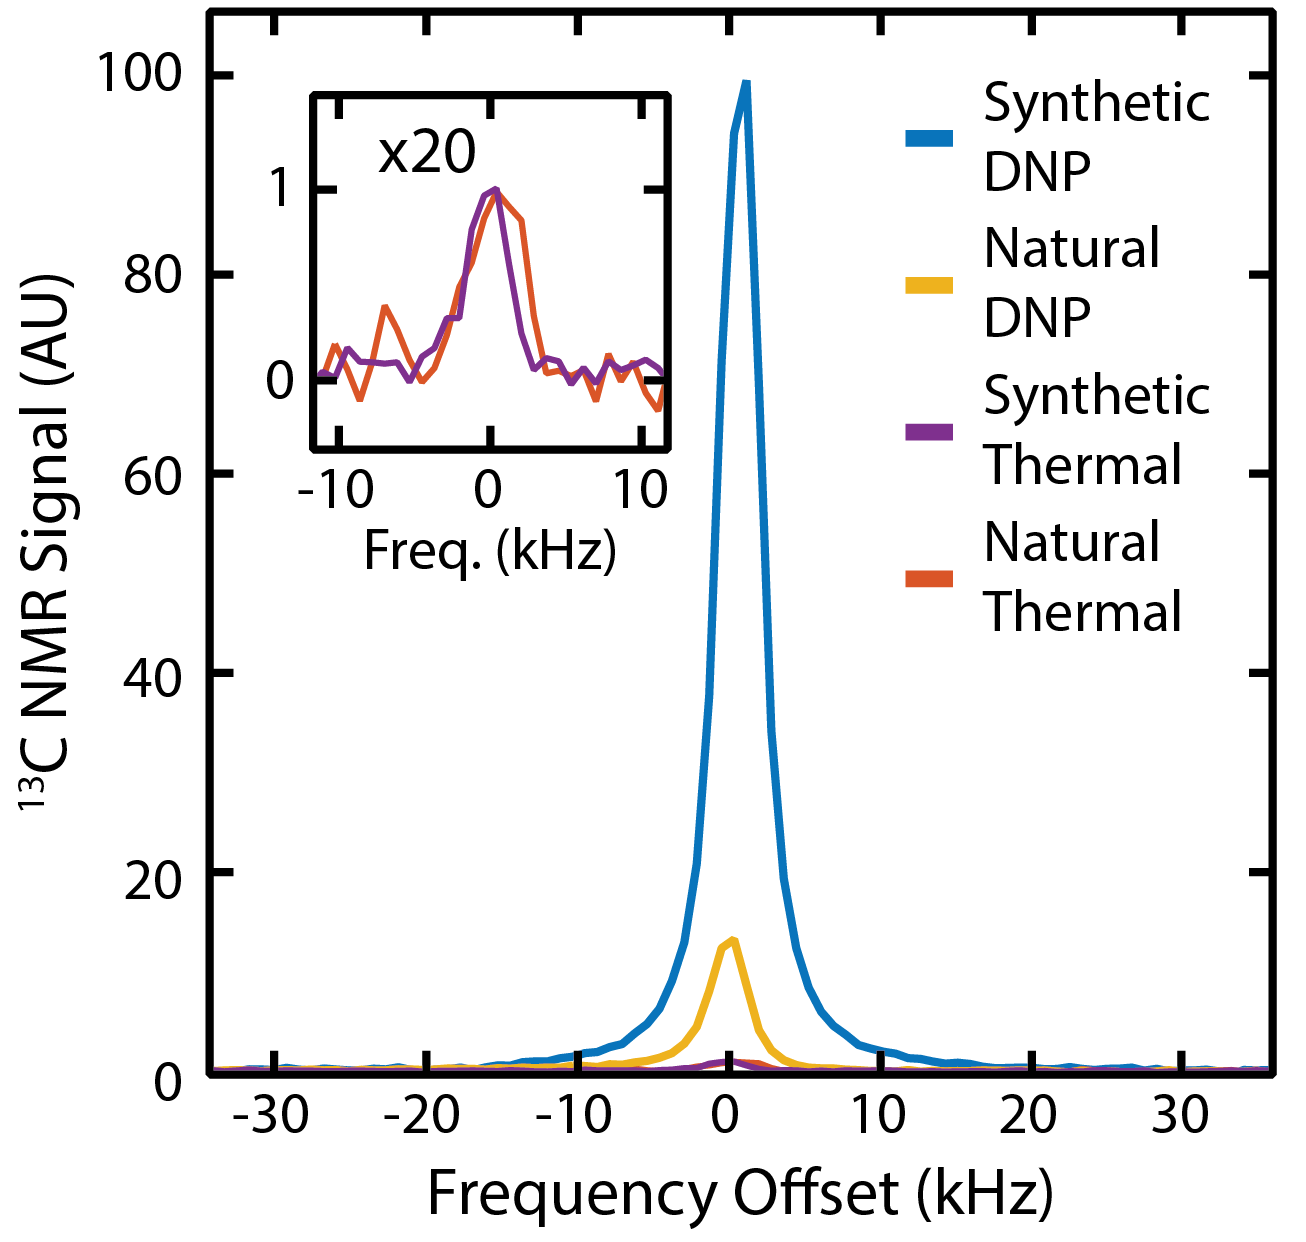
Pulsed EPR was used to characterize paramagnetic centres in samples before DNP experiments, revealing the presence of substitutional nitrogen atoms in a synthetic 210 nm nanodiamond sample, see Figure 1. These spin-1/2 defects, dispersed through the core of nanodiamonds,12 are present at a concentration of 44 ppm (2 x 10¹⁸ spins/g), comparable to that used in conventional dissolution DNP. The 210 nm particles have a nuclear T1 of 270 s at room temperature and 7 T, just 4 times smaller than comparable 2 µm particles despite a reduction in volume by a factor of 900. The solid effect is driven using microwaves at 80.82 GHz, corresponding to ωe- ωn of the substitutional defects. At 5 K, enhancements of 100-fold are seen in the synthetic 210 nm nanodiamonds, as shown in Figure 2, which is a 6000-fold enhancement in polarization over room temperature. For comparison, we also show that for natural 210 nm nanodiamonds, with lower defect concentrations of 5 ppm, only a 13-fold enhancement can be achieved. Background-free 13C imaging of hyperpolarized micro- and nanodiamonds in aqueous mixtures is presented in Figure 3. The distribution of hyperpolarized 210 nm and 2 µm particles was mapped using a FLASH sequence one minute after removal from the hyperpolarizer, see Figure 3(b) and 3(c). We also demonstrate that, with long T1 lifetimes, a hyperpolarized 13C image can be taken eleven minutes after removal from the hyperpolarizer in Figure 3(d).Discussion
Our results demonstrate the feasibility of using hyperpolarized 13C MRI to image nanodiamonds and highlight opportunities for future improvements. In particular, to address the significant polarization losses we incur during transfer (up to 97% of our hyperpolarized signal), we are constructing a new polarizer to keep the hyperpolarized sample at fields larger than 380 mT at all times. This development could increase sensitivity by up to an order of magnitude.13 Further sensitivity improvements are also possible through application of fast spin echo based techniques that leverage the long CPMG echo tails of dipolar solids.14 Our results also emphasise the importance of sample defect properties, guiding the discovery of nanodiamonds with improved DNP-MRI characteristics.Conclusion
We have applied the methodology of hyperpolarized 13C MRI to image micro- and nanodiamonds in phantoms. Overcoming the challenges we have identified will be critical to the application of this new imaging modality in biologically interesting regimes. Our results will motivate further research into the use of DNP-MRI and nanoparticles as a means of tracking in vivo activity over long timescales.Acknowledgements
This work was supported by the Australian Research Council Centre of Excellence Scheme (Grant No. EQuS CE110001013) ARC DP1094439 and the Lockheed Martin Corporation.References
1. Ardenkjaer-Larsen, J. H. et al. Increase in signal-to-noise ratio of > 10,000 times in liquid-state NMR. Proc. Natl. Acad. Sci. U. S. A. 100, 10158–63 (2003).
2. Day, S. E. et al. Detecting tumor response to treatment using hyperpolarized 13C magnetic resonance imaging and spectroscopy. Nat. Med. 13, 1382–1387 (2007).
3. Nelson, S. J. et al. Metabolic Imaging of Patients with Prostate Cancer Using Hyperpolarized [ 1- 13 C ] Pyruvate. Sci. Transl. Med. 5, 198ra108 (2013).
4. Cassidy, M. C., Chan, H. R., Ross, B. D., Bhattacharya, P. K. & Marcus, C. M. In vivo magnetic resonance imaging of hyperpolarized silicon particles. Nat. Nanotechnol. 8, 363–368 (2013).
5. Whiting, N. et al. Developing hyperpolarized silicon particles for in vivo MRI targeting of ovarian cancer. J. Med. Imag. 3, 36001 (2016).
6. Atkins, T. T. M. et al. Synthesis of Long T1 Silicon Nanoparticles for Hyperpolarized 29Si Magnetic Resonance Imaging. ACS Nano 7, 1609–1617 (2013).
7. Casabianca, L. B., Shames, A. I., Panich, A. M., Shenderova, O. & Frydman, L. Factors Affecting DNP NMR in Polycrystalline Diamond Samples. J. Phys. Chem. C 115, 19041–19048 (2011).
8. Dutta, P., Martinez, G. V. & Gillies, R. J. Nanodiamond as a New Hyperpolarizing Agent and Its 13 C MRS. J. Phys. Chem. Lett. 5, 597–600 (2014).
9. Rej, E., Gaebel, T., Boele, T., Waddington, D. E. J. & Reilly, D. J. Hyperpolarized nanodiamond with long spin-relaxation times. Nat. Commun. 6, 1–7 (2015).
10. Bretschneider, C. O. et al. On The Potential of Dynamic Nuclear Polarization Enhanced Diamonds in Solid-State and Dissolution 13 C NMR Spectroscopy. ChemPhysChem 1–12 (2016).
11. Chow, E. K. et al. Nanodiamond therapeutic delivery agents mediate enhanced chemoresistant tumor treatment. Sci. Transl. Med 3, 73ra21 (2011).
12. Orlinskii, S. B. et al. Identification of Substitutional Nitrogen and Surface Paramagnetic Centers in Nanodiamond of Dynamic Synthesis by Electron Paramagnetic Resonance. Nanosci. Nanotechnol. Lett. 3, 63–67 (2011).
13. Terblanche, C. J., Reynhardt, E. C., Rakitianski, S. A. & Van Wyk, J. A. 13C Spin–Lattice Relaxation in Natural Diamond: Zeeman Relaxation in Fields of 500 to 5000 G at 300 K Due to Fixed Paramagnetic Nitrogen Defects. Solid State Nucl. Magn. Reson. 19, 107–129 (2001).
14. Frey, M. a. et al. Phosphorus-31 MRI of hard and soft solids using quadratic echo line-narrowing. Proc. Natl. Acad. Sci. 109, 5190–5195 (2012).
Figures