3029
Longitudinal Investigation of the Metabolome of Developing 3D Aggregating Brain Cell Cultures at Different Maturation Stages by 1H HR-MAS NMR1Depts. Radiology and Clinical Research, University Bern, Bern, Switzerland, 2Dept. Chemistry and Biochemistry, University Bern, Bern, Switzerland, 3Dept. Physiology, Faculty of Biology and Medicine, University of Lausanne, Lausanne, Switzerland, 4Swiss Center for Applied Human Toxicology (SCAHT), Switzerland
Synopsis
3D rat brain aggregate model is an excellent tool for mechanistic studies including OMICS analysis. However, their metabolic profile have not been yet fully investigated. The aim was to investigate by 1H-HR-MAS NMR the metabolic fingerprint of 3D brain cell cultures at different maturation stages to establish a developmental profile of metabolic changes. Chemometric analysis revealed a clear separation of samples from the different maturation days. Metabolite concentration evolutions could be followed and revealed strong and various metabolic alterations. The strong metabolite evolution emphasizes the brain modelling complexity during maturation, possibly reflecting physiological processes of brain tissue development.
Introduction
Because of limited accessibility of brain for experimentation, together with ethical and economical concerns, there is considerable interest in culture models suitable for neurotoxicological research. The 3D rat brain aggregate model has proven to be the most sensitive and most reliable in-vitro model to detect CNS-specific toxicity1. It is composed of all brain cell types: neurons, astrocytes, oligodendrocytes and microglial cells. It presents a very high level of cell organization and function as indicated by the final ratio of neurons to glial cells, the timing and extent of developmental events such as cell proliferation, synaptogenesis, myelination and the elaboration of neuronal network. This cell culture system is an excellent tool for mechanistic studies including OMICS analysis. However, its metabolic profile has not been yet fully investigated. High-resolution magic-angle-spinning (HR-MAS) NMR is ideally suited for metabolomic investigations of these 3D cell cultures.
The aim of this study was to investigate, by employing 1H HR-MAS NMR, the metabolome of 3D brain cell cultures at different maturation stages in order to establish a developmental profile of metabolic changes to set up the basis for subsequent toxicological studies.
Material & Methods
Aggregating brain cell cultures: 3D aggregating brain cell cultures (AGGR) derived from embryonic (16-day) rat brain were prepared as previously described2.
Forty-two AGGR samples originating from four different brain batches were collected at five different time points, at days in vitro (DIV) 7, 14, 21, 28, and 35. Nine AGGR samples were harvested at each time point, with the exception of DIV35 (6 AGGR samples). Samples were washed, immediately transferred in dry ice and stored at -80°C until NMR measurement.
NMR Spectroscopy
Acquisition: 1H-HR-MAS NMR experiments were performed on a 500.13MHz Bruker Avance II spectrometer (Bruker BioSpin) at 3kHz spinning. Each AGGR sample was transferred with 15μl of PBS into a 50μl MAS rotor. A 1D-PROJECT sequence3 with water-presaturation was measured at 276K (512transients, spectral width=6010Hz, data size=32K points, acquisition time=2.73s, relaxation delay=4s, TE=400ms, rotor-synchronized interpulse delay=1.3ms).
Data Processing: Spectral processing was performed using Bruker TopspinTM software, including line-broadening, phasing and baseline-correction.
Analysis: 211 buckets of variable size according to the peak width were selected and normalized to total intensity. Chemometric analysis, including Principal Component Analysis (PCA) and Partial Least Squares (PLS) analysis using as prior knowledge the DIV as continuous observable variable, was performed with PLS_Toolbox (Eigenvector Research, Inc). Additionally, individual metabolite content evolution over different developmental stages was analyzed.
Results
Fig.1 shows the spectral assignment of 3D brain cell cultures collected at DIV7. Around 40 metabolites were assigned based on additional 2D-TOCSY measurements, own reference spectra, HMDB-database4 and literature5.
The samples exhibit strong metabolite evolution with time in culture (see Fig.2).
Chemometric analysis revealed clear separation of all samples among the different time-points, both using unsupervised PCA (Fig.3a) and supervised PLS (Fig.3b). The separation was strongest between days 7 and 14, i.e. main metabolic changes appeared at an early developmental stage. Loading plots of PLS1 and PLS2 suggest hypotaurine, taurine, choline, phosphocholine, and creatine as main discriminating (i.e. most strongly changing) metabolites (Fig.3c).
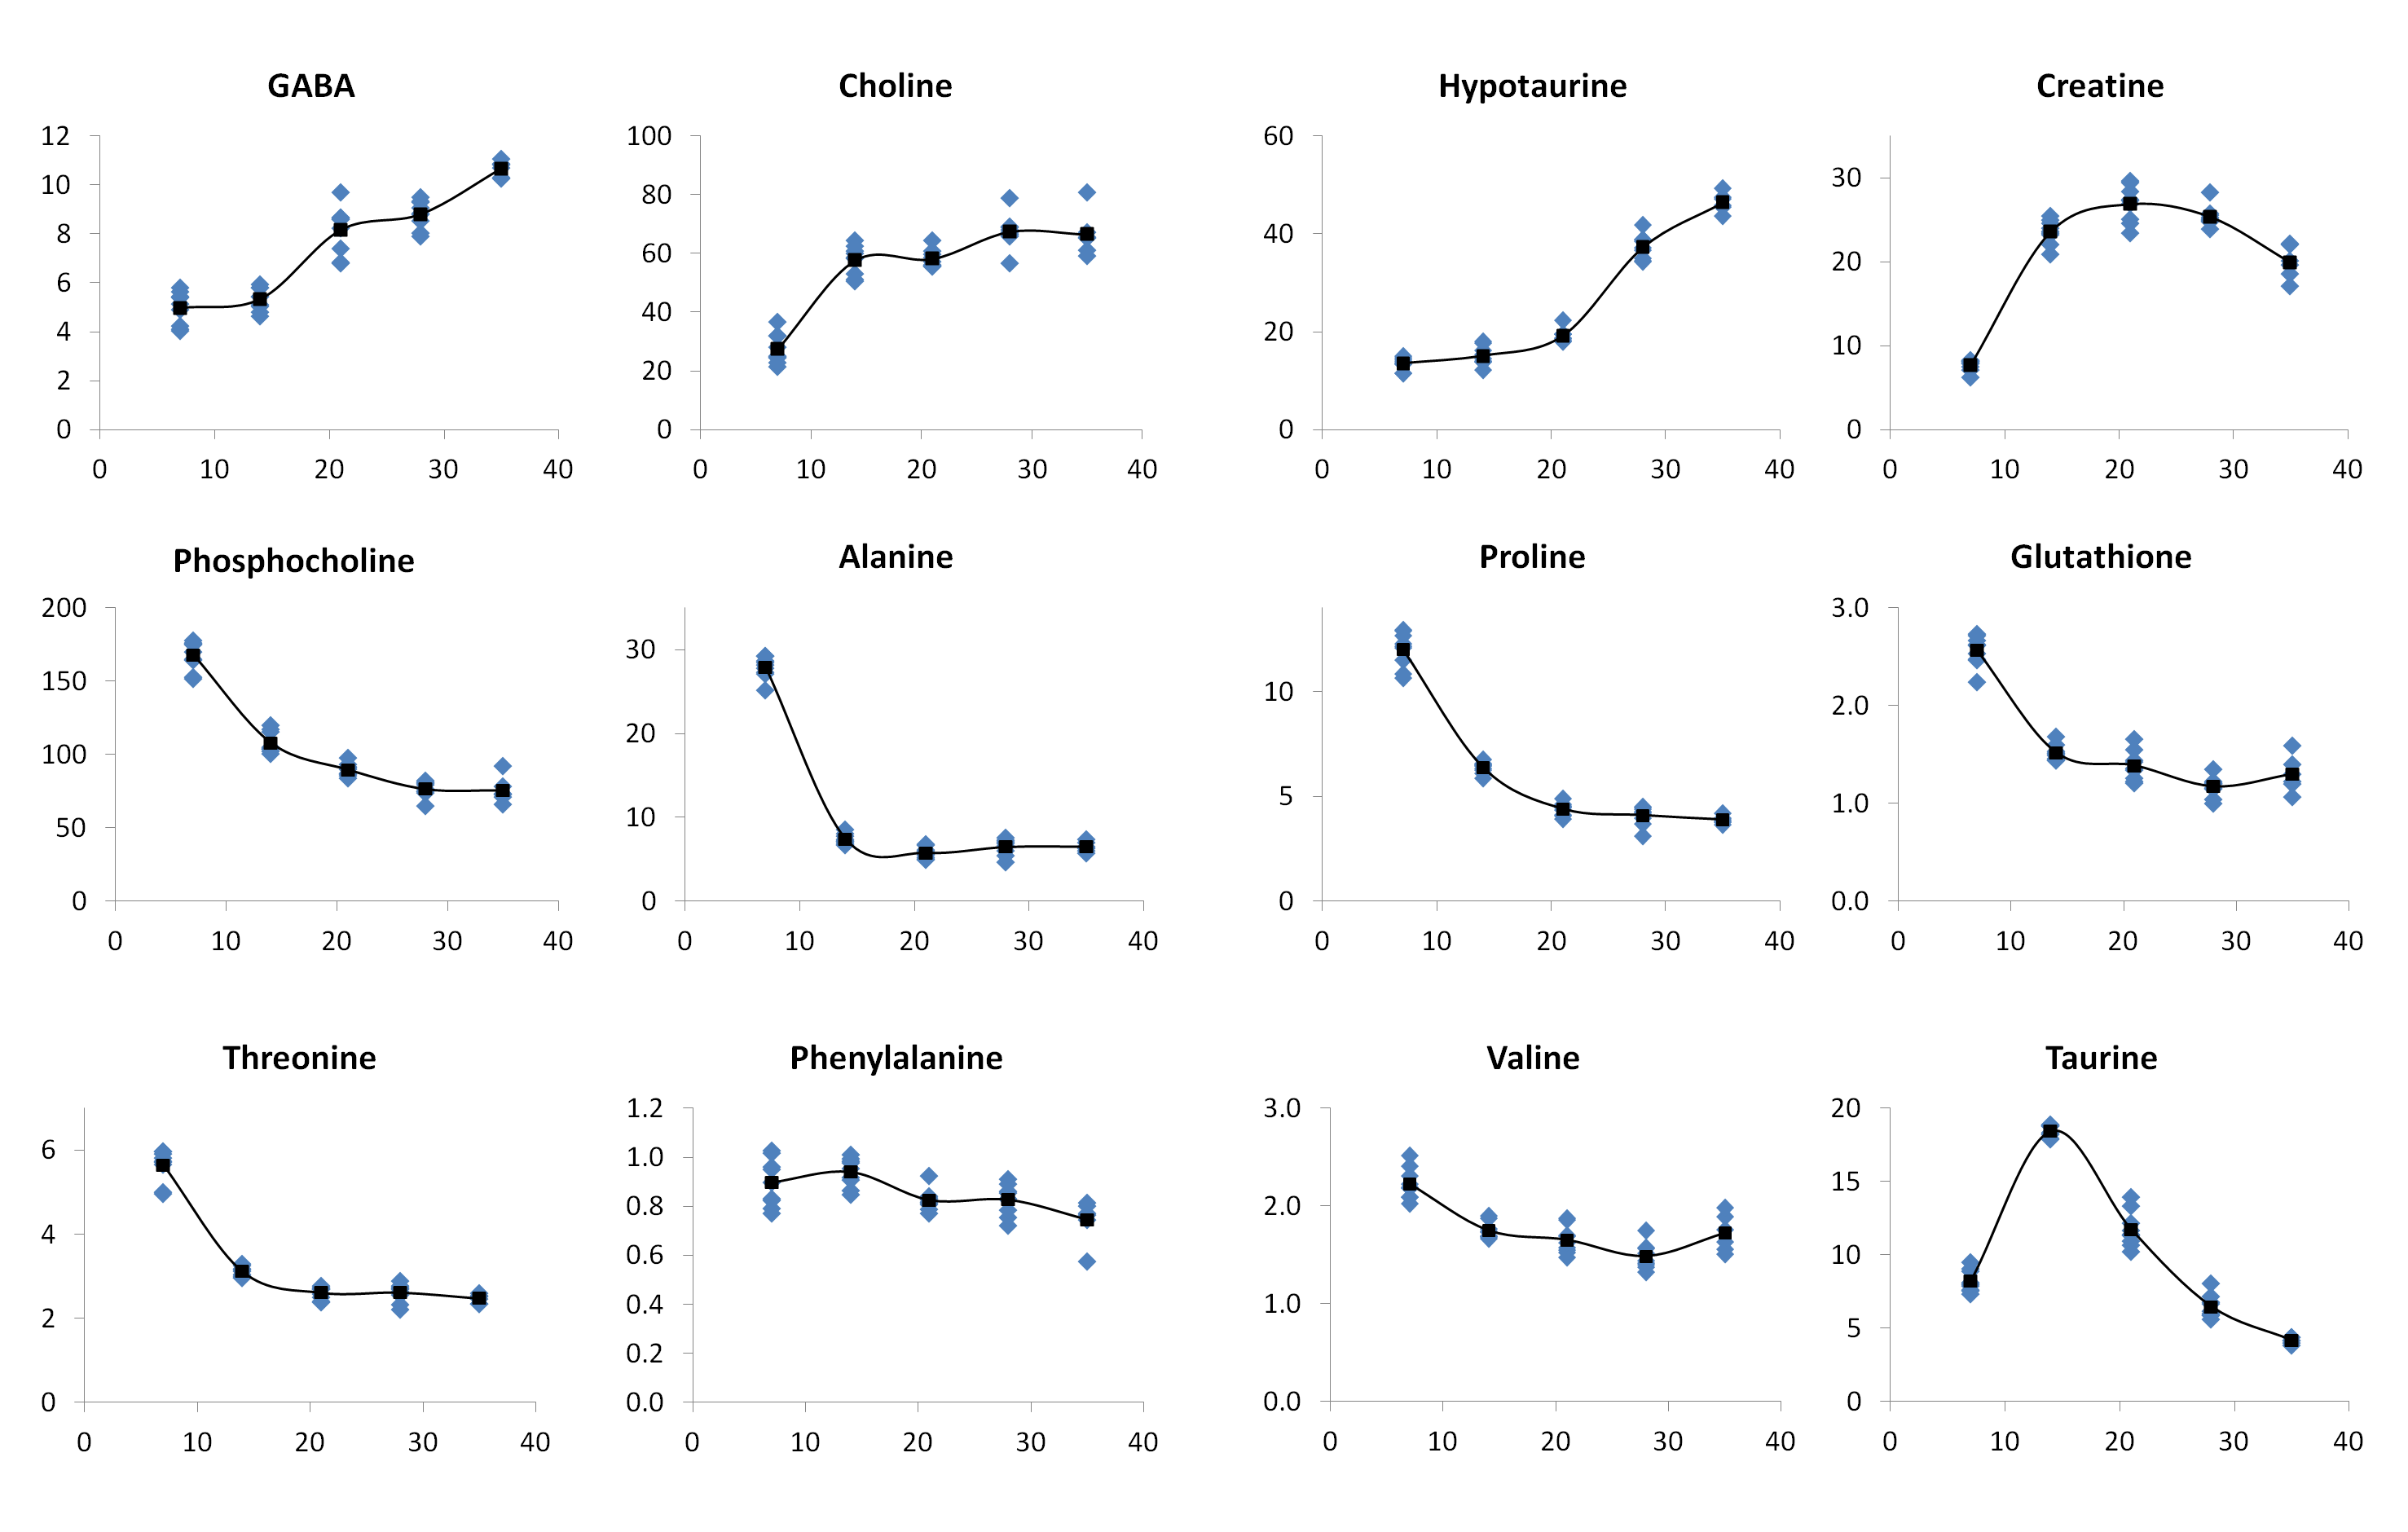
The analysis of individual metabolites over the developmental process revealed specific time courses (Fig.4). While some metabolites increase (GABA, choline, hypotaurine, creatine) or decrease over time (phosphocholine, alanine, proline, glutathione, threonine), some others are hardly affected (phenylalanine, valine). Some metabolites show a more complex evolution, such as taurine (decrease after initial increase). For some metabolites (alanine, proline, glutathione, creatine) strong changes occur primarily during the early maturation period.
Discussion & Conclusion
Time-dependant changes in intracellular metabolite concentration of 3D aggregating brain cell cultures could be followed by HR-MAS NMR. This high-content omic technique revealed strong and various metabolic alterations which emphasize the complexity of this culture system, and most likely reflect the physiological processes occurring during brain development.
Observed changes in metabolites with time in culture are in line with our previous observations. The increase in GABA, an important neurotransmitter and in choline, precursor of the neurotransmitter acetylcholine, are perfectly correlated with the maturation of neurons as observed by the increase in the mRNA and protein expression levels for neurofilaments, which are part of the neuronal cytoskeleton, and the increase in the activity of glutamic acid decarboxylase and acetylcholine esterase, enzymes specific for gabaergic and cholinergic neurons, respectively6. The observed decrease in glutathione content with time is also confirmed by spectrophotometric assay [unpublished data].
These results form the basis for subsequent toxicological investigations. Indeed, HR-MAS NMR in combination with the 3D brain aggregate model has potential to improve on current neurotoxicity testing by providing detailed information of altered cellular processes.
Acknowledgements
This work was supported by the UniBE ID-Grant (PV), Swiss National Science Foundation SNF grant # 200021_149438 (MV).References
1. Prieto P, Kinsner-Ovaskainen A, Stanzel S, et al. Toxicol. In Vitro 2013;27:1357.
2. Zurich MG, Monnet-Tschudi F, Costa LG, Schilter Bt, Honegger P. Aggregating brain cell cultures for neurotoxicological studies. In: In Vitro Neurotoxicology.Springer; 2004. p 243-266.
3. Aguilar JA, Nilsson M, Bodenhausen G, et al. Chemical Communications 2012;48:811.
4. Wishart DS, Jewison T, Guo AC, et al. Nucleic Acids Res. 2013;41:D801-D807.
5. Vermathen M, Paul LEH, Diserens G, et al. PLoS One 2015;10:e0128478.
6. Honegger P, Defaux A, Monnet-Tschudi F, et al. Methods Mol. Biol. 2011;758:81.
Figures
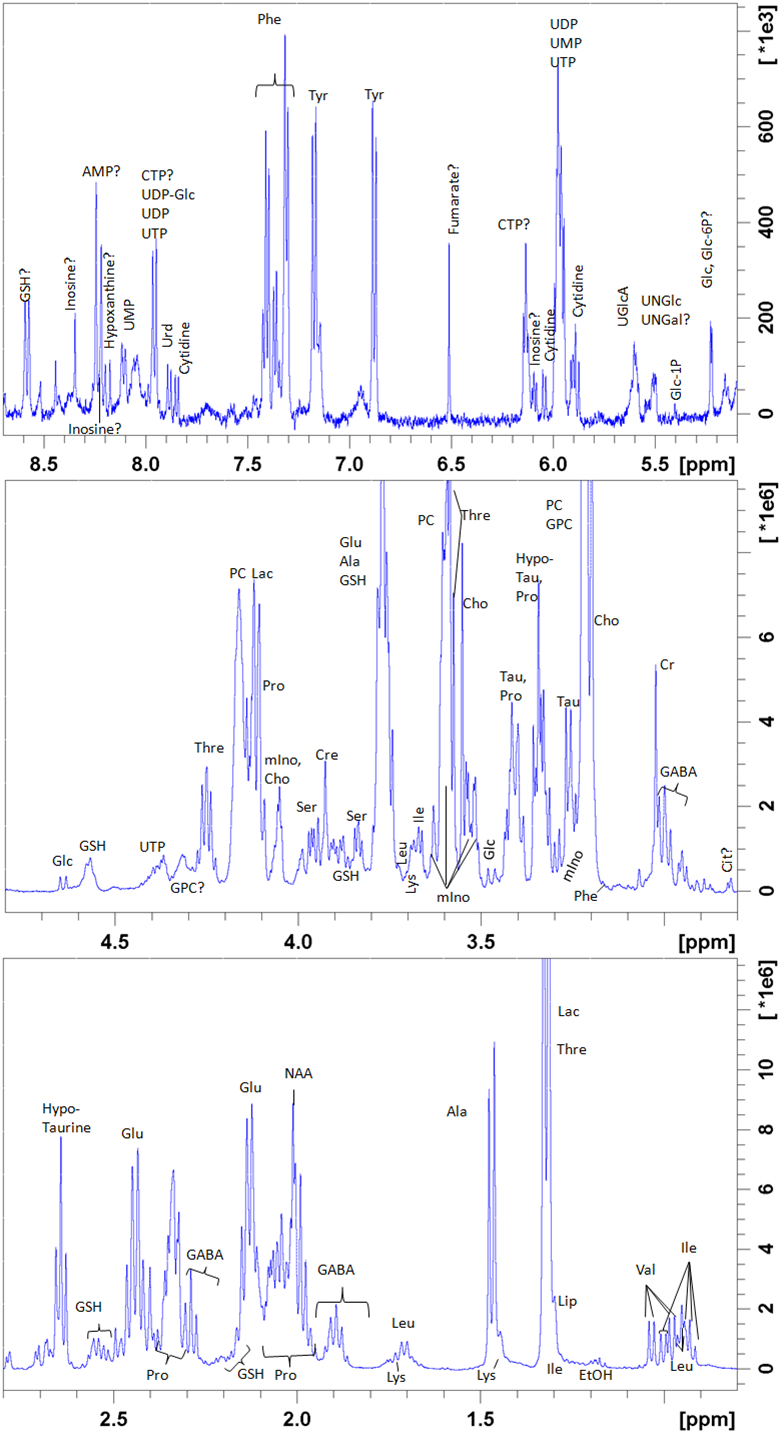
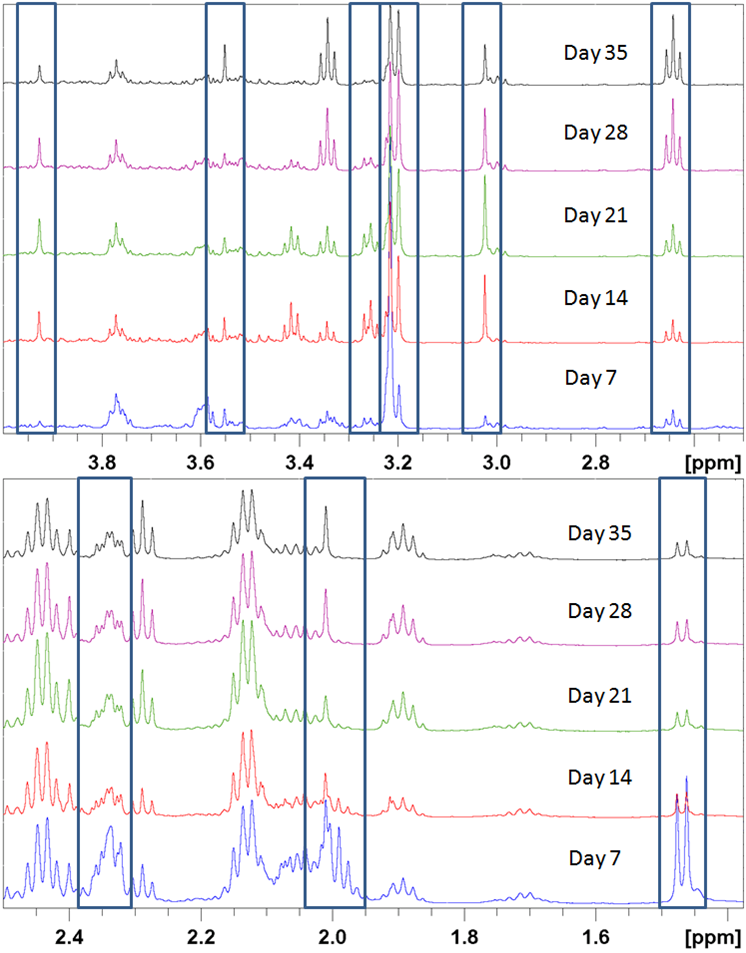
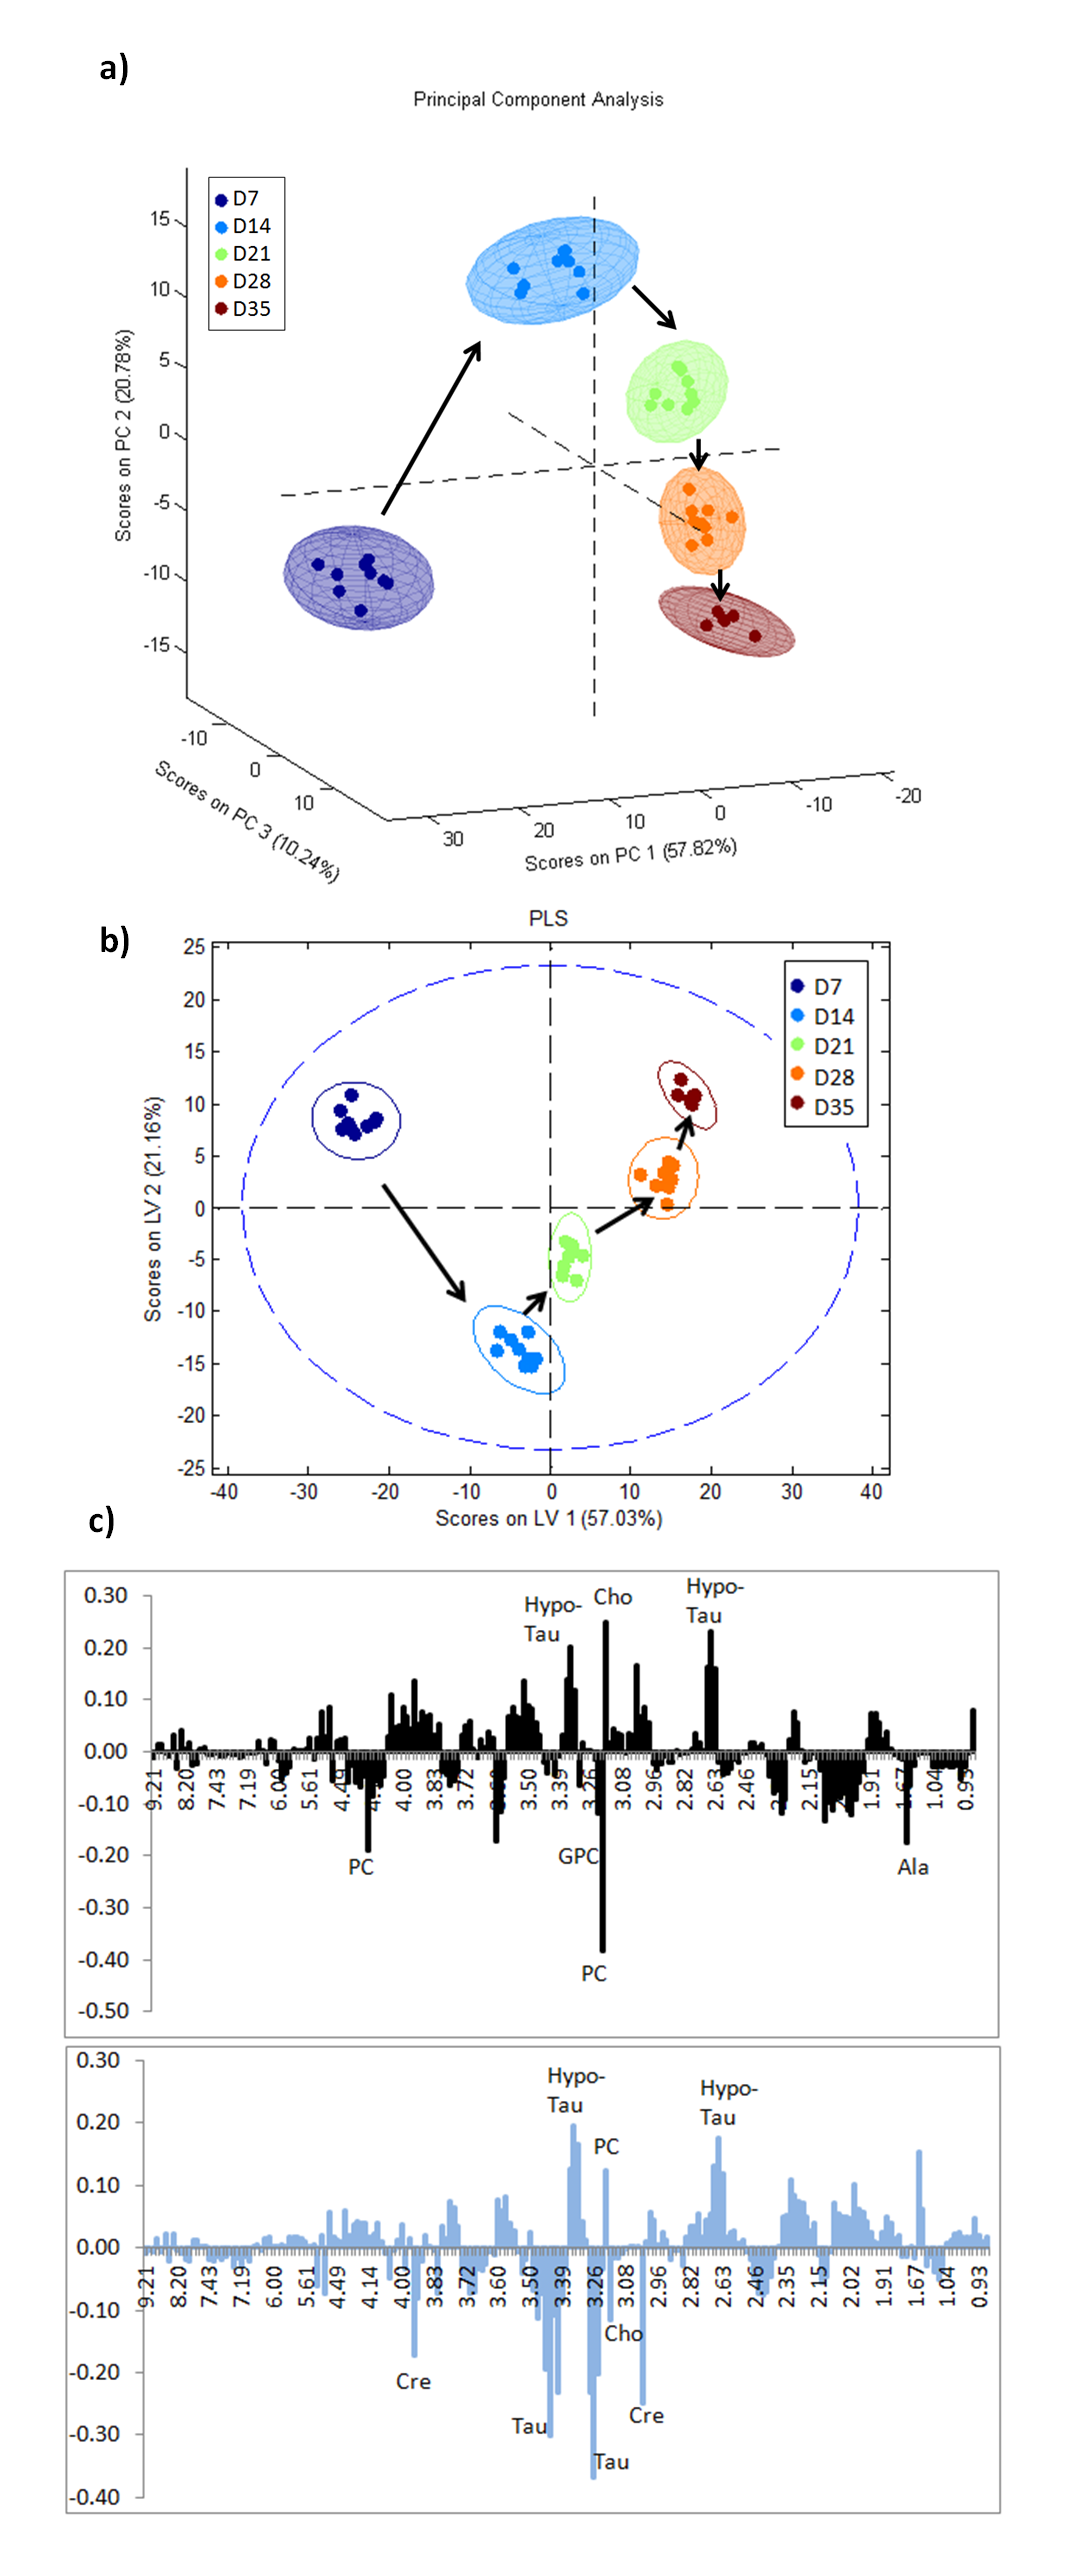
Fig.3 a) 3D-PCA scores plot of 3D brain cell cultures measured at five different developmental stages (DIV7, 14, 21, 28, 35) representing PC1, PC2 and PC3. A clear separation between the different maturation stages can be seen. Arrows show the evolution over time. Main metabolic changes happen in the earlier phases of culture.
b) PLS scores plot of brain 3D cell cultures measured at five different time-points (DIV7, 14, 21, 28, 35). A clear separation between the different time-points is seen on both LV1 and LV2.
c) PLS Loading plots with the main discriminating metabolites labelled - Top LV1 - Bottom LV2.