3028
PROTON NMR METABOLIC PROFILING OF CSF REVEALS DISTINCT DIFFERENTIATION OF MENINGITIS WITH NEGATIVE CONTROLS1Departent of Microbiology, Dr. Ram Manohar Lohia Institute of Medical Sciences, Lucknow, India, 2Centre of Biomedical Research, Lucknow, India, 3Department of Neurology, Dr. Ram Manohar Lohia Institute of Medical Sciences, Lucknow, India, 4Department of Microbiology, Dr. Ram Manohar Lohia Institute of Medical Sciences, Lucknow
Synopsis
The chemical composition of cerebrospinal fluid (CSF) in central nervous system (CNS), varies during onset of meningitis, neurodegenerative disorders and in traumatic cases.The study attempted to observe the metabolic variation in meningitis cases, negative controls and positive controls. Further differentiation among the groups was carried out using Principal Component Analysis (PCA) followed by Partial Least Square Discriminant Analysis (PLS-DA).On the basis of metabolic profile it was found that negative control CSF samples are more appropriate for differentiation of meningitis than positive control CSF samples.The biomarkers identified were ketone bodies, amino acids, propylene glycol, citrate and creatine/creatinine.
PURPOSE
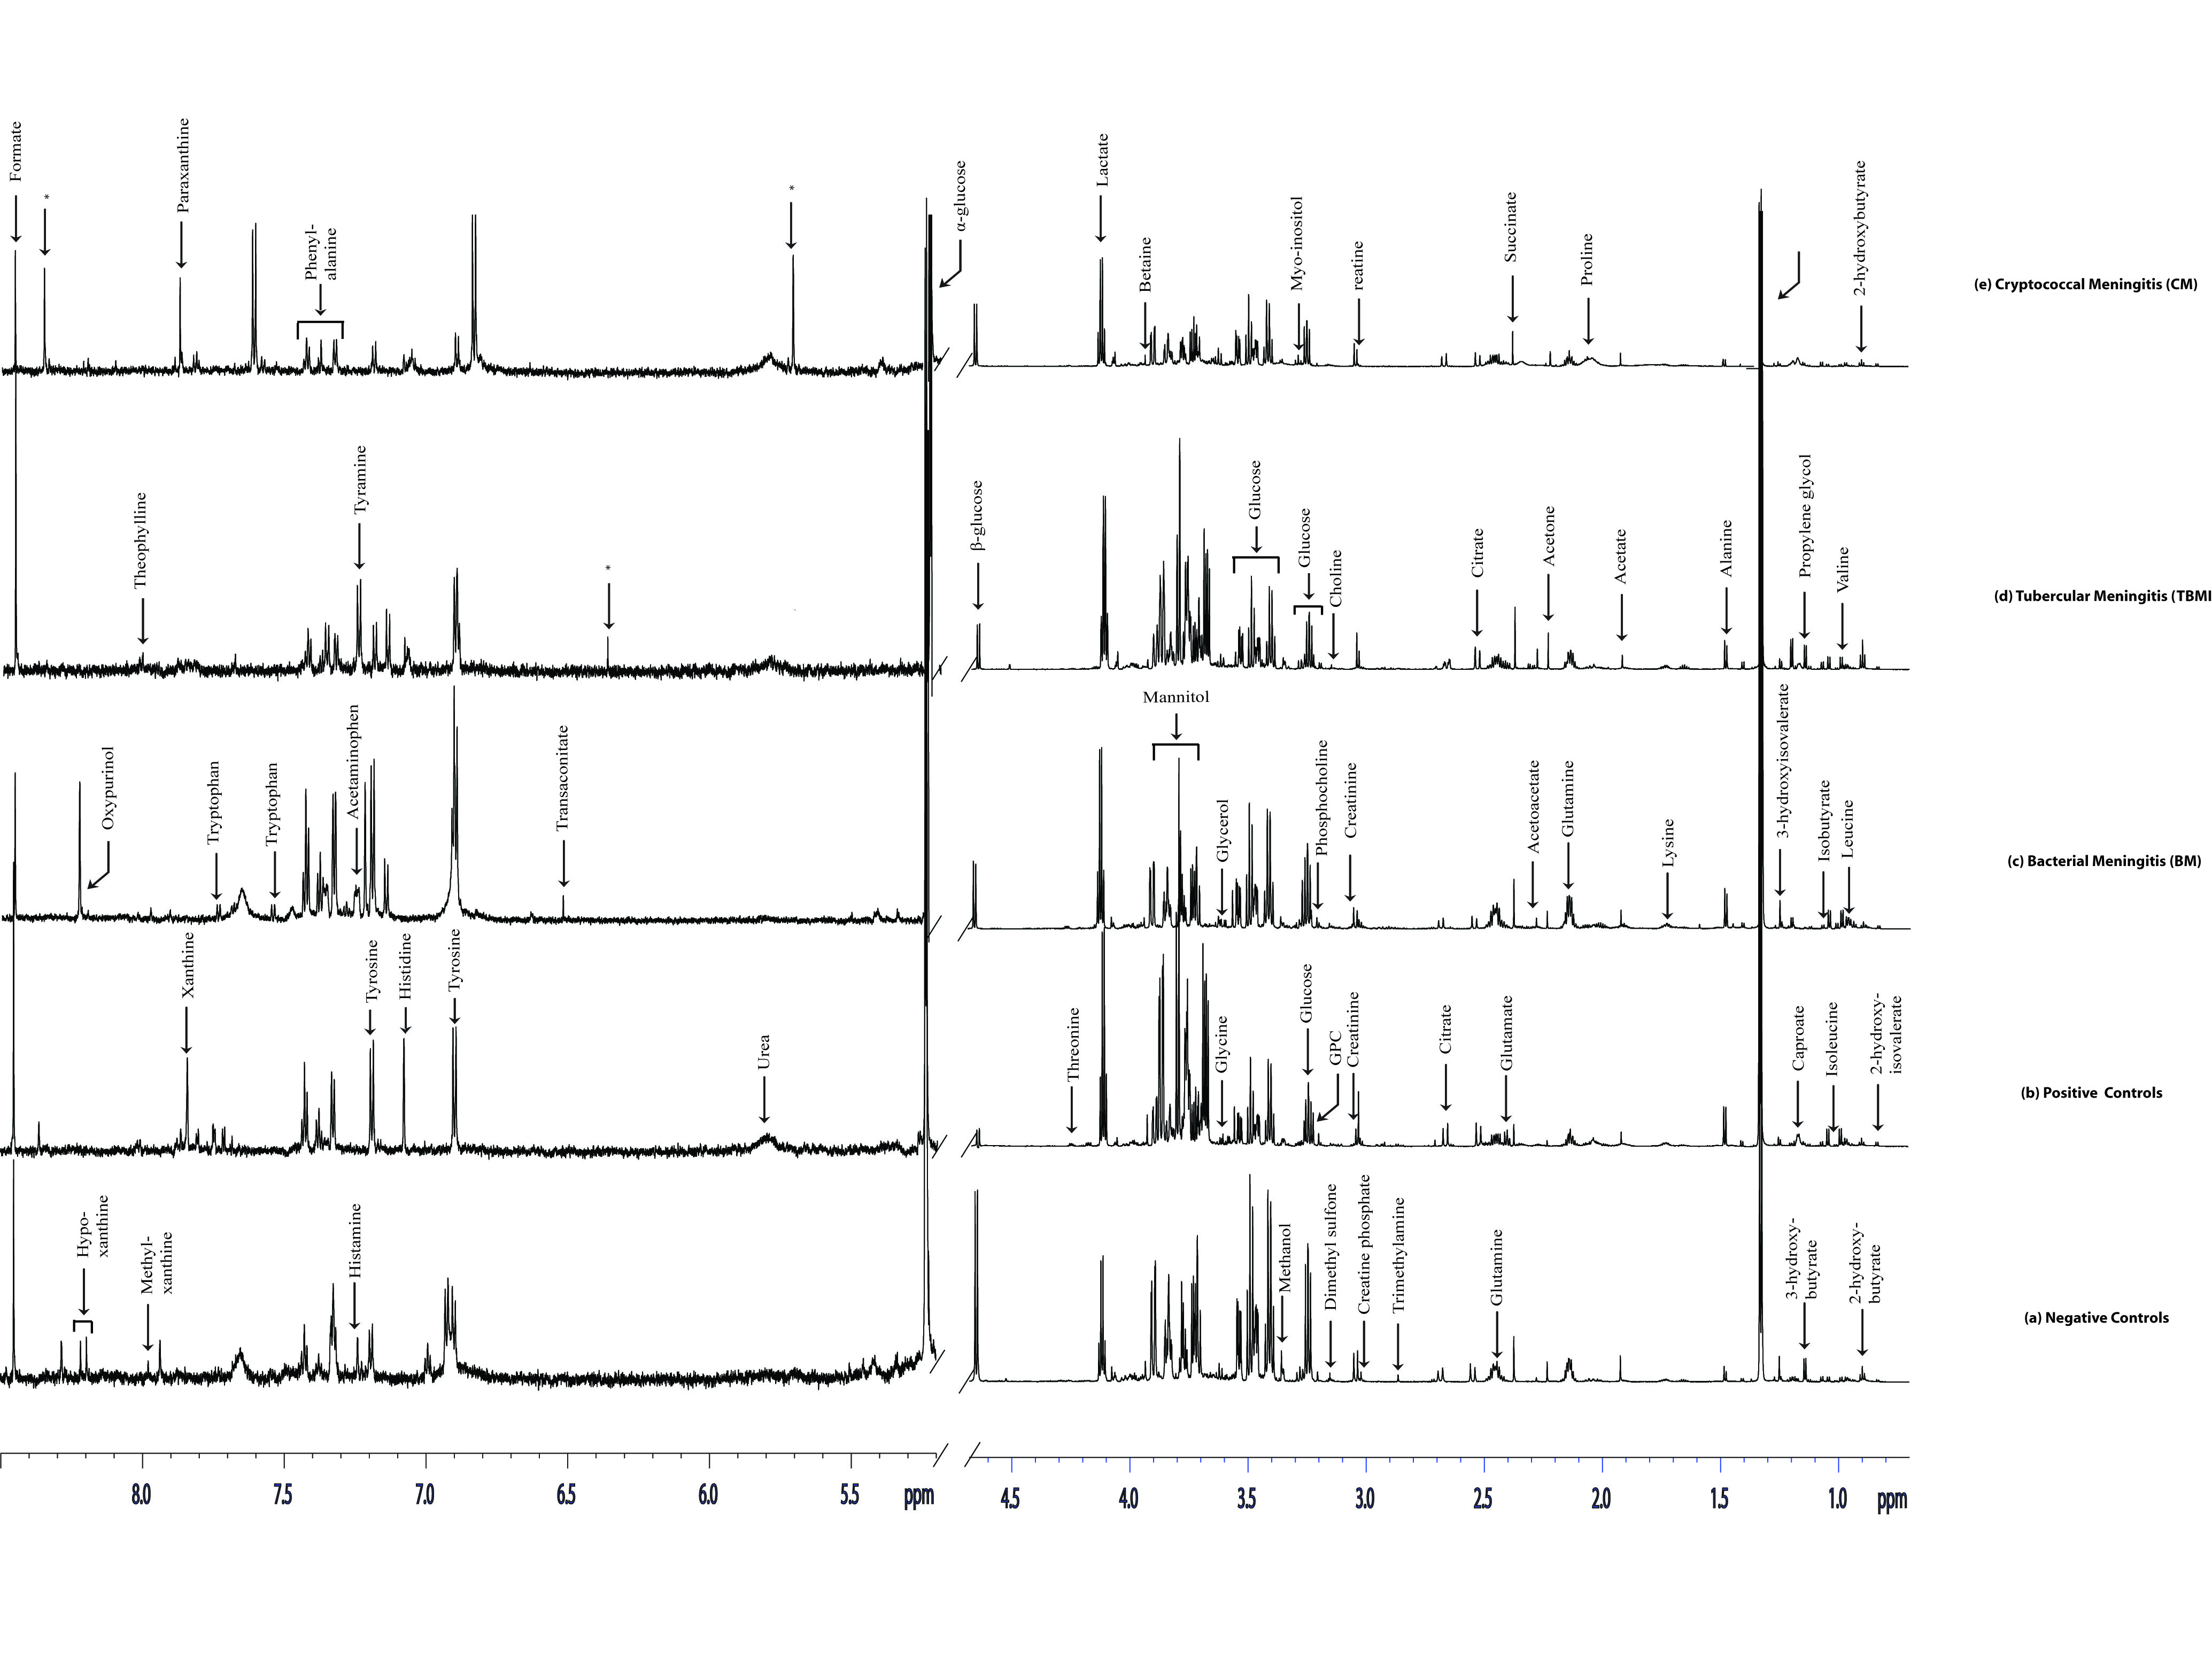
The proposed study had been performed in order to compare metabolic profiling in CSF of meningitis cases with negative controls and meningitis cases with positive controls in adults using NMR spectroscopy (Figure 1).INTRODUCTION
Cerebrospinal fluid (CSF) a sterile body fluid predominantly produced from arterial blood by the choroid plexuses by a combined process of diffusion followed by pinocytosis and active transfer1. CSF is in direct contact with meninges therefore, infection and inflammation of the meninges may also cause changes in the metabolic picture of the CSF. Altered chemical composition has earlier been observed in CSF during neurodegenerative disorders and meningitis1,2. It was therefore, hypothesized that CSF samples of traumatic subjects which act as negative controls are needed for comparing with meningitis in order to observe the metabolic profile effectively, as the traumatic CSF are generally not infected.This particular study also intends to compare the metabolic variation of meningitis with positive controls (neurological disorders).MATERIALS AND METHODS
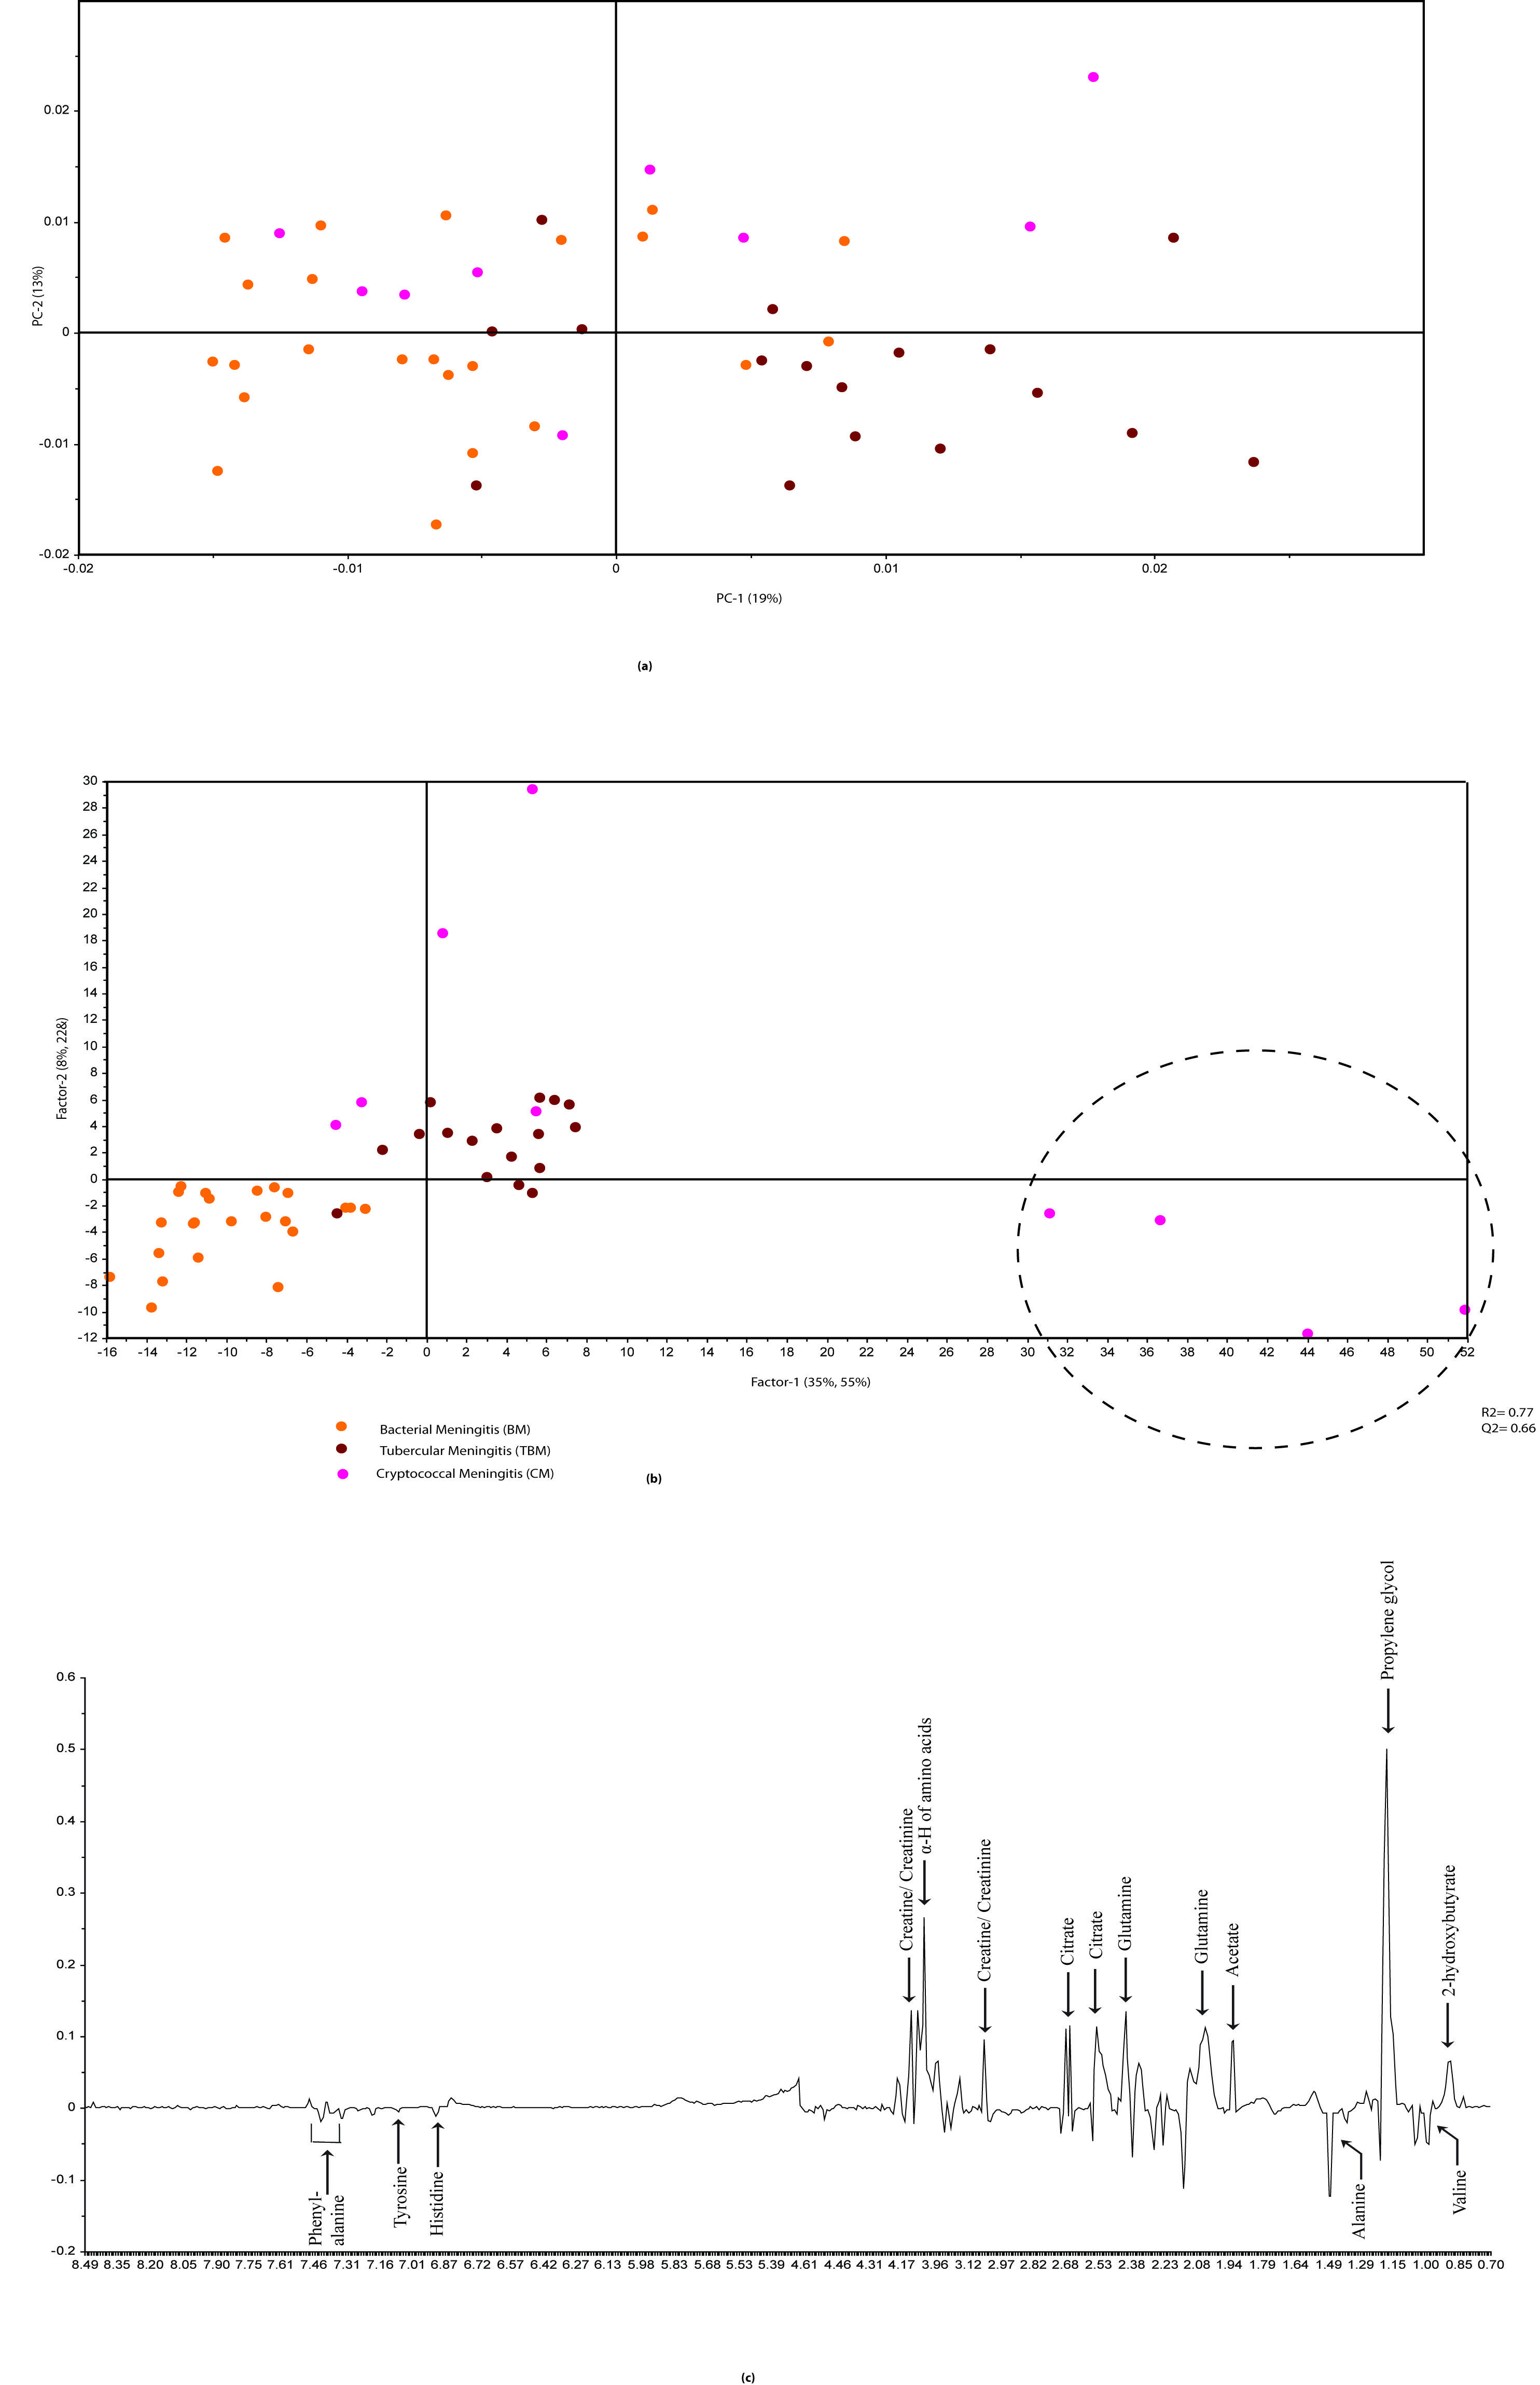
Adult subjects (n=105) were enrolled for the study and were broadly classified into 3 categories: negative controls (traumatic cases) (n=26), positive controls (neurological disease control subjects) (n=30) and meningitis cases (n=49).Traumatic patients were considered as acute spinal cord injury (ASCI) while positive control group mainly comprised of clinically confirmed patients suffering from neurological disorders like migraine, microcytic anemia, lumbar arachnoiditis, cranial nerve palsy, paraparesis and hemiparesis. Meningitis cases was broadly classified into three major categories based on the type of meningitis viz. Bacterial Meningitis (BM; n=23); Tubercular meningitis (TBM; n=17); and Cryptococcal meningitis (CM; n=9) (Figure 2). CSF sample was collected using standard protocol after receiving the consent. The NMR spectra were acquired using Avance III 800 MHz NMR spectrometer (BrukerGmBH, Germany). One-dimensional NOESY-preset and CPMG experiments were recorded in all the samples.The spectra binned into uniform buckets of 0.01 ppm using Amix software (version 3.8.7, BrukerBiospin, Germany), eliminating lactate, glucose, mannitol and water regions. Unsupervised multivariate PCA followed by supervised PLS-DA, demonstrating the explained total variance and R2 and Q2 values was performed using ‘The Unscrambler’ software package (Version 10.0.1, Camo ASA, Norway).RESULTS
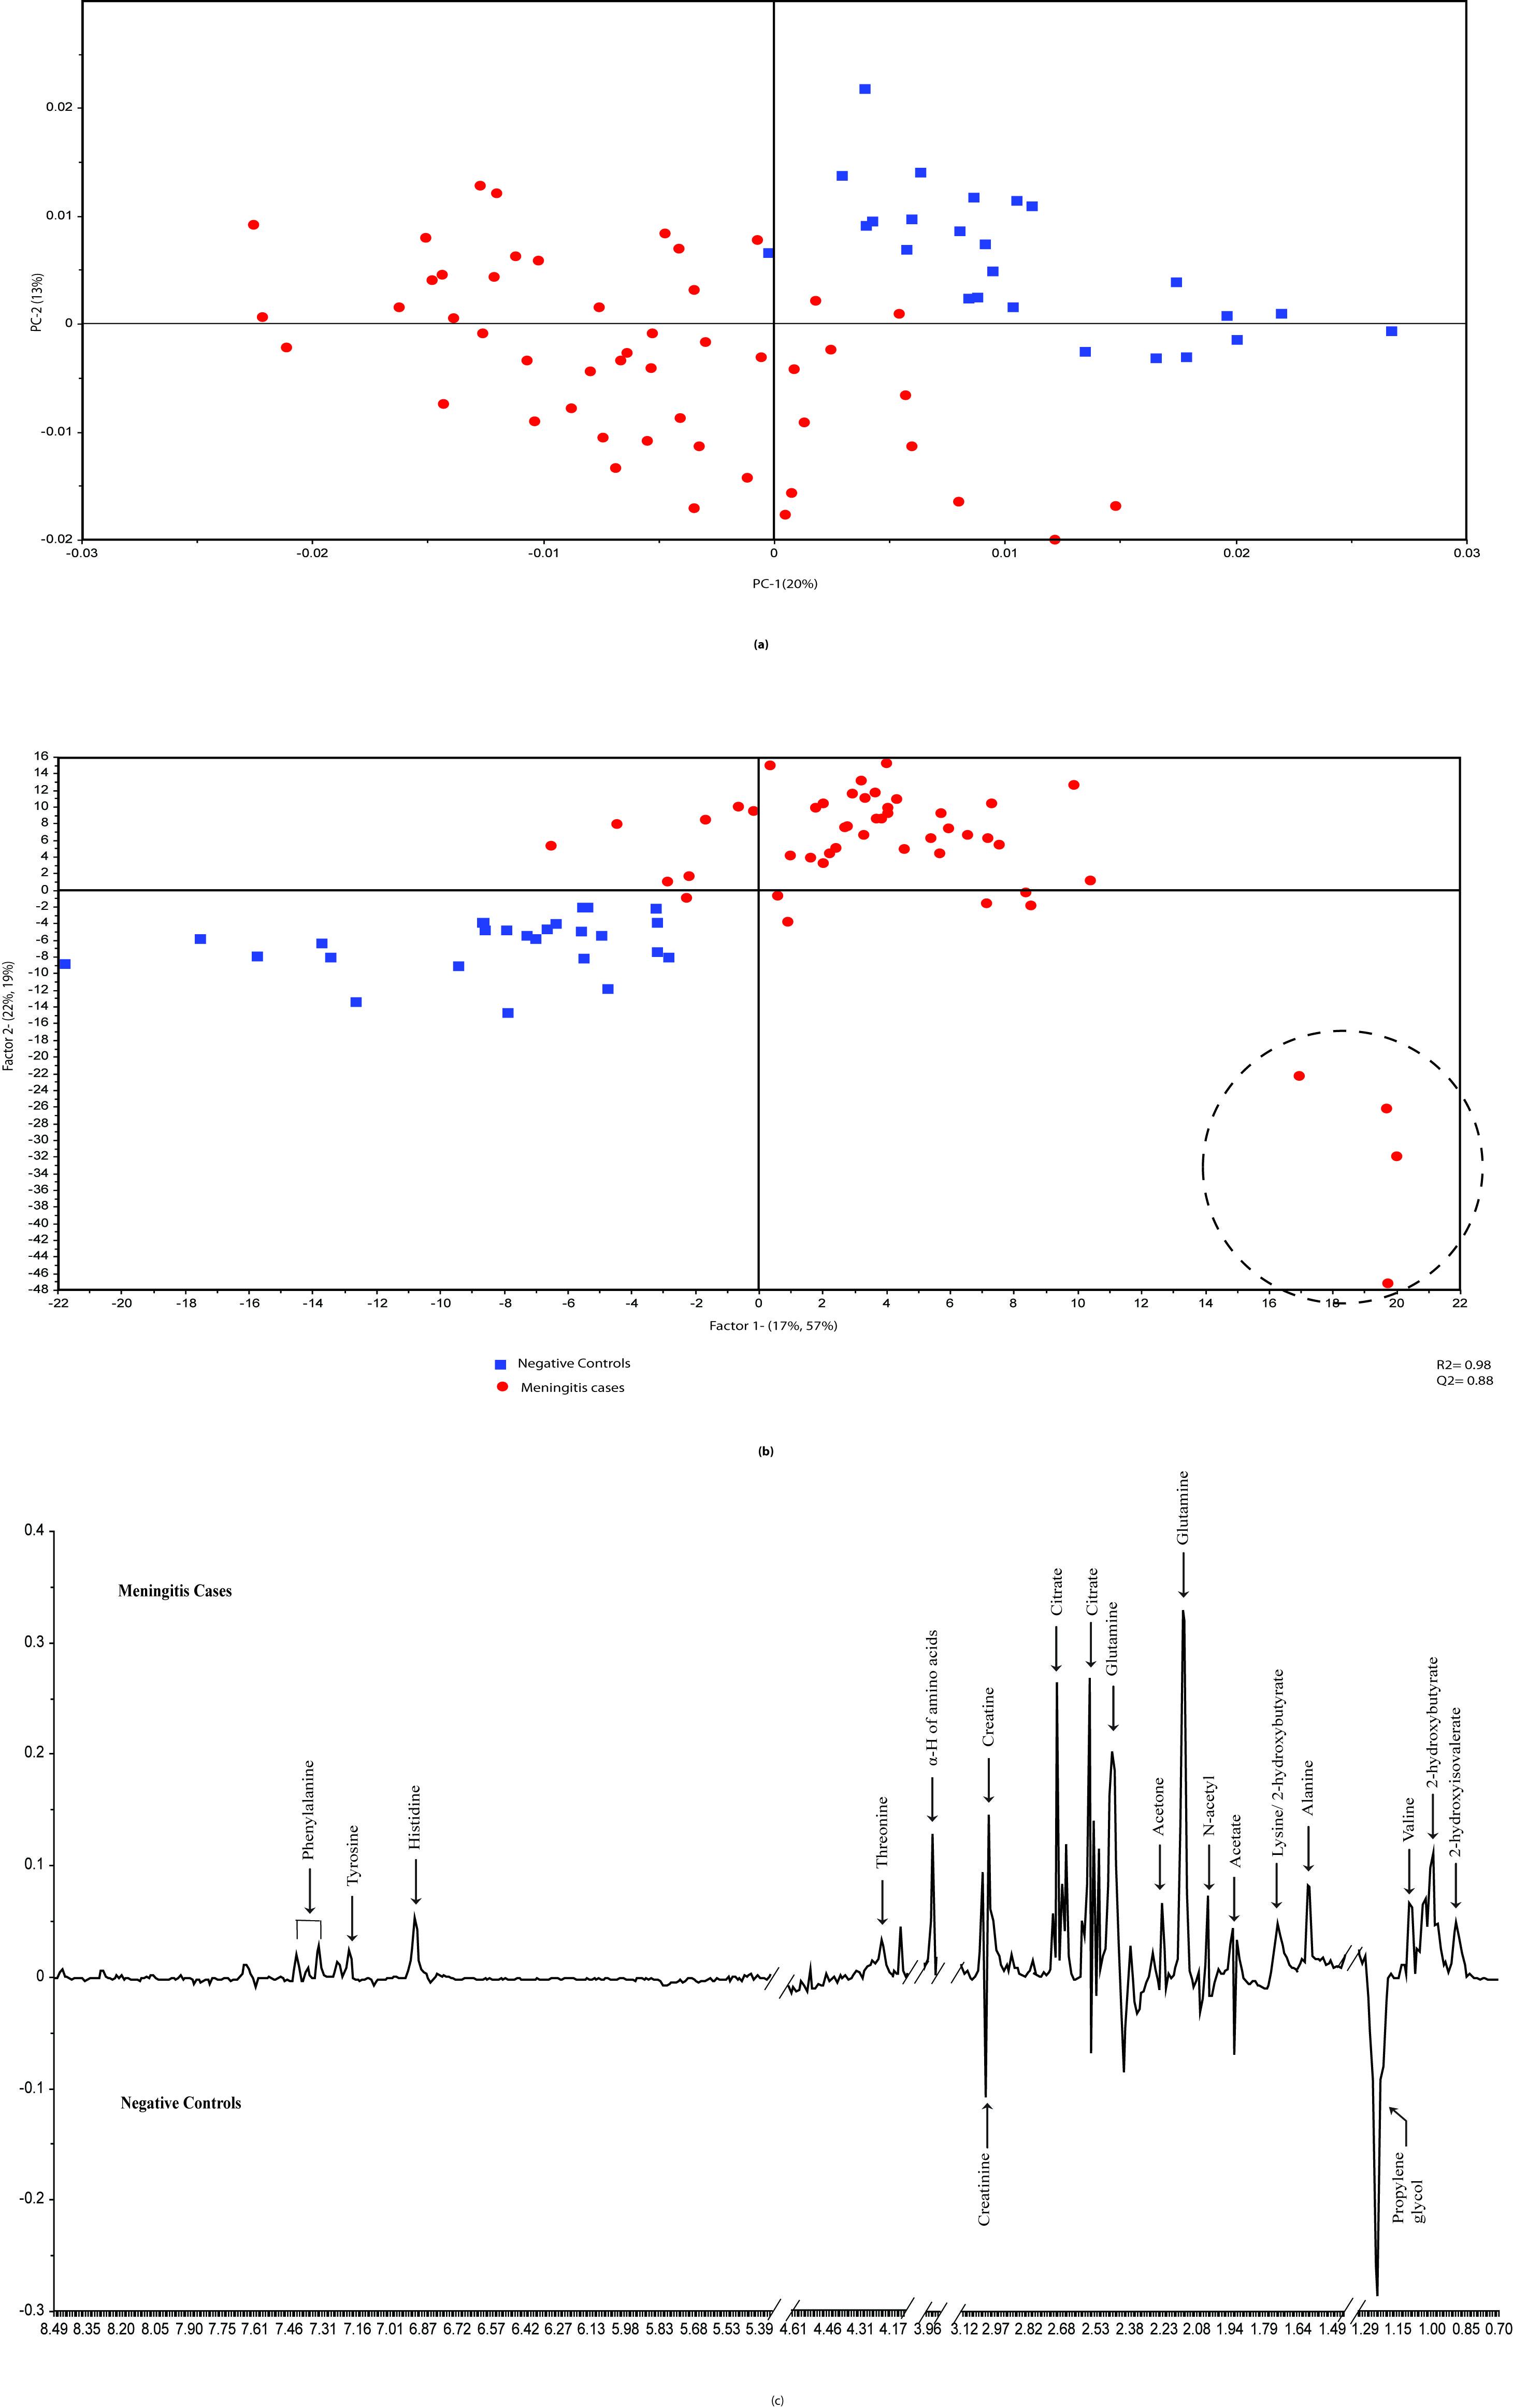
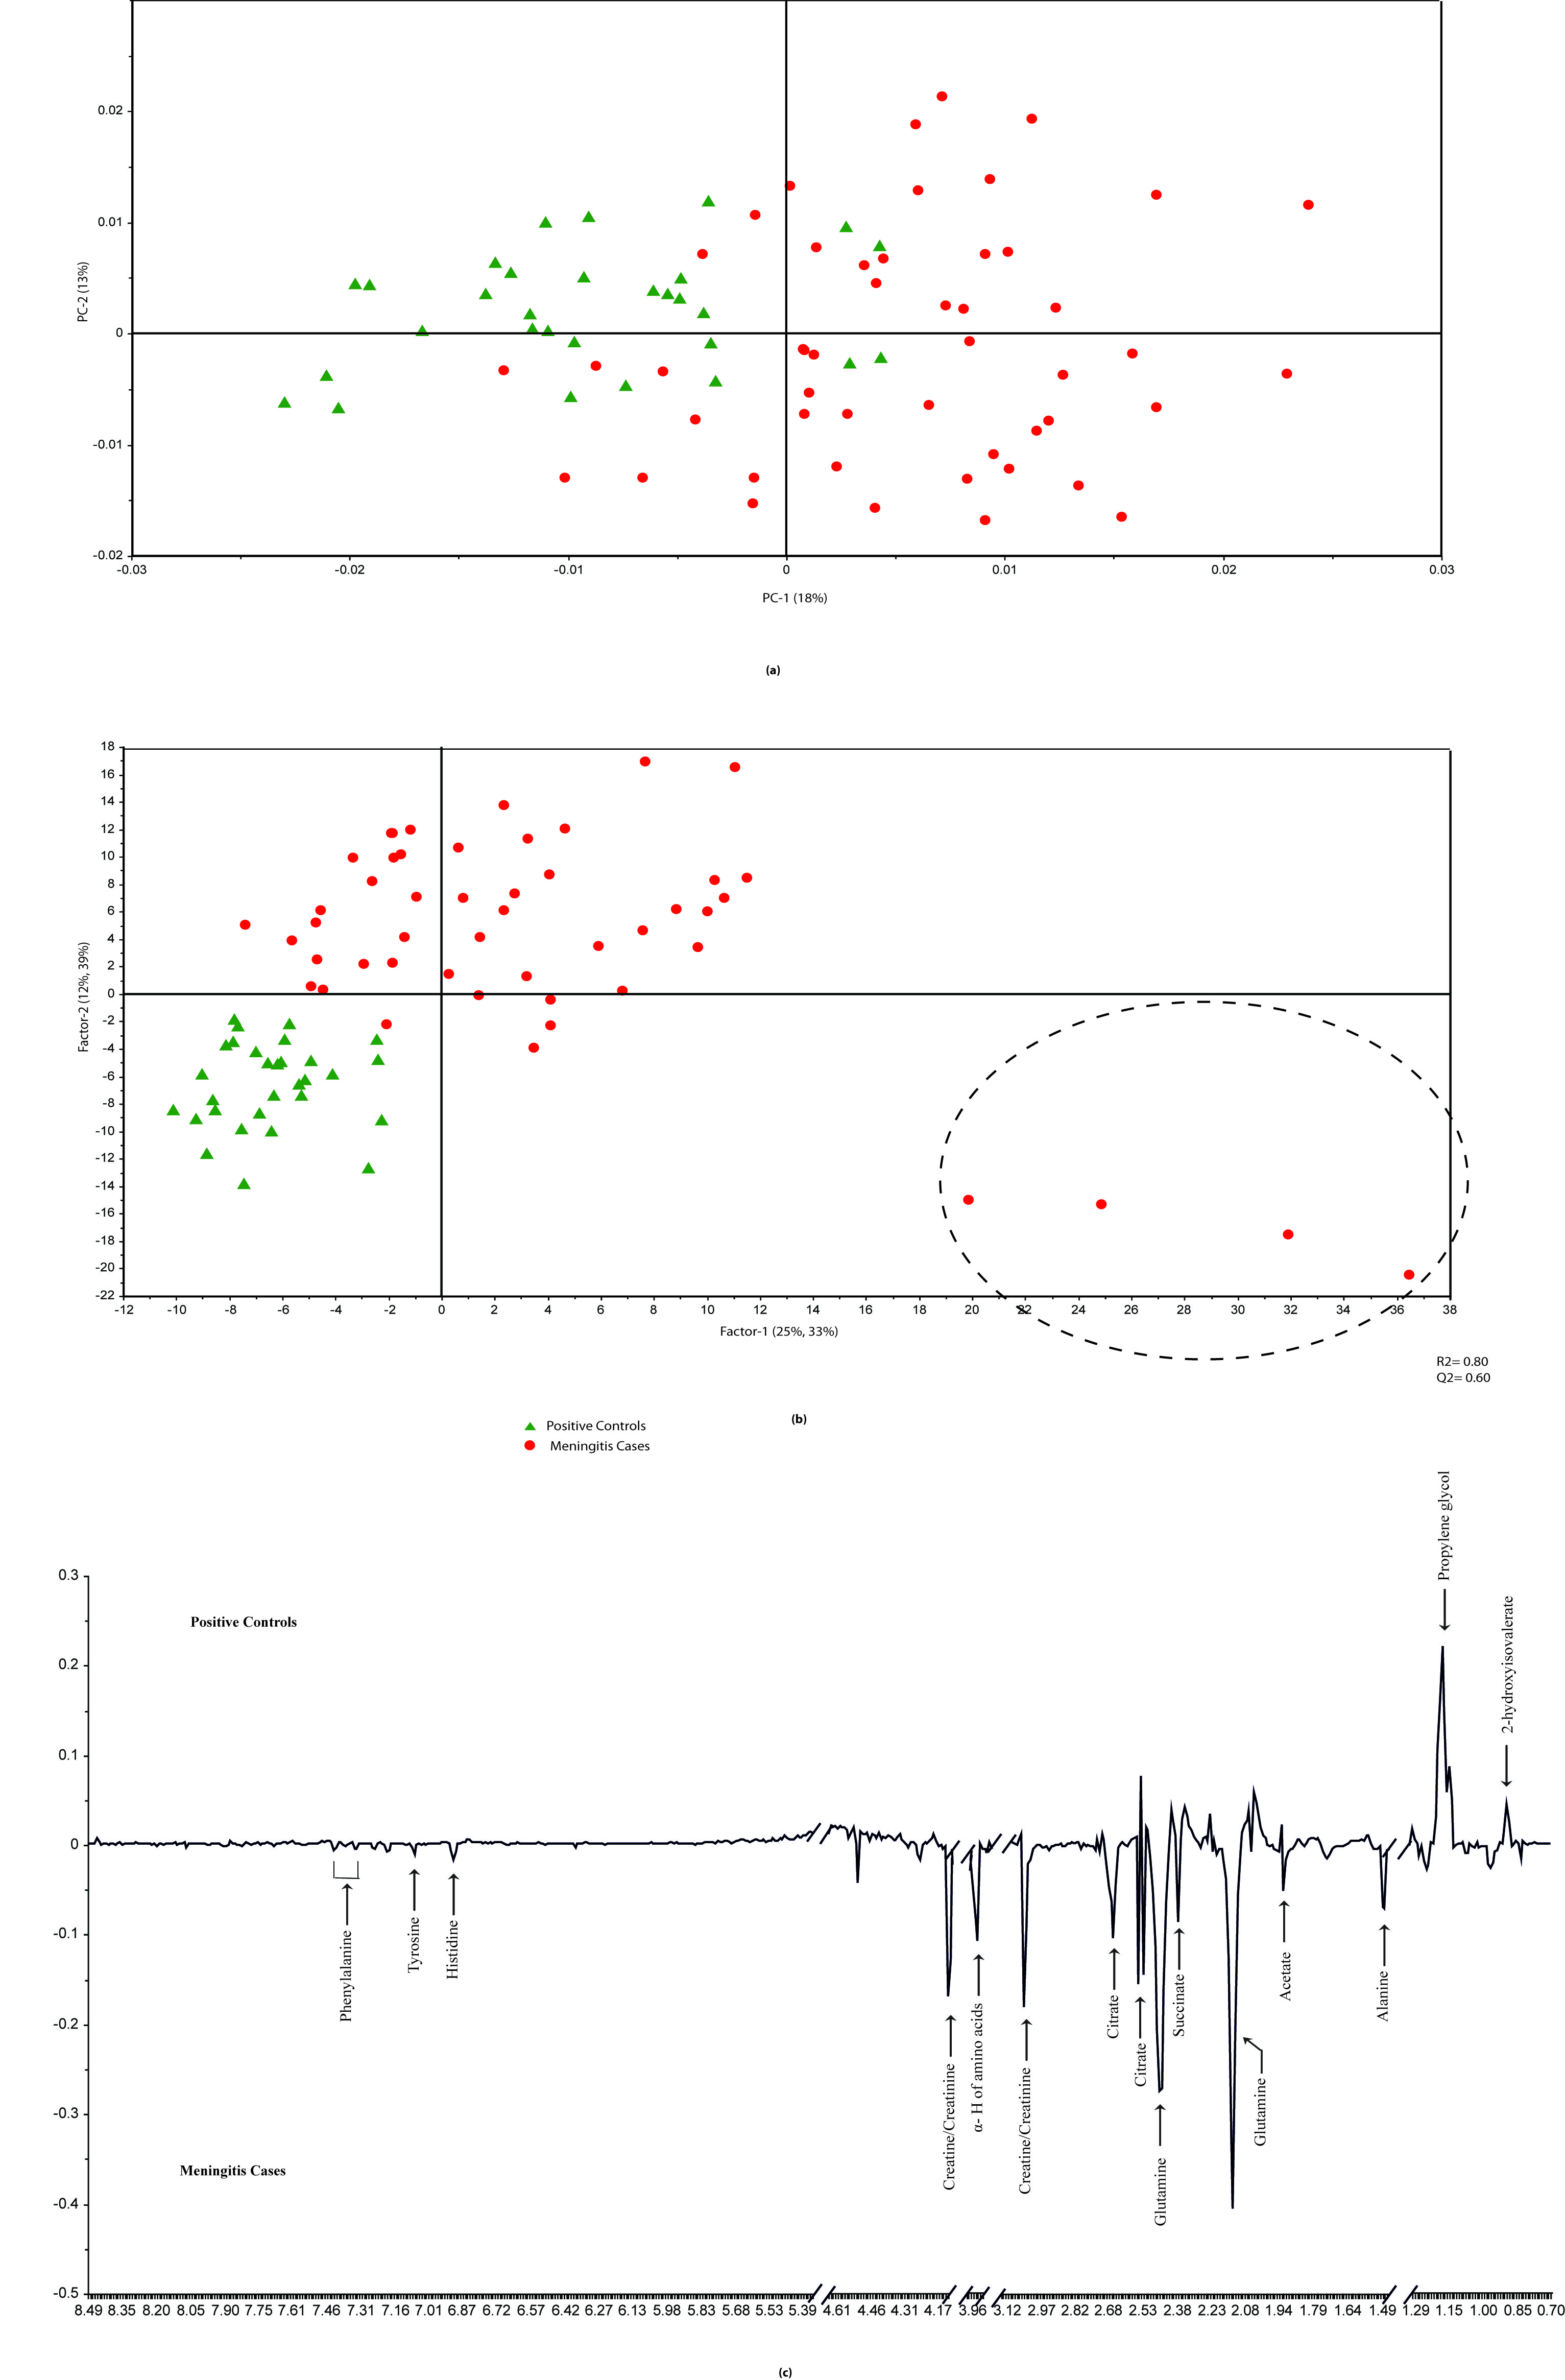
The statistical analysis of meningitis vs. negative controls using PLS-DA model resulted in R2 of 0.96 and Q2 of 0.80. The PC-1 X-loadings showed positive resonances of 2-hydroxyisovalerate, 2-hydroxy butyrate, valine, alanine, acetate, acetone, glutamine, citrate, choline containing compounds (choline and GPC),creatine, histidine, tyrosine and phenyl alanine, while propylene glycol and creatinine were found to be depleted in meningitis cases (Figure 3). Similarly, meningitis vs. positive controls resulted in R2 of 0.80 and Q2 of 0.62 and showed elevation in the levels of total free amino acids, glutamine, creatine/creatinine and citrate in the meningitis group. The meningitis group comprised four CM cases found to be HIV positive, identified by the PLS-DA model as well as by clinical investigation (Figure 4).DISCUSSION
The study reveals that meningitis cases could be well differentiated from negative controls on the basis of metabolic composition using NMR-based metabolic profiling, when an overall comparison of meningitis cases was performed with positive and negative controls together. However, there was no clear differentiation of meningitis cases from positive controls3.
A wide range of metabolic perturbations were found in the CSF samples while comparing meningitis cases with negative controls. Elevation of ketone bodies, creatine and glutamine in CSF is resulted for neuro-inflammation and neuro-degeneration. Glutamine levels have been found to increase significantly during meningitis resulting in increased blood brain barrier permeability and increase in severity of inflammation4,5. High creatinine clearance is also a signature observation during meningitis. The elevation in the levels of total free amino acids in CSF samples of meningitis cases may be due to increased activity of proteolytic enzymes and disruption of the blood brain barrier during patho-physiological changes occurring in meningitis6. The levels of acetate were found to be elevated in meningitis group when compared with those of positive controls as well as negative controls. Moreover, acetate has also been reported in the cases of pyogenic brain abcesses using in vivo MR spectroscopy6.
CONCLUSION
The metabolic profile could clearly differentiate meningitis cases from those of the negative control group.The biomarkers identified were ketone bodies, total free amino acids, acetate, glutamine, propylene glycol, citrate and creatine/creatinine. In addition, four HIV positive cases were also distinctly observed using the PLS-DA model. The study demonstrates robust multivariate data modelling along with identification of significant metabolites. The study also has its limitations, as the sample size was small, and therefore, further validation is required on a larger sample cohort.Acknowledgements
The authors are thankful to Dr. Ram Manohar Lohia Institute of Medical Sciences and Centre of Biomedical Research, Lucknow for providing facilities for conducting the present study. We would also extend our thanks to Dr. S. K. Mandal (Biostatistician at Centre of Biomedical Research, Lucknow) for his consultation while performing statistical analyses.References
1. Raper D, Louveau A, Kipnis J. How Do Meningeal Lymphatic Vessels Drain the CNS? Trends in neurosciences 2016; (Published online).
2. Aluise CD, Sowell RA, Butterfield DA. Peptides and proteins in plasma and cerebrospinal fluid as biomarkers for the prediction, diagnosis, and monitoring of therapeutic efficacy of Alzheimer's disease. BiochimicaetBiophysicaActa 2008; 1782:549-558.
3. Chatterji T, Singh S, Sen M, et al. Comprehensive 1H NMR metabolic pro?ling of body ?uids for differentiation of meningitis in adults. Metabolomics 2016; 12.
4. KarinchAM, Pan M, Lin CM, Strange R, Souba WW. Glutamine metabolism in sepsis and infection. The Journal of Nutrition 2001; 131:2550S-2551S.
5. Nayak BS, Bhat R. Cerebrospinal fluid lactate dehydrogenase and glutamine in Meningitis. Indian Journal of Physiology and Pharmacology 2005; 49:108-110.
6. Gupta RK, Vatsal DK, Husain N, et al. Differentiation of tuberculous from pyogenic brain abscesses with in vivo proton MR spectroscopy and magnetization transfer MR imaging. American Journal of neuroradiology 2001; 22:1503-1509.
Figures