3027
Towards Imaging the Glycolytic and Glutaminolytic Differences in Prostate Cancer Cell Lines that Affects Outcome of Glutaminase Inhibition1Cancer Systems Imaging, MD Anderson Cancer Center, Houston, TX, United States, 2Bioengineering, Rice University, Houston, TX, United States, 3Institute for Bioscience and Biotechnology Research, National Institute of Standards and Technology, Rockville, MD, United States, 4Applied Chemistry, Hanyang University, Korea, Republic of, 5University of Houston Downtown Campus, Houston, TX, 6Huntington Medical Research Institutes, Pasadena, CA, 7MD Anderson Cancer Center, Houston, TX, United States
Synopsis
To understand and image how metabolism changes in prostate cancer (PCa), we determined both extracellular and intracellular metabolic profile of four PCa cell lines with varying degrees of aggressiveness. Differences in metabolism and mechanistic link were further explored using carbon-13 glucose and glutamine feeding studies and hyperpolarized pyruvate metabolic imaging trials with subcutaneous xenograft PC3 and PC3M animal models. We found increased glutamine utilization in the more metastatic cell line PC3M and this increased dependence on glutamine leads to reduction in cell proliferation and ATP when cells are treated with glutaminase inhibitor CB-839. No reduction is seen in PC3 line.
Purpose
Despite the approval of multiple new therapies for PCa1; men with metastatic disease have treatable but incurable disease. Since the 1990’s, it has been known that the metabolic profile of PCa is quite different from normal prostate. Glutaminase (GLS) plays a critical role in the metabolism of glutamine and has been found to be upregulated in many cancers.2-4 Recently GLS was found to be expressed in 64% PCa specimens as opposed to 24% in benign prostate hyperplasia.5 We assess with in vivo metabolic imaging, in vitro metabolic profiling, carbon-13 tracing experiments and glutaminase inhibition with CB-8396 the metabolic differences of two castration resistant metastatic PCa cell lines.Methods
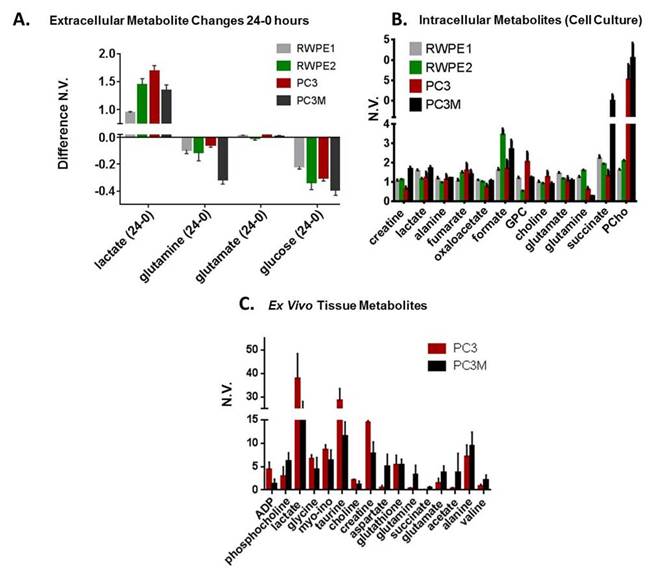
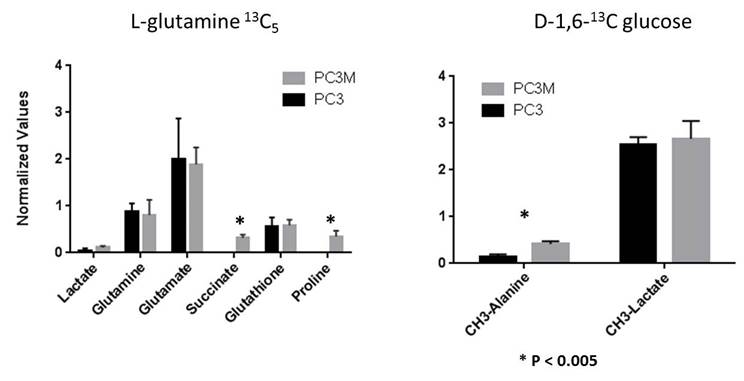
We measured the changes in concentration of extracellular metabolites (consumed and excreted) in 24 hours of growth of four human prostate cancer cell lines: RWPE-1, RWPE-2, PC3, and PC3M.7 To determine intracellular metabolite levels samples of between 0.5 – 3.0 x 10⁷ cells were trypsinized, pelleted and metabolites extracted using ice cooled methanol/water extraction. Samples were treated and analysis was performed similar to published procedures.8 To determine intracellular metabolites from subcutaneous tumors, flash frozen tissues were homogenized using liquid nitrogen cooled mortar and pestle and metabolites were extracted in a similar manner to cell pellets. All spectra were taken utilizing a Bruker Avance III HD 500 MHz spectrometer with a Prodigy BBO cryoprobe. 1D 1H-NMR spectra used 256 scans, a spectral width (SW) of 10245 Hz and referenced to DSS-d6 at 0.00 ppm. Water suppression was performed with presaturation. To easily discern the metabolic profile of the more aggressive PCa lines, values for all metabolites were normalized to the RWPE1 (indolent PCa) metabolic value. Carbon-13 feeding/tracing experiments were performed by adding either fully labeled 13C-glutamine (final concentration 3 mM) or 1,6-13C glucose (final concentration 10 mM) to glucose/glutamine free media. The corresponding unlabeled metabolite was added. Proton decoupled 1-D 13C spectroscopy was run (4096 averages, relaxation delay 6s, spectral width 29760 Hz, 30o flip angle) on each sample.
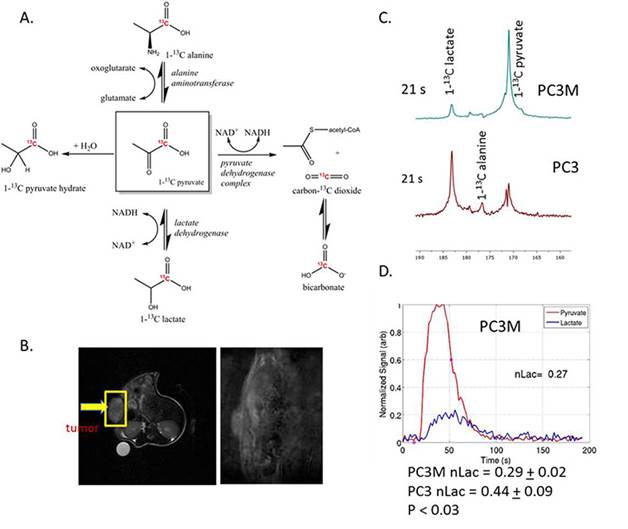
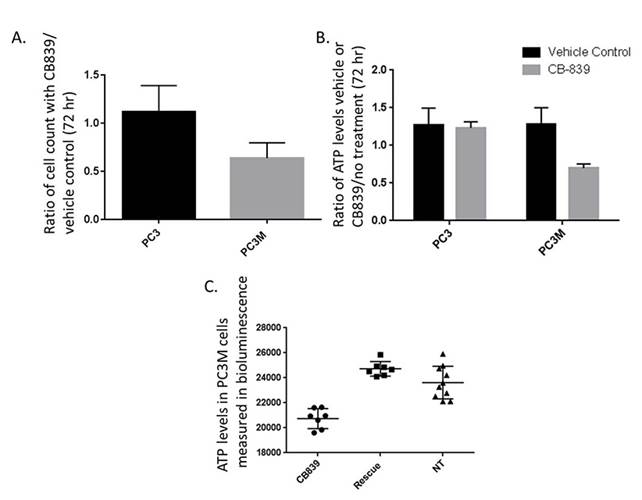
PC3 and PC3M cells were grown in culture in the presence of 0.1% DMSO (vehicle control) or 1 μM of CB-839 for 72 hours and with and without glutamine. Nude mice with either PC3 or PC3M subcutaneous tumors were injected via the tail vein with 200-250 μl of 80 mM of hyperpolarized 1-13C pyruvate. The single slice was placed over the tumor and a total of 90 transients (a 15o - 200 degree flip angle, gauss pulse and 2048 points) were acquired with a 2 s time delay between each transient. Dynamic spectra were manually phased and line-broadening was applied (10 to 15 Hz). The area under the spectral peaks for pyruvate and lactate were integrated over the whole array.
Results
We found glutamine uptake by PC3M is over 3 times as high as PC3 (P < 0.002) and lactate production is 1.3 times higher in PC3 versus PC3M cells (P < 0.004). The metabolic profile of tumor tissue samples which includes both the cells (intracellular) and interstitial space (extracellular) reveals the same differences found between PC3 and PC3M in vitro assays: increased lactate in PC3 tumors and increased succinate, glutamine and glutamate in PC3M. Significant differences in intracellular succinate and proline generated by labeled glutamine and intracellular alanine generated by labeled glucose was observed between cell lines.
With hyperpolarized pyruvate, we observed greater pyruvate to lactate conversion in PC3 tumors versus PC3M (PC3 0.44 + 0.09 (n=5) versus PC3M 0.29 + 0.02 (n=3) P < 0.03). This corresponds with the increased extracellular lactate production in 24 hours with PC3 cells in culture. We find increased vulnerability to glutaminase inhibition in PC3M versus the PC3 cell line. Reduced ATP levels were observed in the PC3M cell line incubated with CB-839. The reduction in ATP levels could be rescued by adding 4 mM dimethyl 2-oxoglutarate to the media. Dimethyl 2-oxoglutarate is hydrophobic analog of α-ketoglutarate and has been shown to be metabolized in the citric acid cycle
Discussion
Our results illustrate the variation in metabolic reprogramming that can occur between similar cell lines. The PC3M line is more metastatic and aggressive than the initial PC3 parental line.9 The new goal in oncology is precision medicine. By understanding further the variation between prostate cancer subtypes, we hope to use hyperpolarized metabolic imaging as a method for a non-invasive biopsy and as a clinical tool to guide in treatment decisions such as the utilization of specific metabolic or kinase inhibitors.Acknowledgements
The research has been funded in part by DOD CDMRP PC110065 (NMZ), MDACC Institutional Research Grants (NMZ, PB), MDACC Institutional Startup (PB), 5 P50 CA 094056-14 (PB), U54 CA151668 (PB), R21CA185536(PB), Gulf Coast Consortium (JH, PB). YL would like to thank the MD Anderson Cancer Center Odyssey Postdoctoral Fellowship. We would like to thank the CCSG-funded characterized cell line core facility at M.D. Anderson, small animal imaging facility and NMR facility (CA016672). We want to thank Calithera Biosciences for providing us with drug and specifically Dr. Susan Demo, Director of Translation Research at Calither Biosciences, for all the discussions on the data.References
1. Cookson, M. S., et al. (2013) Castration-resistant prostate cancer: AUA Guideline. J Urol 190(2): 429-438.
2. DeBerardinis, R. J., et al. (2007) Beyond aerobic glycolysis: transformed cells can engage in glutamine metabolism that exceeds the requirement for protein and nucleotide synthesis. Proc Natl Acad Sci U S A 104(49): 19345-19350.
3. Cheong, H., et al. (2012) Therapeutic targets in cancer cell metabolism and autophagy. Nature Biotechnology 30(7): 671-678.
4. Wise, D. R., et al. (2010) Glutamine addiction: a new therapeutic target in cancer. Trends Biochem Sci 35(8): 427-433.
5. Pan, T., et al. (2015) Elevated expression of glutaminase confers glucose utilization via glutaminolysis in prostate cancer. Biochem Biophys Res Commun 456(1): 452-458.
6. Gross, M. I., et al. (2014) Antitumor activity of the glutaminase inhibitor CB-839 in triple-negative breast cancer. Mol Cancer Ther 13(4): 890-901.
7. Russell, P. J., et al. (2003) Human prostate cancer cell lines. Methods Mol Med 81: 21-39.
8. Zand, B., et al. (2016) Role of Increased n-acetylaspartate Levels in Cancer. J Natl Cancer Inst 108(6).
9. Kozlowski, J. M., et al. (1984) Metastatic
behavior of human tumor cell lines grown in the nude mouse. Cancer Res 44(8):
3522-3529.
Figures