3026
Brain redox imaging using blood-brain-barrier nitroxides by digital EPR imaging system1Sapporo Medical University, Sapporo, Japan, 2Osaka University, Osaka, Japan
Synopsis
Electron paramagnetic resonance (EPR) imaging is a noninvasive imaging method for visualizing the brain redox status using nitroxide compounds as imaging probes. A digital imaging system for three-dimensional continuous-wave EPR imaging of small animals was developed using a high-speed analog-to-digital converter, digital-to-analog converters and field programmable gate array integrated circuits to improve the signal-to-noise ratio (SNR) and visualize the precise brain redox status in mice. Compared to an analog EPR imager, the digital EPR imager obtains a higher SNR of a phantom and produces images with sufficient quality to create a more accurate brain redox map of the mouse head.
INTRODUCTION
Electron paramagnetic resonance (EPR) imaging is a noninvasive imaging method for visualizing brain redox status using nitroxide compounds as imaging probes. Nitroxides have unique antioxidant properties, and function as redox-sensitive probes because of redox change from paramagnetic nitroxides to diamagnetic hydroxylamine that occur in the presence of reactants in the cellular environment. Nitroxides, such as Tempol or Tempone, can be used as imaging probes in three-dimensional (3D) EPR imaging studies (1,2), but only a few of them have been imaged in live mice because of their short life-times in vivo. Their short life-times result in EPR images with low temporal and spatial resolution. To overcome these problems and visualize the precise brain redox status in mice, a digital imaging system for 3D continuous-wave (CW) EPR imaging of small animals was developed using a high-speed analog-to-digital converter (ADC) and field programmable gate array (FPGA) integrated circuits (ICs). Compared to an analog EPR imager, the digital EPR imager is less expensive, has a higher signal-to-noise ratio (SNR) and captures higher quality images that can be used to generate more accurate redox maps of a mouse brain.MATERIALS AND METHODS
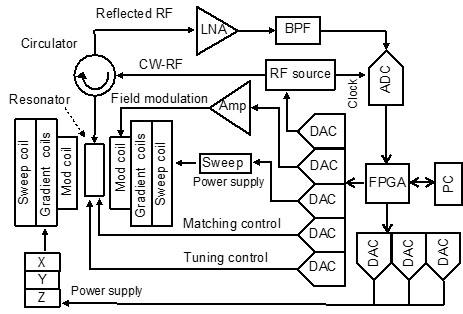
EPR imaging system: A magnetic circuit (X-5253, Hitachi Metals Neomaterial, Ltd., Osaka, Japan) and a multi-coil parallel-gap resonator for a 750-MHz CW-EPR imager were used with a developed CW-EPR digital console. This console mainly consisted of a 500-Msps ADC (AD9434), eight 2-Msps digital-to-analog converters (DAC8811) and inexpensive FPGAs (Cyclone V). The reflected radio frequency (RF) signal, which contained the EPR signal, was directly sampled from the resonator using a band-pass subsampling method. The reflected RF signal was used to produce control signals that were fed to the resonator for automatic tuning and matching. To extract the EPR signal from the reflected RF signal, a field modulation method was applied, since the impedance mismatch due to slow EPR absorption was cancelled. Data acquisition through a USB port was controlled using a LabVIEW-based program on a computer running Mac OS 10.9.5. A filtered back-projection method was used to reconstruct images from the EPR spectra. Paramagnetic nitroxide imaging probe: 3-methoxycarbonyl-PROXYL (MCP) was obtained from NARD Chemicals, Ltd. (Osaka, Japan). Animals: Male C57BL/6 mice aged 5–7 weeks with body weights of 20–25 g were used. Nitroxide probes in saline were injected by tail vein cannulation into the mice under isoflurane anesthesia.RESULTS AND DISCUSSION
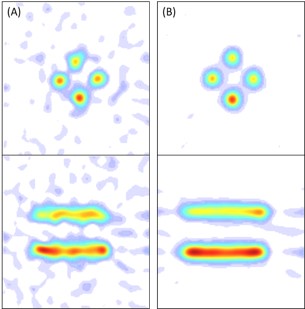
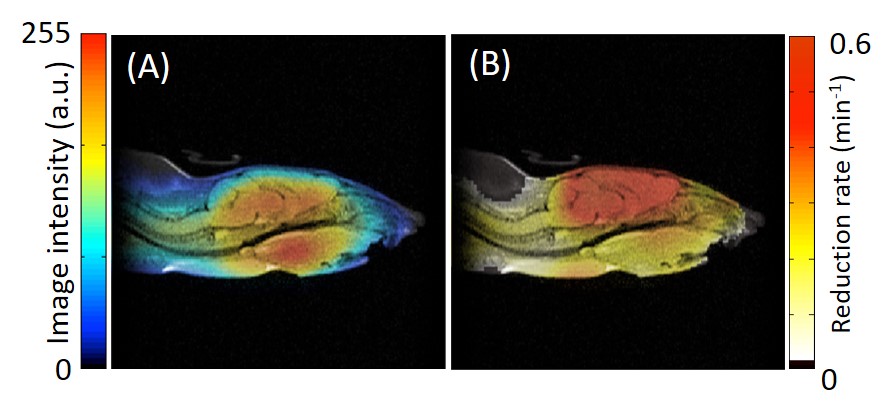
The developed digital CW-EPR imaging system (FPGA system) is depicted in Fig. 1. The EPR spectrum of a nitroxide phantom sample was acquired using both the FPGA system and an analog EPR system. The SNR of the FPGA system was 1.8 times larger than that of the analog system. To evaluate the effect of the improved SNR on EPR imaging, EPR images of the same phantom used for SNR evaluation were taken using both EPR imagers. Figures 2 A and B show the EPR images of the phantom obtained using the analog and FPGA system, respectively. The intensity of each EPR image was normalized by the maximum intensity in the respective image. The quality of the image in Fig. 2 B obtained using the FPGA system is better than that in Fig. 2 A obtained using the analog system. The image in Fig. 2 A contains more background noise than the image in Fig. 2 B. Figure 3 shows the EPR images of a mouse head in the sagittal plane injected with MCP using the FPGA system. The co-registration of the EPR image and the anatomical image obtained by MRI indicates that MCP is present inside the brain (Fig. 3 A). The reduction rate map of MCP in the mouse head was also co-registered to the MRI (Fig. 3 B). The reduction rate of MCP in the mouse brain was found to be higher than that in other areas of the mouse head. These results suggest that the developed FPGA system obtains EPR images of mouse heads, which will allow researchers to obtain more accurate redox maps of the mouse brain.Acknowledgements
This work was supported by a grant from the Japan Society for the Promotion of Science (16K10291).References
1. Sato-Akaba H, Fujii H, et al. Development and testing of a CW-EPR apparatus for imaging of short-lifetime nitroxyl radicals in mouse head. J Magn Reson. 2008;193(2):191-198
2. Emoto MC, Sato-Akaba H, Hirata H, Fujii HG. Dynamic changes in the distribution and time course of blood-brain barrier-permeative nitroxides in the mouse head with EPR imaging: visualization of blood flow in a mouse model of ischemia. Free Radic Biol Med. 2014;74:222-228
Figures