3025
Quantifying pO2-Driven Longitudinal Relaxation of Water 1H Spins in the Presence of Magnetization Transfer: Cross-Linked BSA as a Tissue Mimic1Physics, Washington University, Saint Louis, MO, United States, 2Chemistry, Washington University, Saint Louis, MO, United States, 3Radiology, Washington University, Saint Louis, MO, United States, 4Siteman Cancer Center, Washington University, St Louis, MO, United States
Synopsis
Crosslinked bovine serum albumin phantoms are used as tissue biexponential relaxation surrogates/mimics to investigate the potential of R1-based tissue-O2 quantification and to characterize the influence of physiologically relevant variations of temperature and protein concentration on such determinations. The relaxation-rate constant for the rapidly relaxing apparent water population is dominated by magnetization transfer and is insensitive pO2. The relaxation-rate constant for the slowly relaxing apparent water population is linearly related to pO2 and provides the basis for a possible MR-Oximetry protocol.
Introduction
Low oxygen levels in the body are a hallmark of many diseases and disorders, including cancer, cardiovascular disease, diabetes, and placental dysfunction. Established methods for quantifying dissolved oxygen (pO2) in tissue are invasive.
In principle, because O2 is paramagnetic, the MR-measured water 1H longitudinal relaxation-rate constant (R1) is linearly related to [O2] via the equation $$R_{1}=R_{1,0}+r_{1}\times[O_2],$$ in which R1 is the measured longitudinal relaxation-rate constant, r1 is the “relaxivity” of oxygen, R1,0 is the rate constant in the absence of oxygen, and [O2] is the concentration of dissolved O2 in the tissue water. In practice, water 1H longitudinal relaxation in mammalian tissue is well modelled as a biexponential, rather than a monoexponential, function.1 To first approximation, this reflects two distinct apparent water populations in slow exchange. This biexponential function can be written as $$M_z(t)=A+[B\cdot F\cdot\exp(-tR_{1,fast})]+[B\cdot(1-F)\cdot\exp(-tR_{1,slow})].$$ Here, R1,fast is the longitudinal relaxation-rate constant for the rapidly relaxing water population with fraction F, and R1,slow is the longitudinal relaxation rate-constant for the slowly relaxing water population, with fraction 1-F. The rapidly relaxing water population represents water 1H spins that principally undergo relaxation via magnetization transfer (MT) with the macromolecular matrix (e.g., proteins, lipids, nucleic acids).1 We hypothesize that this population’s relaxation is negligibly affected by tissue-[O2]. The slowly relaxing water population represents water 1H spins that do not principally undergo MT-driven relaxation. This population’s relaxation is hypothesized to be maximally affected by tissue-[O2].
Water 1H spins in crosslinked bovine serum albumin (x-BSA) have been shown to exhibit MT-driven biexponential longitudinal relaxation similar to that observed in tissue.2 Herein, we test x-BSA samples as tissue surrogates/mimics to investigate the relationship between R1 and pO2, and to characterize the influence of physiologically-relevant variations in temperature and macromolecule (protein) concentration on R1-based pO2 measures.
Methods
x-BSA samples were created by crosslinking varying concentrations of BSA (5-30%, by weight) in phosphate-buffered saline (PBS) with glutaraldehyde. Sample pO2 was modulated by bubbling varying mixtures of O2 and N2 gas into the PBS solution prior to adding BSA and crosslinking. Data were collected using a 500-MHz Agilent/Varian high-resolution NMR spectrometer and a 200-MHz Agilent/Varian preclinical MRI scanner. A Modified Fast Inversion Recovery3 (MFIR) pulse sequence (invert, wait, collect) was used, with 64 exponentially spaced inversion times ranging from 5 ms to 7.5 s.Results
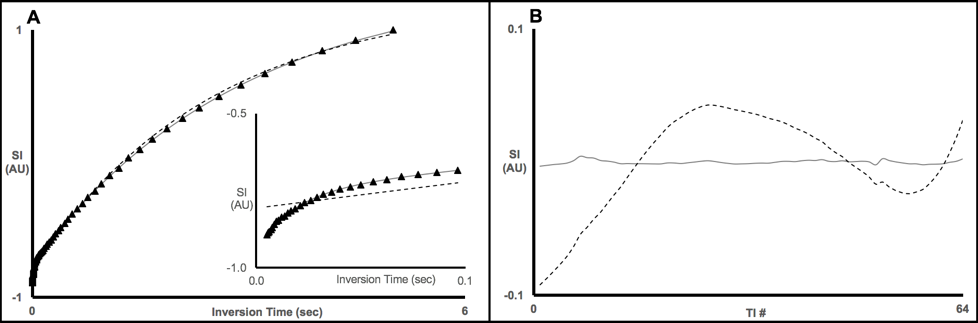
Initially, x-BSA samples were verified to recapitulate the biexponential longitudinal relaxation characteristics of in vivo tissue. As shown in Fig. 1, x-BSA longitudinal relaxation data were markedly better characterized using a biexponential model. The rapidly relaxing component has been shown previously to correspond, principally, to the water population engaged in MT to the cross-linked protein matrix.1,2
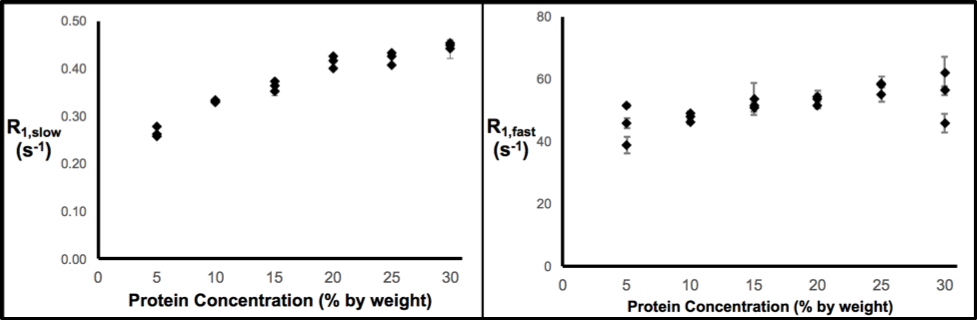
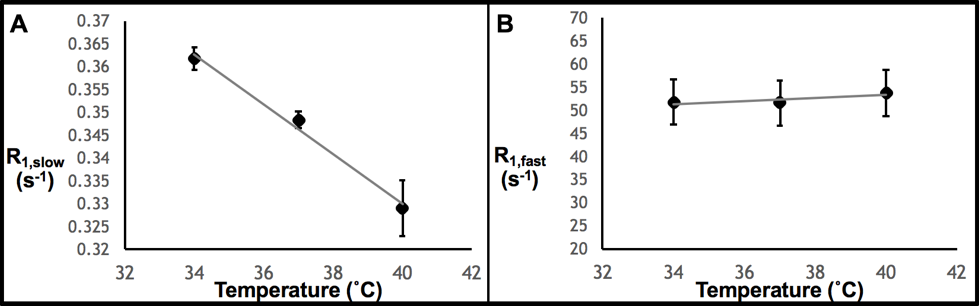
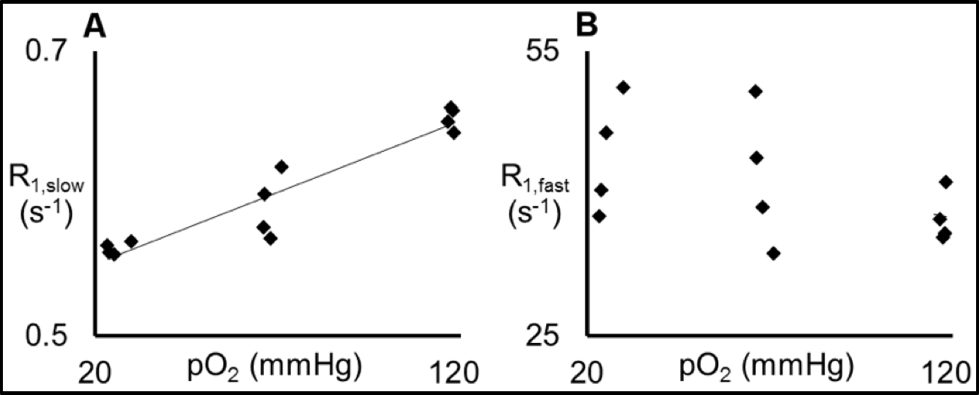
Thereafter, the effects of variations in protein concentration, temperature, and pO2 on the R1 measurement were quantified. Figure 2 demonstrates that R1,slow and R1,fast are roughly linearly related to protein concentration, plateauing for concentrations of ≥~20% (by weight), and that R1,fast ~100x R1,slow. As shown in Fig. 3, R1,slow is linearly dependent on temperature, whereas R1,fast is essentially independent of temperature. Figure 4 shows that R1,slow is linearly dependent on pO2, as postulated, while R1,fast is independent of pO2.
Discussion
Relaxation data for x-BSA tissue-mimic phantoms are well characterized by a biexponential model, reflecting two apparent water-relaxation populations in slow exchange, each having its own R1. R1,fast is dominated by MT and, thus, is independent of pO2. In contrast, R1,slow is linearly correlated to pO2, as hypothesized, thus holding promise as the basis for an R1,slow-based MR-Oximetry protocol. Because R1,slow is nearly constant for protein concentrations ≥~20%, and since cells have a protein concentration of 20-40%,4 modest tissue variations in protein content should minimally effect putative R1,slow-based tissue-pO2 measurement (e.g., r1 relaxivities across tissue types will be similar). The temperature dependence of R1,slow is a complication, but can be addressed by monitoring tissue temperature via the temperature-dependent water 1H chemical shift relative to a reference resonance, e.g., NAA in brain.5
Key takeaways are: (i) x-BSA phantoms are good relaxation surrogates for tissue, displaying two apparent water-relaxation populations characterized by longitudinal relaxation-rate constants R1,fast and R1,slow; (ii) R1,fast is dominated by MT and is insensitive to tissue pO2; (iii) R1,slow is linearly correlated to pO2, potentially enabling a MR-Oximetry protocol.
Acknowledgements
Research supported, in part, by NIH grants: P50 CA094056, R01 CA155365, P30 CA91842, R01 HD086323, and 5T32EB01485505.References
1. A.M. Prantner, G.L. Bretthorst, J.J. Neil, J.R. Garbow, J.J.H. Ackerman. Magnetization Transfer Induced Biexponential Longitudinal Relaxation. Magnetic Resonance in Medicine. 2008; 60: 555-563.
2. S.H. Koenig, R.D. Brown, III, R. Ugolini. Magnetization transfer in cross-linked bovine serum albumin solutions at 200 MHz: A model for tissue. Magnetic Resonance in Medicine. 1993; 29: 311–316.
3. R.K. Gupta, J.A. Ferretti, E.D. Becker, G.H. Weiss. A Modified Fast Inversion-recovery Technique for Spin-lattice Relaxation Measurements. Journal of Magnetic Resonance. 1980; 38: 447-452.
4. A.B. Fulton. How Crowded Is the Cytoplasm? Cell. 1982; 30: 345-347.
5. M. Zhu, A. Bashir, J.J. Ackerman, D.A. Yablonskiy. Improved Calibration Technique for In Vivo Proton MRS Thermometry for Brain Temperature Measurement. Magnetic Resonance in Medicine. 2008; 60: 536-541.
Figures