3019
Rapid Diffusion Tensor MR Spectroscopy (DTS) of Metabolites in Human Brain1University of Alberta, Edmonton, AB, Canada
Synopsis
Few studies have focused on metabolite diffusion using 1H-MRS, compared to the vast number observing water diffusion by DWI/DTI. These MRS studies are lengthy, therefore difficult to implement clinically, and use up to three b-values to yield the diffusion spectra. Single exponential signal loss is assumed for metabolites, neglecting the possibility of non-linear decay at high b-values, as has been observed for water. Our goals are: (i) Characterize the metabolite signal decay versus b-value in human white matter to determine the non-linear region. (ii) Develop a rapid diffusion tensor spectroscopy method that can be executed in a clinically useful time.
Purpose
While there is a vast body of work investigating the diffusion of water in human brain by MRI, fewer studies have focused on metabolite diffusion using 1H-MRS1-5. These studies typically require lengthy acquisition times (~20 min / b-value for full tensor1,2,4, and ~10 min for parallel and perpendicular only measurements3,5) and use up to three b-values (maximum b ~ 1600 – 5000 s/mm2) to yield the diffusion spectra. Single exponential signal loss is assumed, but the diffusion coefficients could be biased from non-linearity of signal decay at high b-values, which has been observed in excised nerve tissue6, rodent and human brain7,8. The purpose here is two-fold: (i) develop a diffusion tensor spectroscopy (DTS) method that can be executed in a clinically relevant time and (ii) characterize the metabolite signal decay as a function of b-value in human white matter.Methods
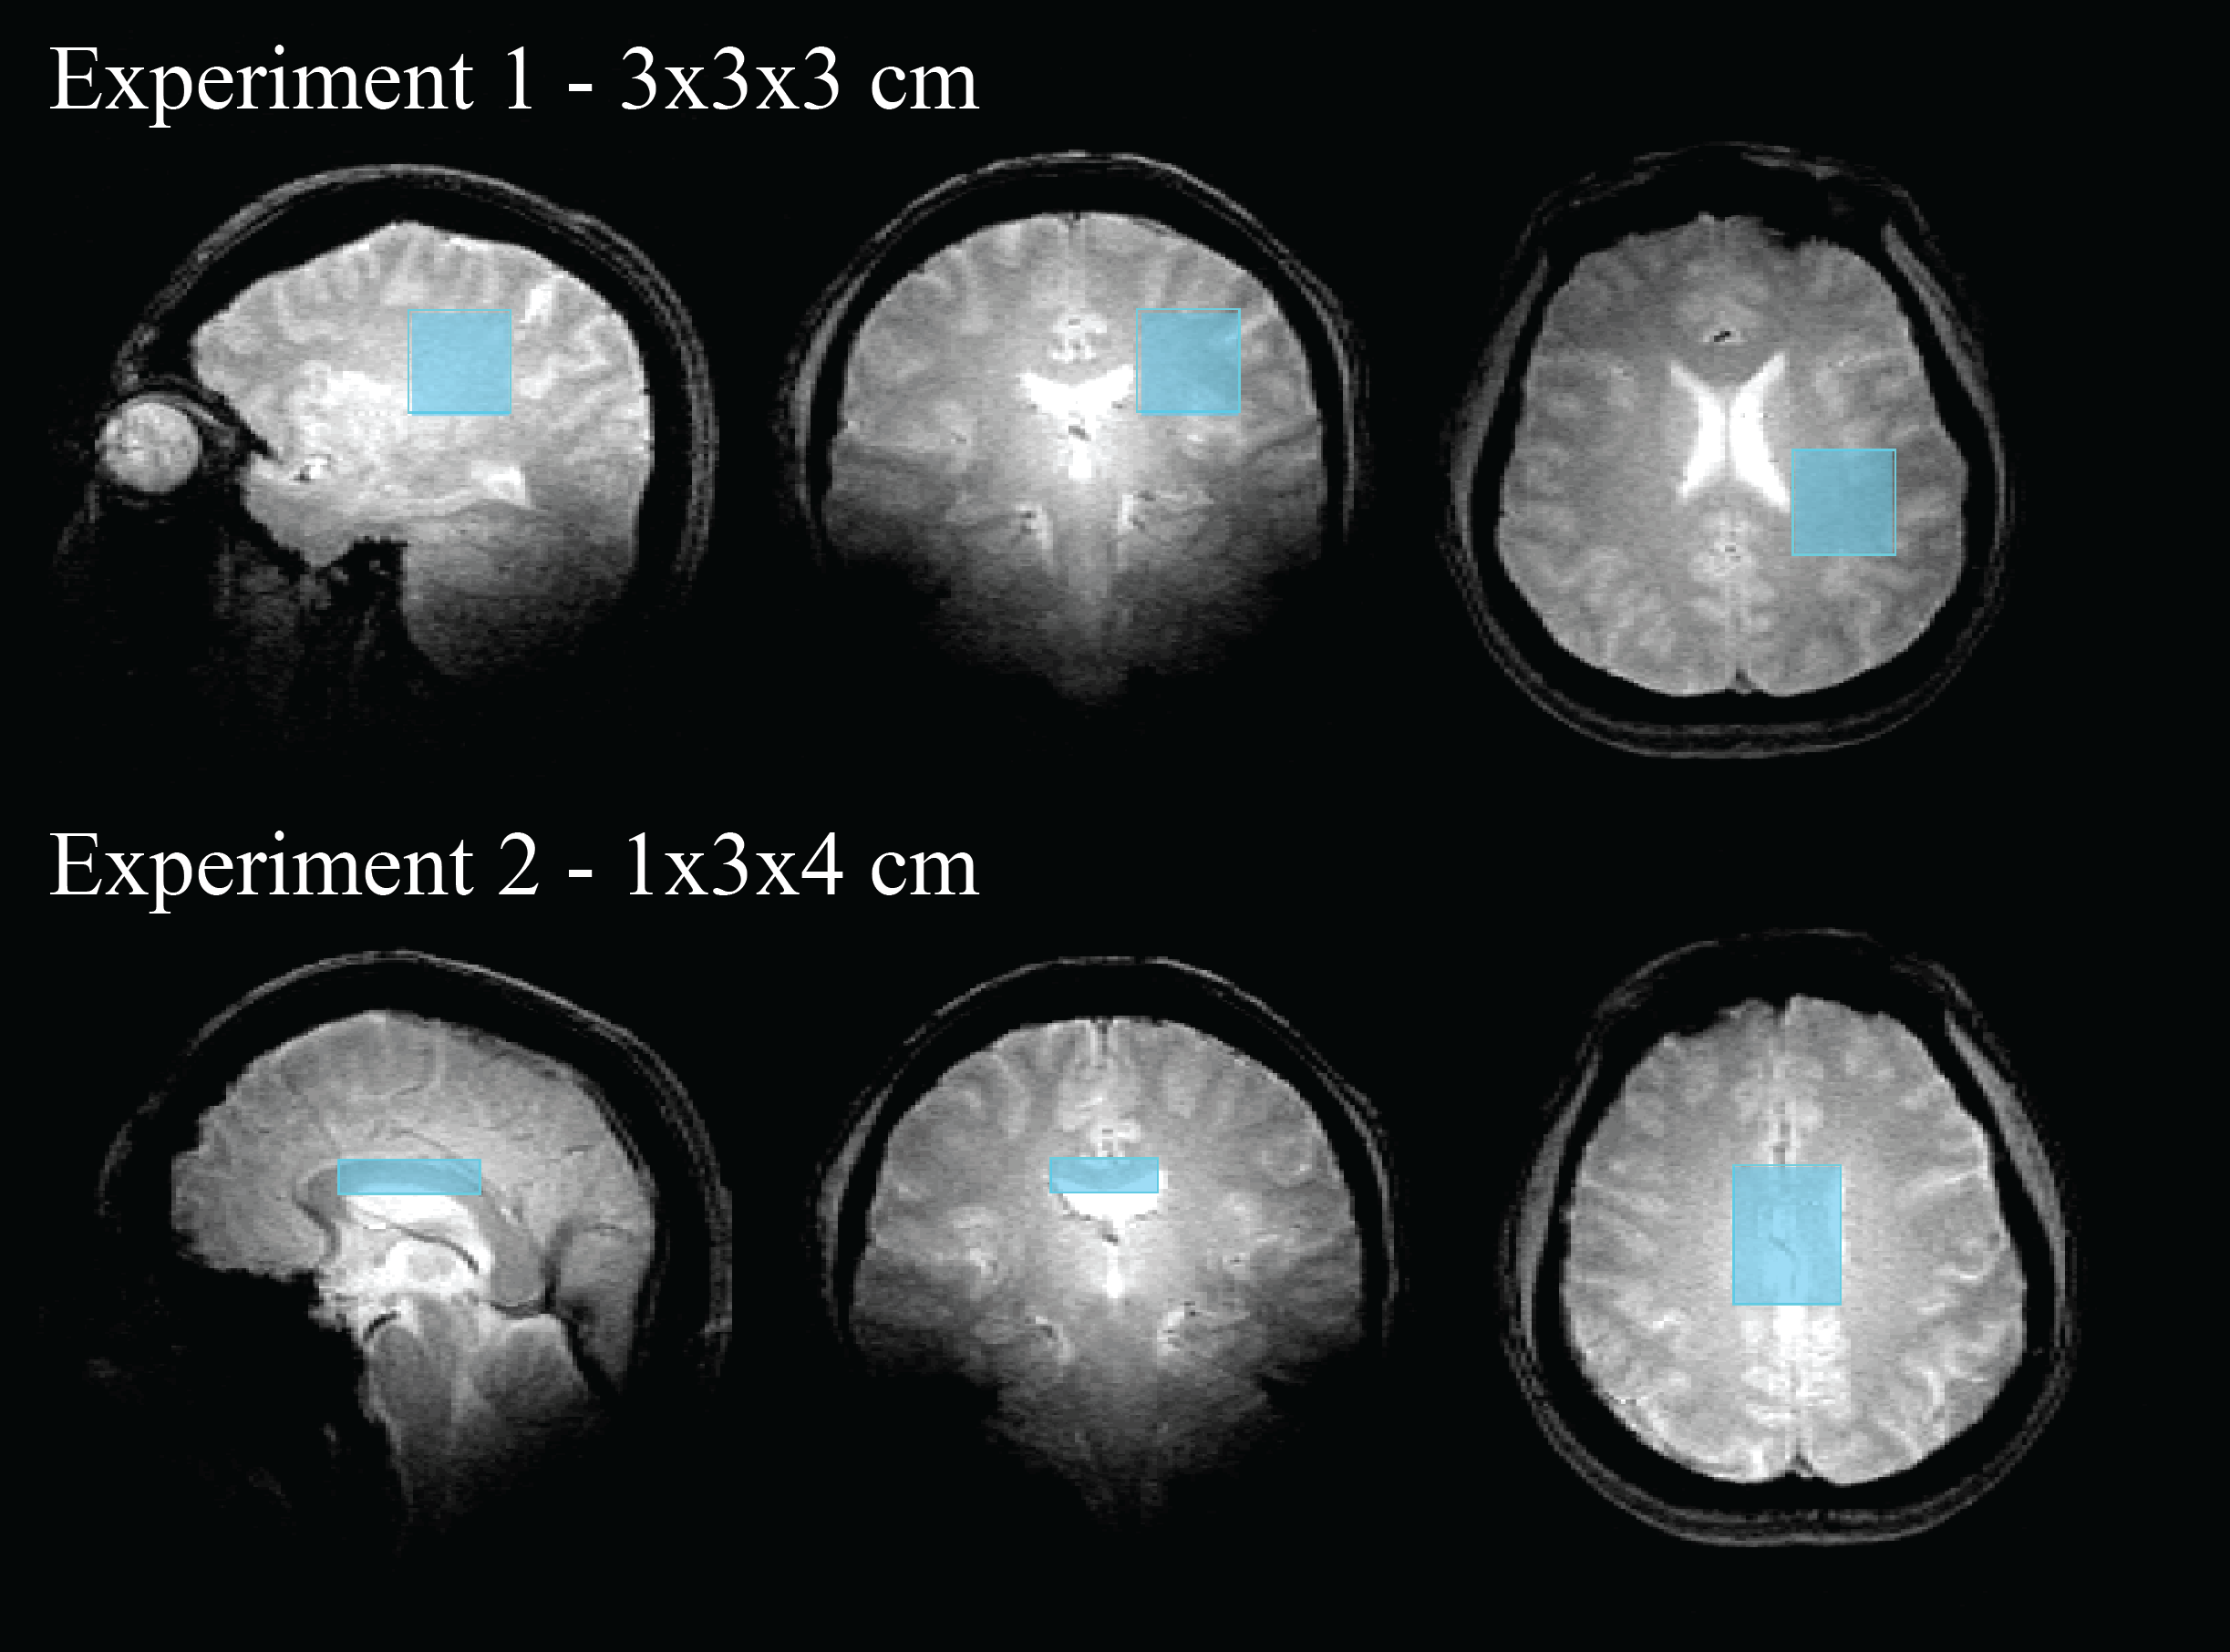
Spectra were acquired (4.7T Varian, maximum gradient 60 mT/m) in 5 healthy volunteers (26±5 years) from a 3x3x3 cm3 volume in the parieto-occipital white matter to characterize the signal decay as a function of b-value (Experiment 1), and a 1x3x4 cm3 volume centred on the corpus callosum body for evaluating a rapid DTS protocol (Experiment 2). A diffusion-weighted PRESS sequence9 with 8-step phase-cycle routine10 was used (20 seconds/spectrum) with each average saved separately. Sequence parameters for all studies were: Experiment 1: TR=2.5s, TE=180ms, δ=25ms, Δ=60ms, either Xdiff, or Ydiff or Zdiff stepped in 51 increments with b-value = 0 to 8590 s/mm2, AQ time = 17.5 min per gradient direction. Experiment 2: TR=2.5s, TE=90ms, δ=20ms, Δ=34ms, 8 averages, 6 direction tensor [Xdiff,Ydiff,Zdiff] = [-1,-1,0] [-1,0,-1] [0,-1,-1] [1,-1,0] [1,0,-1] [0,1,-1]), b-values = 500, 1000, 1650, 2100, 2700, 3400 s/mm2, AQ time total = 12 minutes. In 2 subjects an extra acquisition at b=0s/mm2 was performed (2 minutes extra time). Gradient calibration was performed on an n-octanol phantom (mean diffusivity (MD) = 0.142x10⁻³ mm2/sec at 23C). Phase alignment used a new method for data correlation to detect the optimal angle in the frequency domain, followed by bias correction using a second-order polynomial. These phase-aligned data were transformed to the time domain and a 2D FFT applied to yield the desired spectrum. Peak area estimates were determined either for the reference phantom n-octanol methylene peak or the singlet NAA, Cr and Cho peaks from the brain using LCModel11 analysis. Fractional anisotropy (FA), MD, and parallel and perpendicular diffusivities were determined for each metabolite.Results
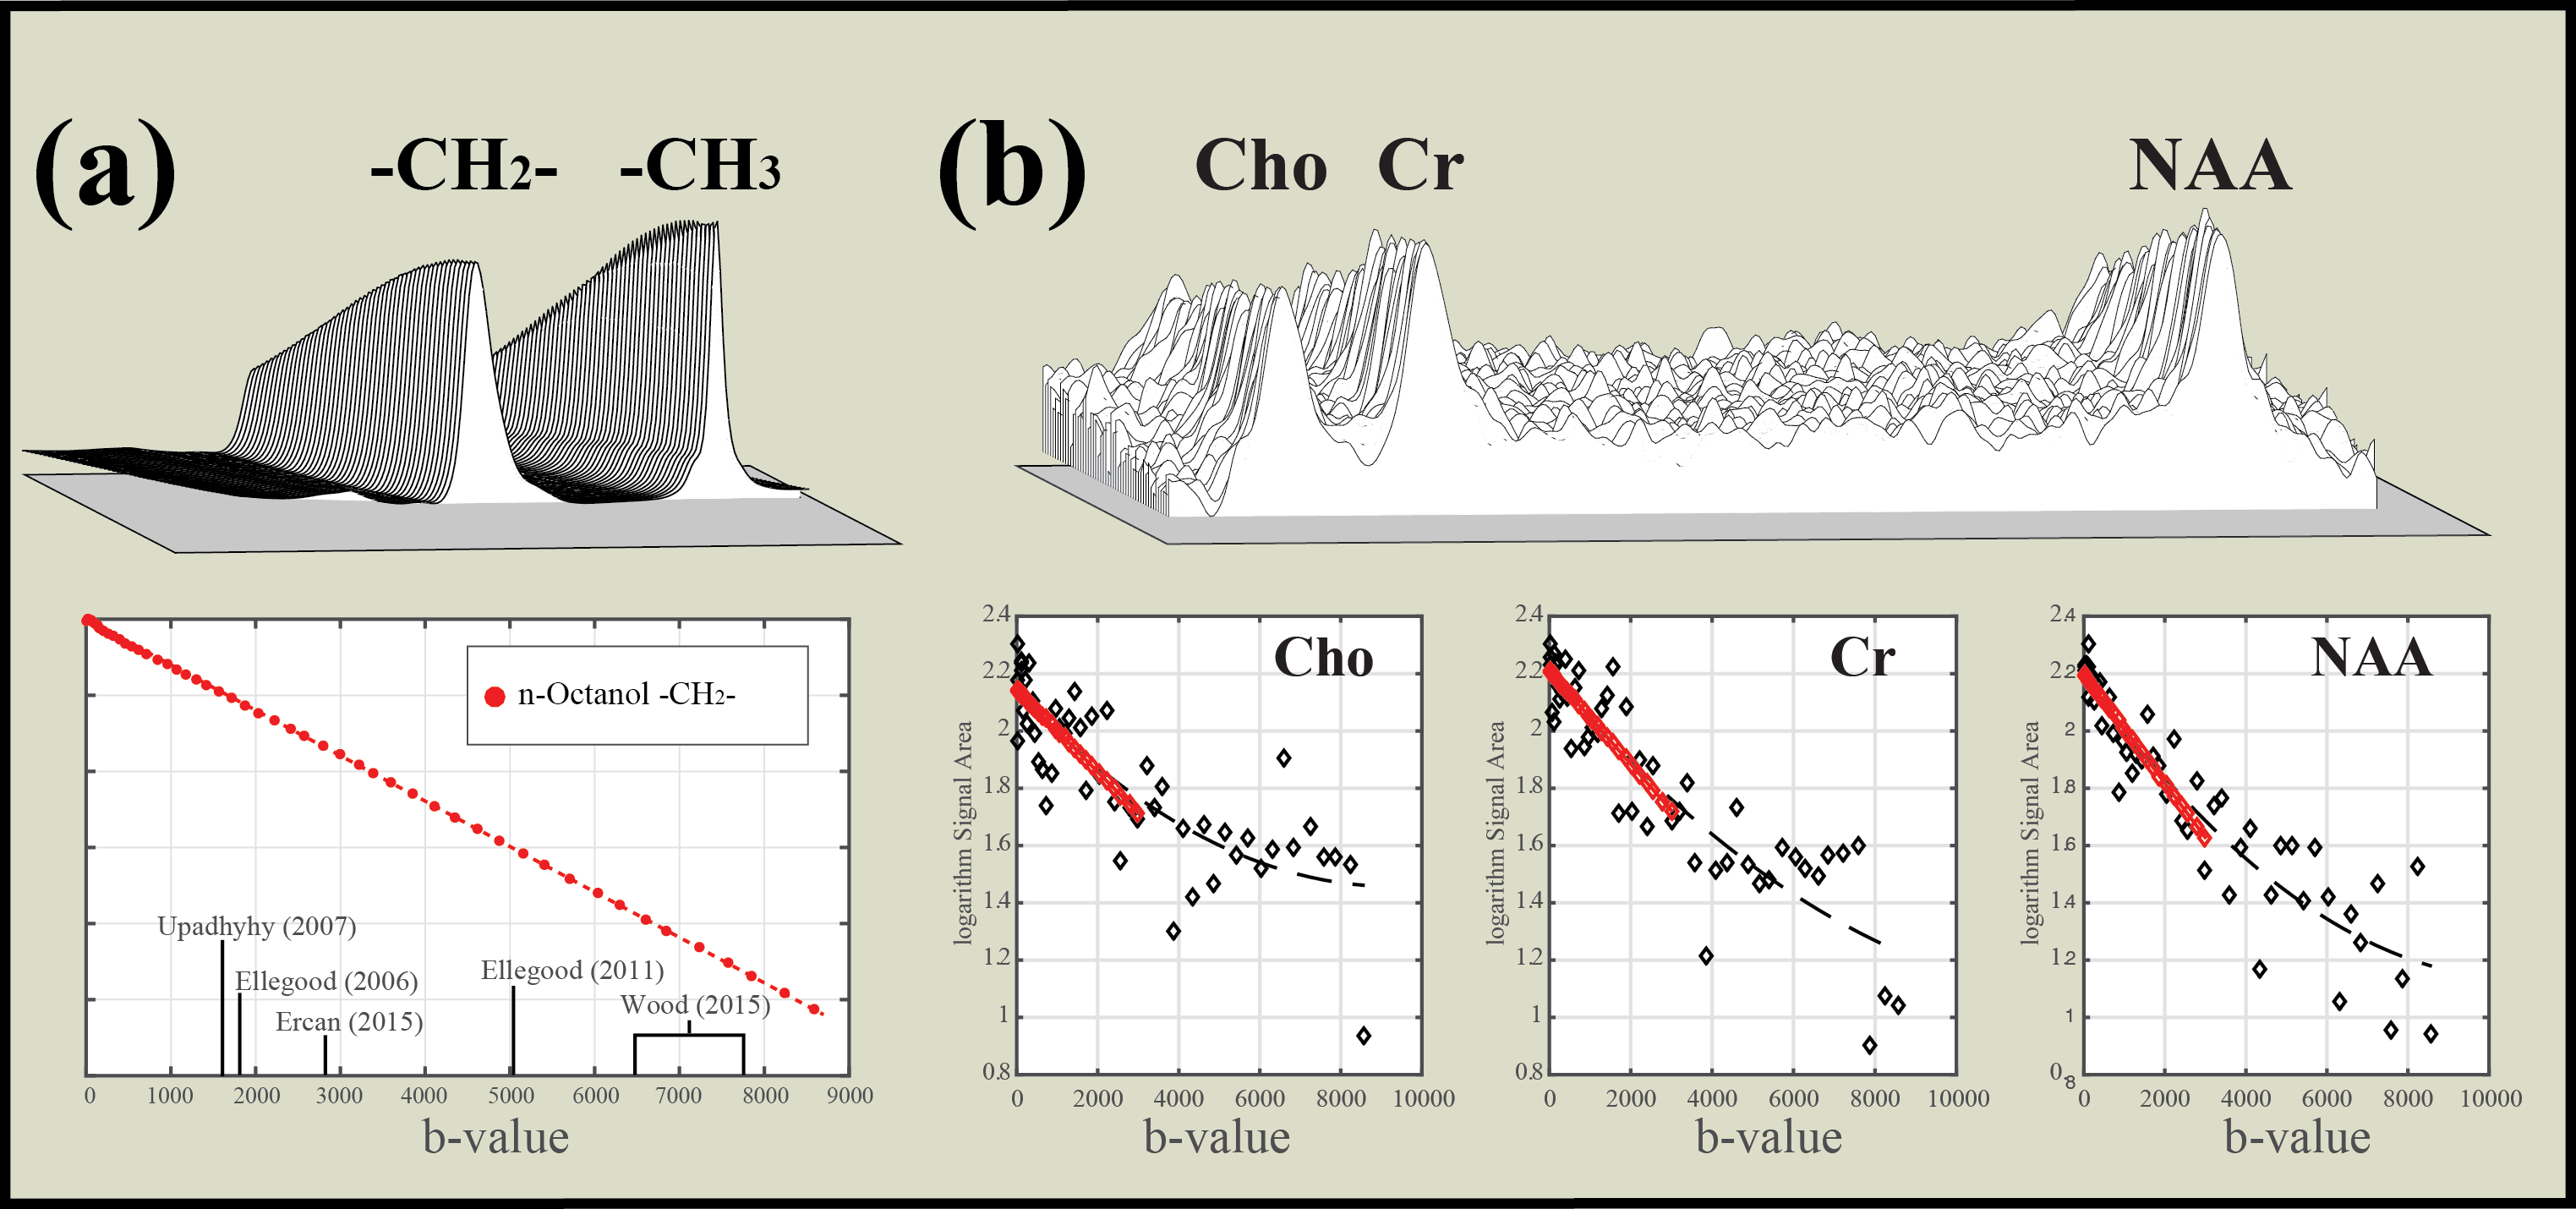
In Experiment 1, adequate SNR (>10 for the NAA peak from LCModel analysis results) was achieved from the sum of 8 averages (Figure 1), for both the n-octanol phantom and the parieto-occipital white matter of a healthy control subject. The plot of log signal for the target peaks versus the b-value illustrates a linear fit across full range for n-octanol and only up to b-value ~3000 s/mm2 for brain
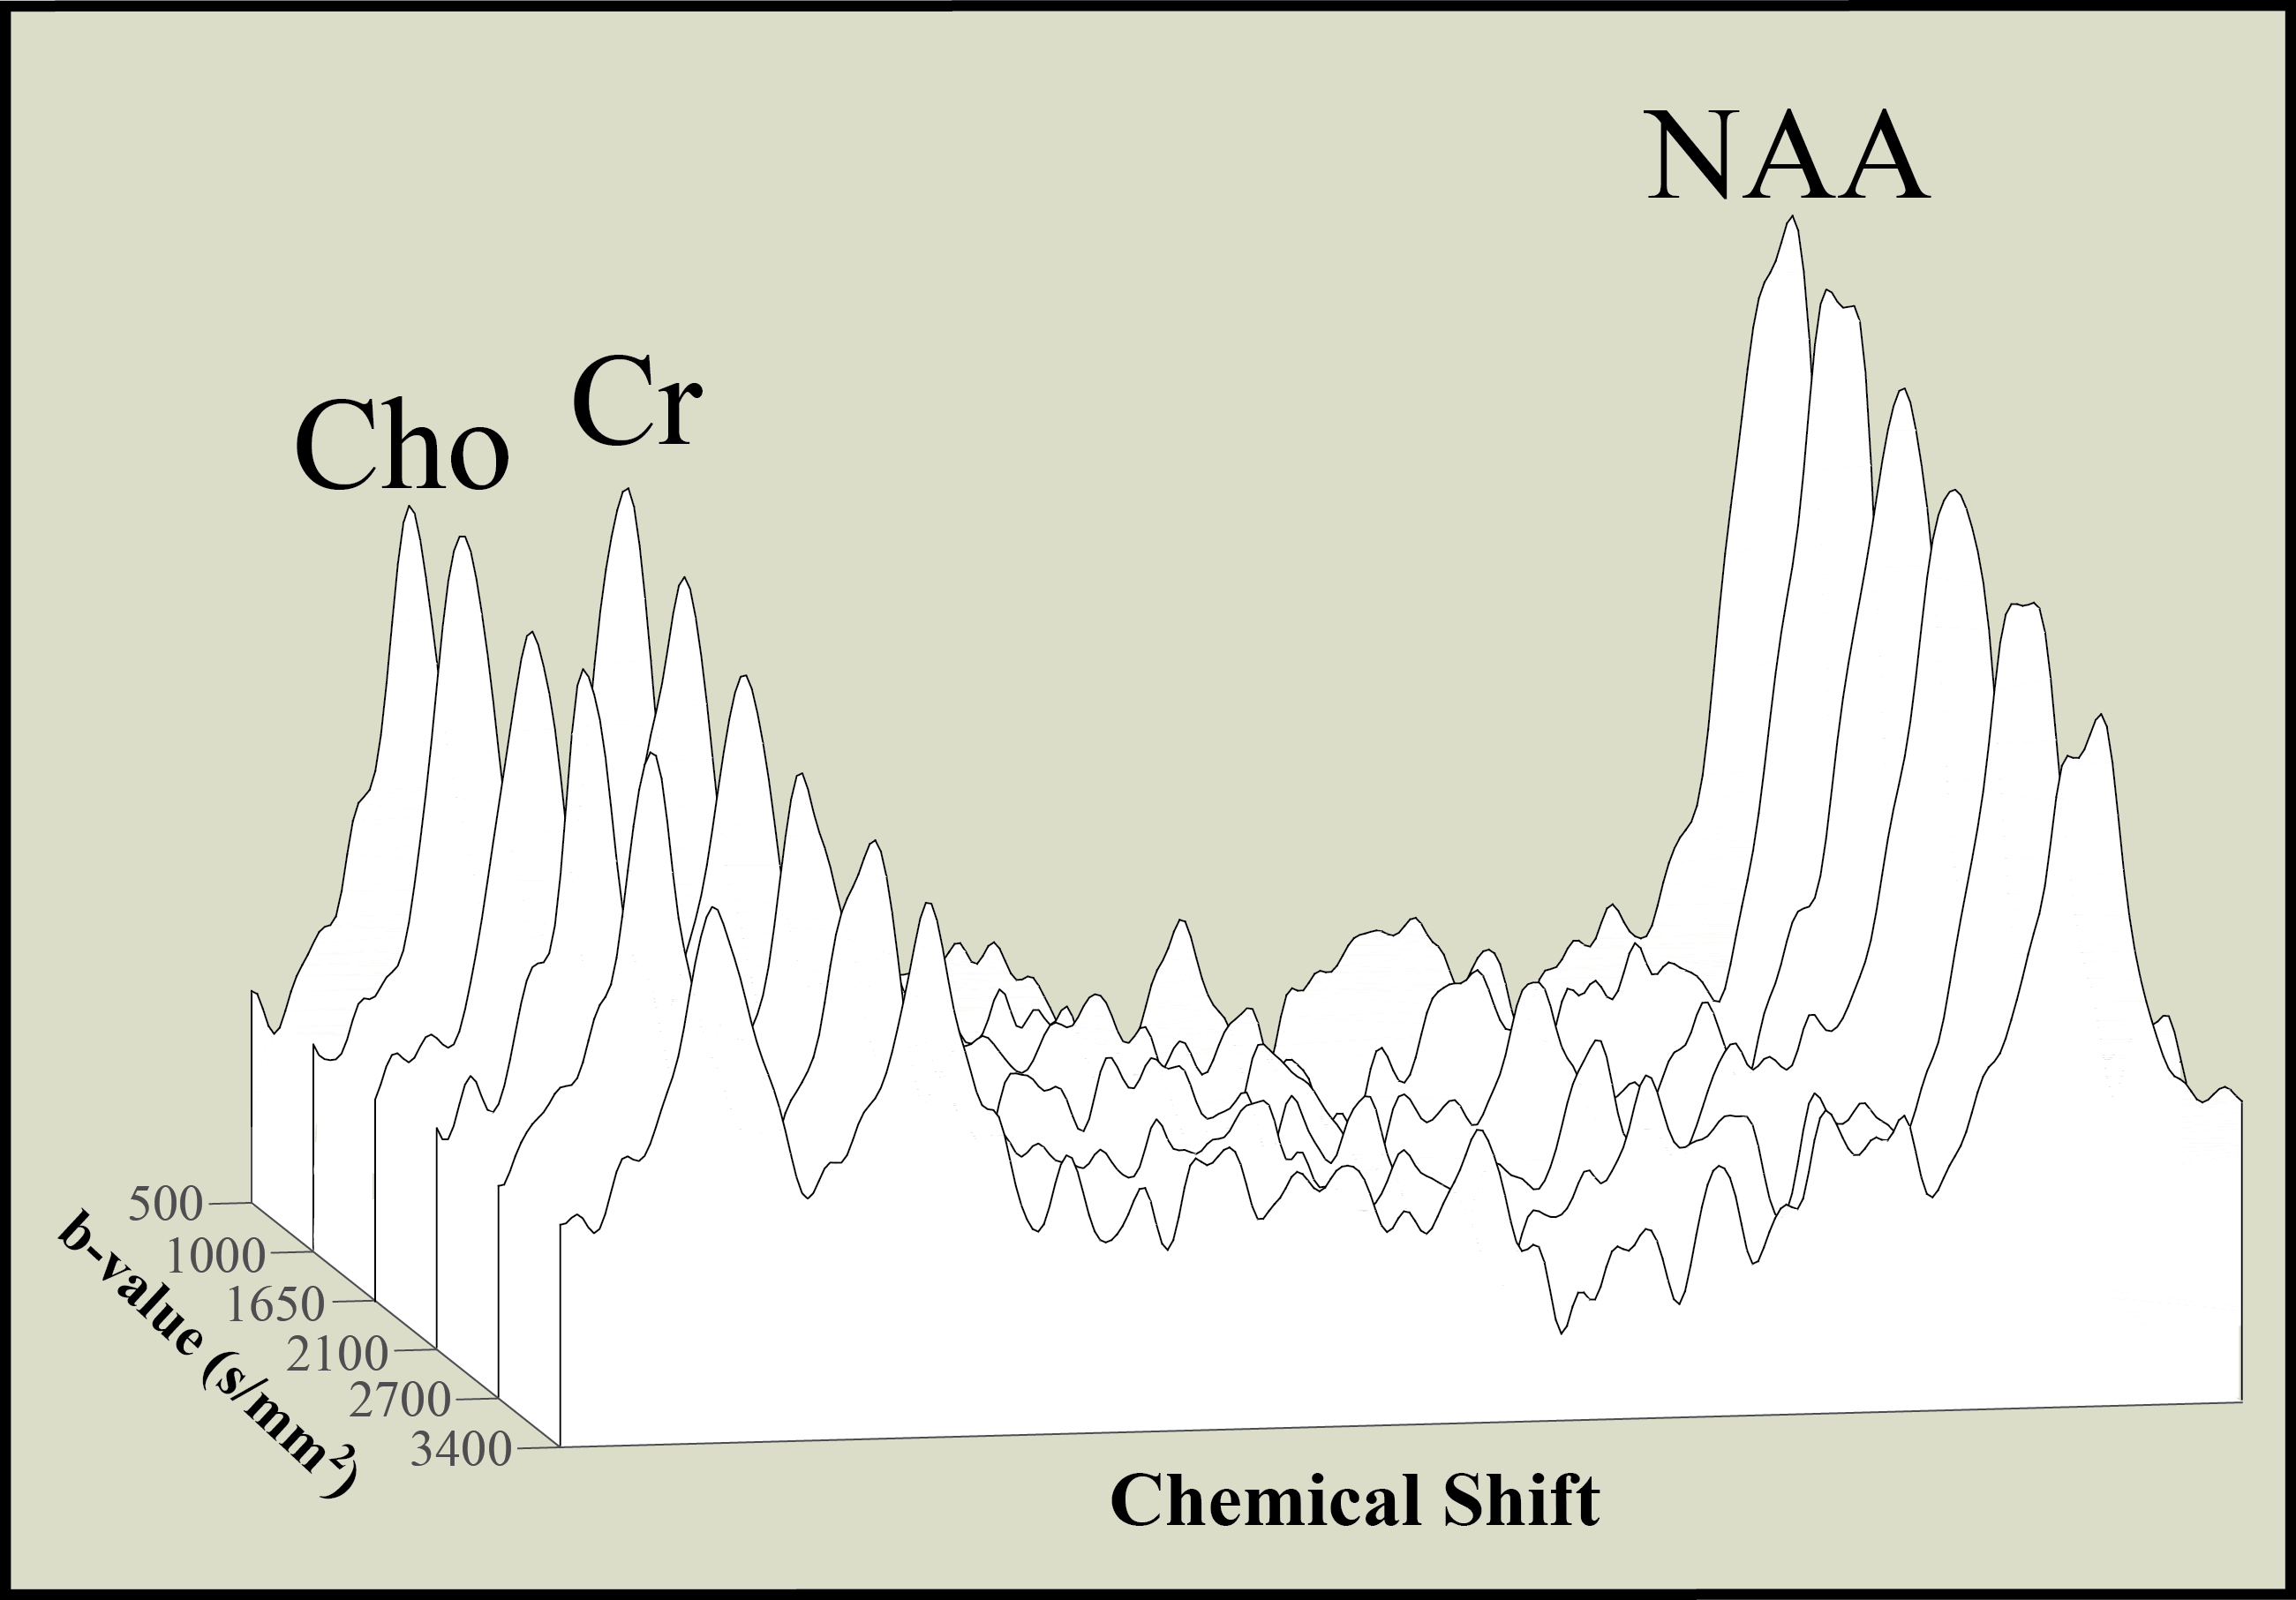
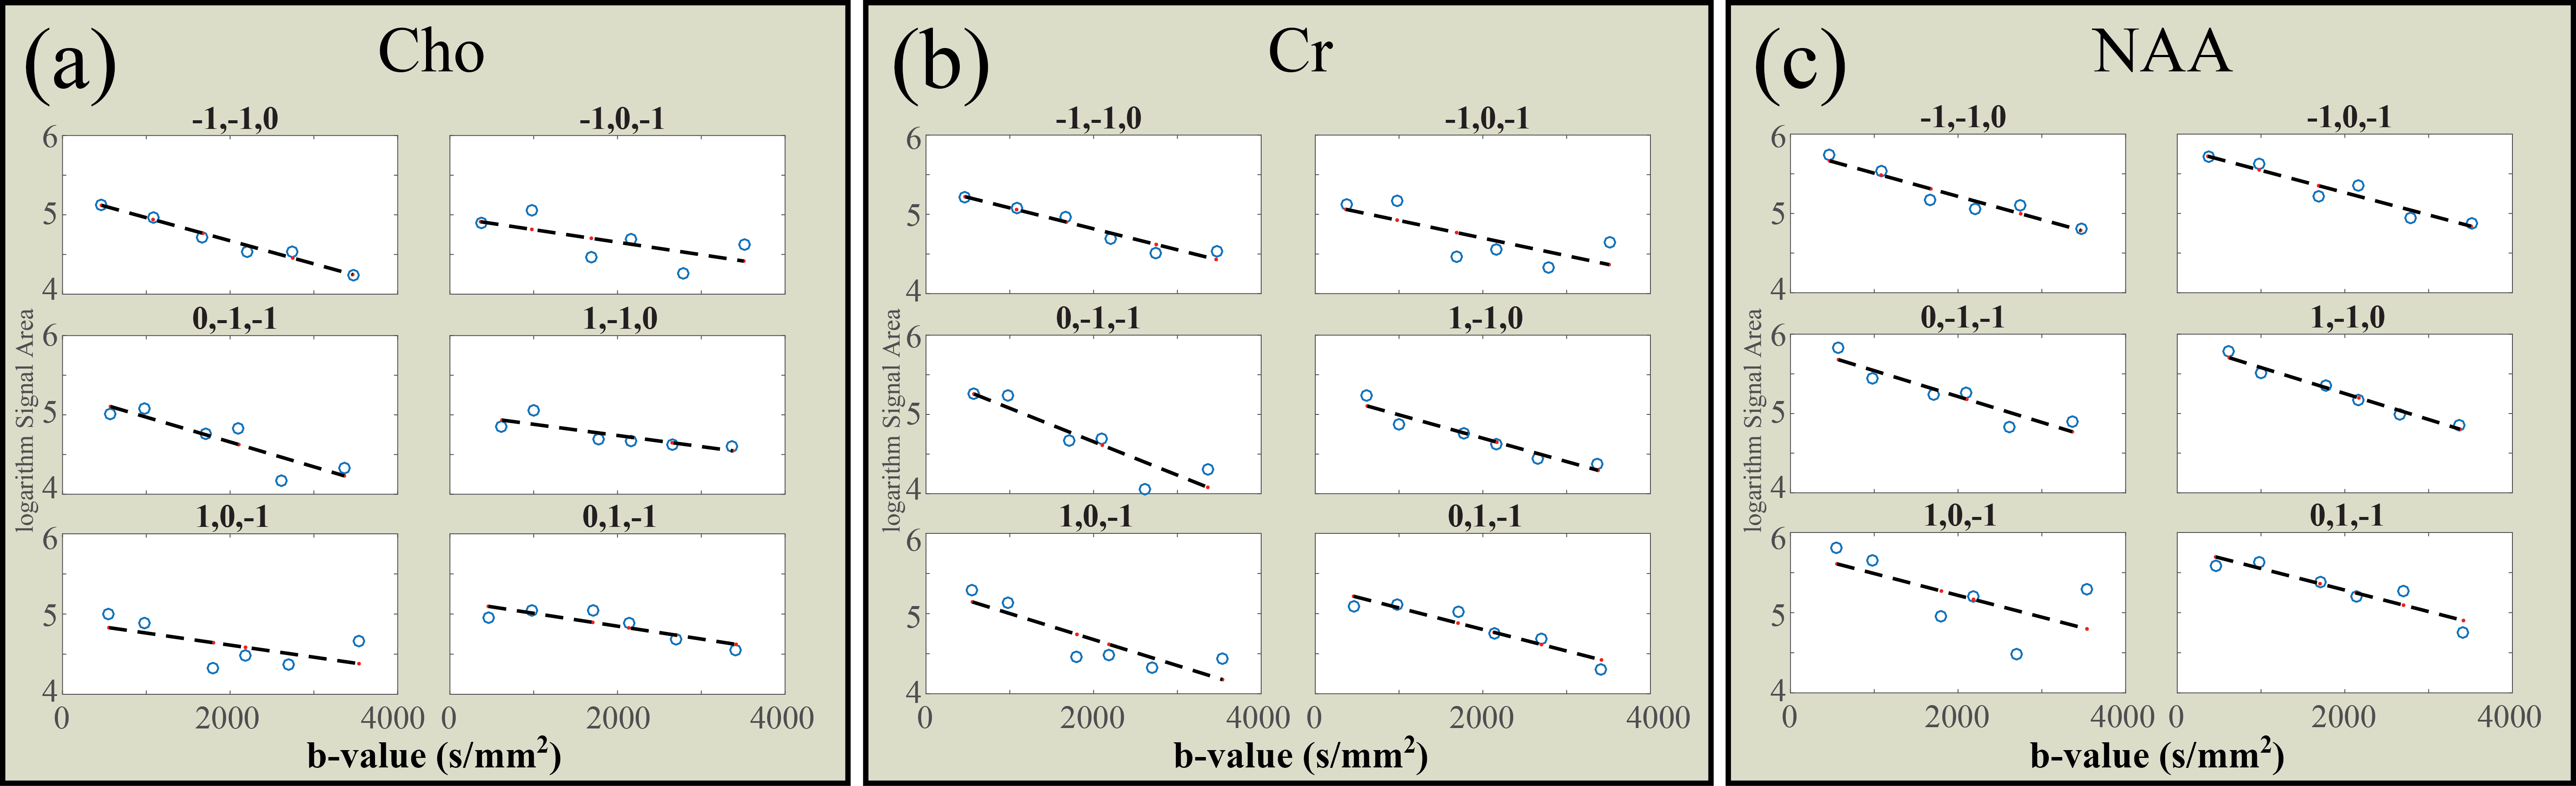
Based on the departure from a linear decay observed in Experiment 1 (Figure 1b) for the metabolites, the maximum b-value used in Experiment 2 from the mid-corpus callosum shown in Figure 2, was 3400 s/mm2 which used six b values along each of six diffusion directions (12 min acquisition time total), shown in Figures 3 &4 to yield: MD in 10-3 mm2/s (NAA=0.28±0.05, Cr=0.31±0.03, Cho=0.27±0.01), FA (NAA=0.74±0.02, Cr=0.63±0.08, Cho=0.68±0.17), DParallel in 10-3 mm2/s (NAA = 0.55 ± 0.10, Cr = 0.55 ± 0.09, Cho = 0.52 ± 0.12), and DPerpendicular in 10-3 mm2/s (NAA = 0.19 ±0.01, Cr = 0.14 ± 0.03, Cho = 0.14 ± 0.05) over all 5 volunteers.
Discussion & Conclusion
Our refined methodology acquired spectra for each b-value/direction in 20 seconds, making feasible both the 51 b-value signal decay study (Experiment 1), and the six b-value/6 direction rapid DTS (Experiment 2). The plots shown in Figure 1b illustrate a departure from linearity above ~ 3000 s/mm2, compared to that for the n-octanol (Figure 1a), highlighting the caution needed when selecting b-values for DTS studies. This is particularly pertinent for previously reported analyses using a 2-point fit, and raises the possibility of error if using a b-value in a non-linear region. Our DTS study took this information into account and acquired data within the linear decay region. The use of six b-values yielded full tensor data in 12 minutes that is consistent with the literature that used much longer scan times. Fine tuning of our new method to use fewer b values would provide additional time savings to allow for studies of multiple DTS volumes, or for studies of critically ill subjects to keep total scan time to a minimum.Acknowledgements
The authors would like to acknowledge the Canadian Institutes of Health Research (CIHR) for financial support for this work.References
1. Upadhyay J, Hallock K, Erb K, Kim D-S, Ronen I. Magn Reson Med 2007,58,1045-1053
2. Ellegood J, Hanstock C, Beaulieu C. Magn Reson Med 2006,55,1-8.
3. Ercan A, Techawiboonwong A, Versluis M, Webb A, Ronen I. Magn Reson Med 2015,73,2053-2061
4. Ellegood J, Hanstock C, Beaulieu C. NMR in Biomedicine 2011,24,270-280.
5. Wood E, Ercan A, Branzoli F, Webb A, Sati P, Reich D, Ronen I. NMR in Biomedicine 2015,28,976-987.
6. Assaf Y, Cohen Y. NMR Biomedicine 1999:12:335–344.
7. Pfeuffer J, Provencher S, Gruetter R. Magn Reson Materials in Physics, Biology and Medicine 1999, 98-108.
8. Niendorf T, Dijkhuizen R, Norris D, van Lookeren Campagne M, Nicolay K. Magn Reson Med 1996,36,847-857.
9. Nicolay K, Braun K, Graaf R, Dijkhuizen R, Kruiskamp M. NMR in Biomedicine 2001,14,94-111.
10. Hennig J. J Magn Reson 1992,96,40-49
11. Provencher S. NMR in Biomedicine 2001,14,260-264.
Figures