3018
Feasibility and Reproducibility of Neurochemical Profiling in the Human Hippocampus at 7T1Department of Radiology, CMRR, University of Minnesota, Minneapolis, MN, United States, 2Department of Pediatrics, University of Minnesota, Minneapolis, MN, United States
Synopsis
Despite advancements in single-voxel hippocampal 1H MR spectroscopy, low abundant and J-coupled metabolites, which are critically involved in neuro-energetics, memory and excitation/inhibition balance, are still poorly quantified at 3T. Hippocampal 1H MRS at 7T may benefit from higher SNR and better spectral dispersion. Thus, the precision and test-retest reproducibility of quantification achieved at 7T using semi-LASER sequence was compared to the outcome of a similarly designed 3T study. The higher SNR at 7T relative to 3T allowed using smaller voxel for more precise selection of hippocampal gray matter while demonstrating improved quantification of J-coupled and/or low abundant metabolites.
Introduction
The hippocampus plays an essential role in learning, memory formation and stress regulation. Hippocampus dysfunction is critically involved in several neurological disorders such as Alzheimer's disease and temporal lobe epilepsy. Despite recent advances in the methodology of single voxel 1H MR spectroscopy, the hippocampus remains a challenging region for this technique.1 Metabolites involved in neuroenergetics (Lac, Glu), memory formation (Lac), maintaining of excitation/inhibition balance (Glu, GABA) and antioxidants (GSH, Asc) that sustain unaltered hippocampal functioning are poorly quantifiable at 3T.1 These neurochemicals are of a substantial interest and might serve as markers of disease progression or treatment effects. The higher SNR and better spectral dispersion at 7T promise comprehensive neurochemical profiling of the hippocampus relative to 3T. Hence, we compared precision and reproducibility of metabolite quantification at 3T and 7T MR systems.Methods
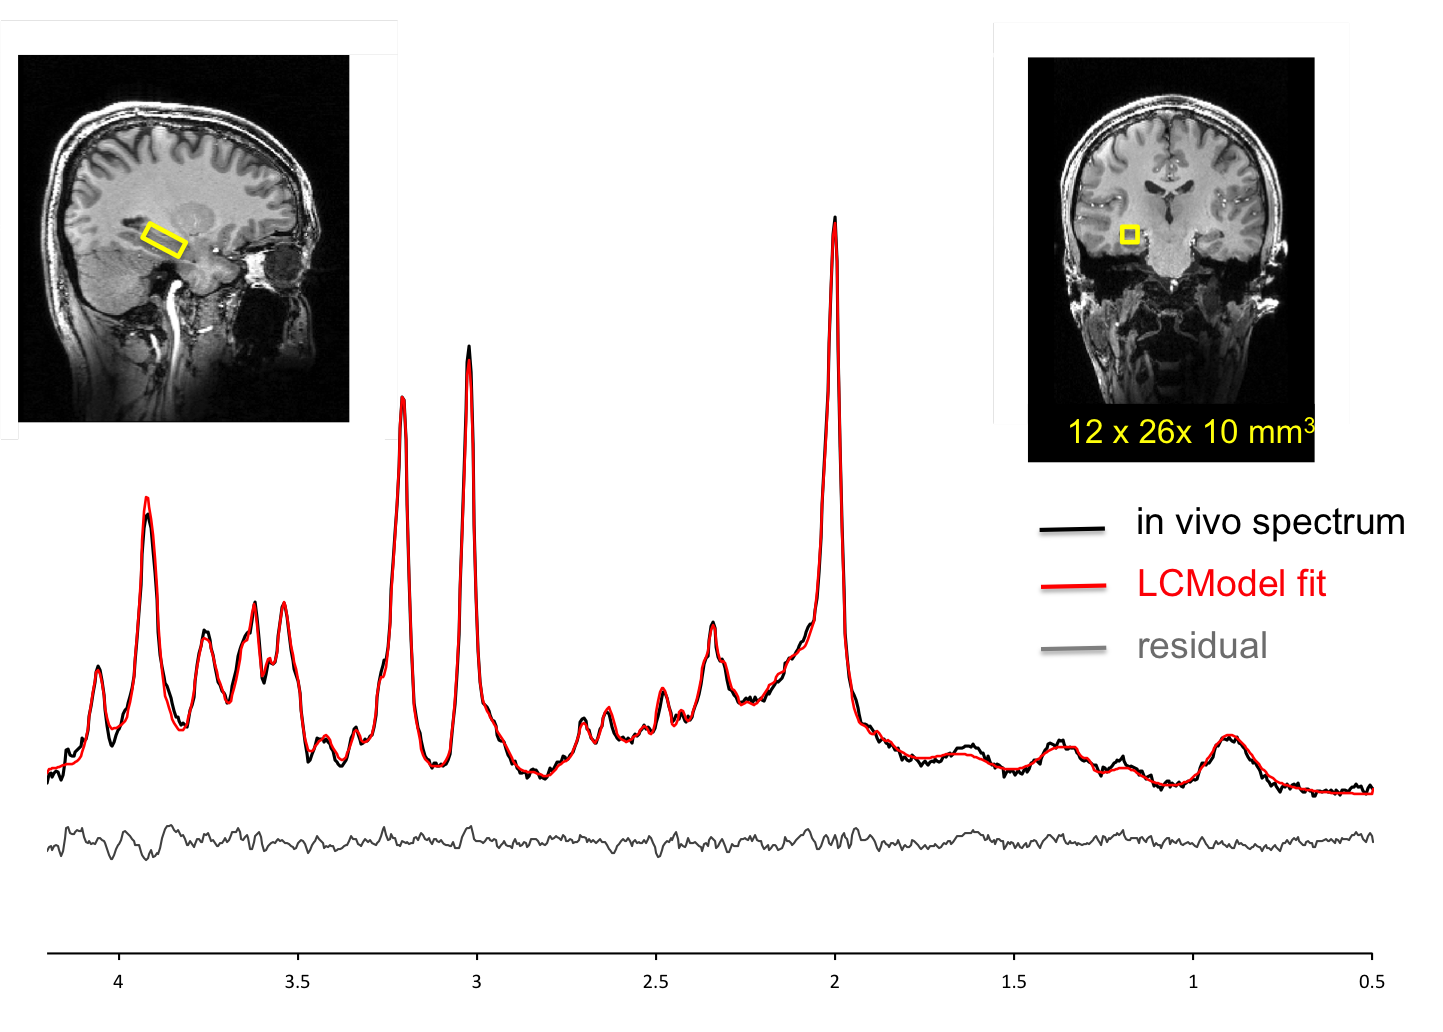
The MRS experiment was conducted on 7T/90cm scanner interfaced to Siemens console. Data were obtained with commercially available 32Rx/single transmit channel Nova coil. A barium titanate/D2O (40% BaTiO3, v/v) dielectric pad with dimensions of 18x10x0.8 cm was placed over the right temporo-occipital region to increase the transmit field in the hippocampus.2 High-resolution MPRAGE images were registered to a standard template using Siemens AutoAlign function2 to reproducibly place a 3mL voxel in the right hippocampus (Fig.1). PD-weighted images were used to minimize bias field-related intensity gradients allowing for precise within-voxel brain segmentation to quantify fractional content of cerebrospinal fluid (CSF) and gray matter (GM). An automatized FASTMAP shimming technique minimized within-voxel B0 inhomogeneity. 1H MR pectra were acquired with a semi-LASER localization sequence (TR = 6.5 s, TE = 28 ms). FOCI adiabatic pulses3 were used for adiabatic inversion. Spectra were acquired from 5 volunteers in two visits (10 sessions in total). In 4 volunteers spectra were obtained with 256 excitations in one of the visits, in the remaining 6 sessions number of excitation (NEX) was 64. The concentrations were corrected for the within-voxel fraction cerebrospinal fluid (CSF). Unsuppressed water spectrum was used as an internal reference for quantification. SNR of the metabolite spectrum (measured in the frequency domain as ratio of the NAA methyl resonance at 2.02 ppm and root mean square of the noise on the summed spectrum, NEX=64) and linewidth of the unsuppressed water were used as spectral quality metrics. The LCModel estimate of quantification precision (CRLB) and between-session coefficients of variation (CV) were obtained per metabolite and compared to a 3T test-retest study.1Results and Discussion
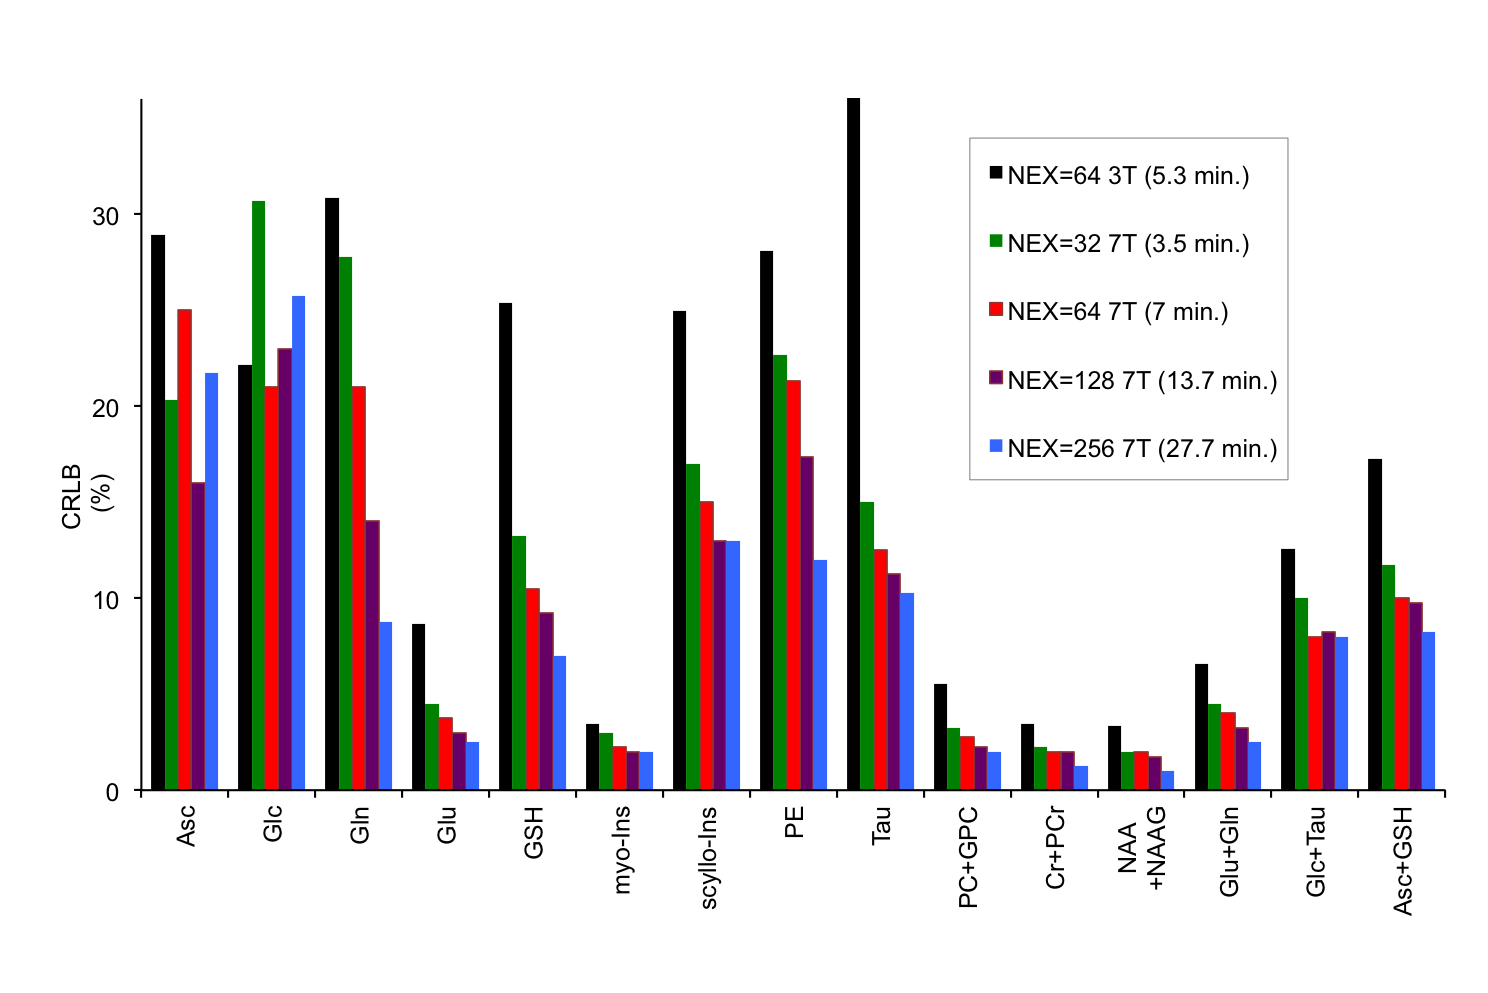
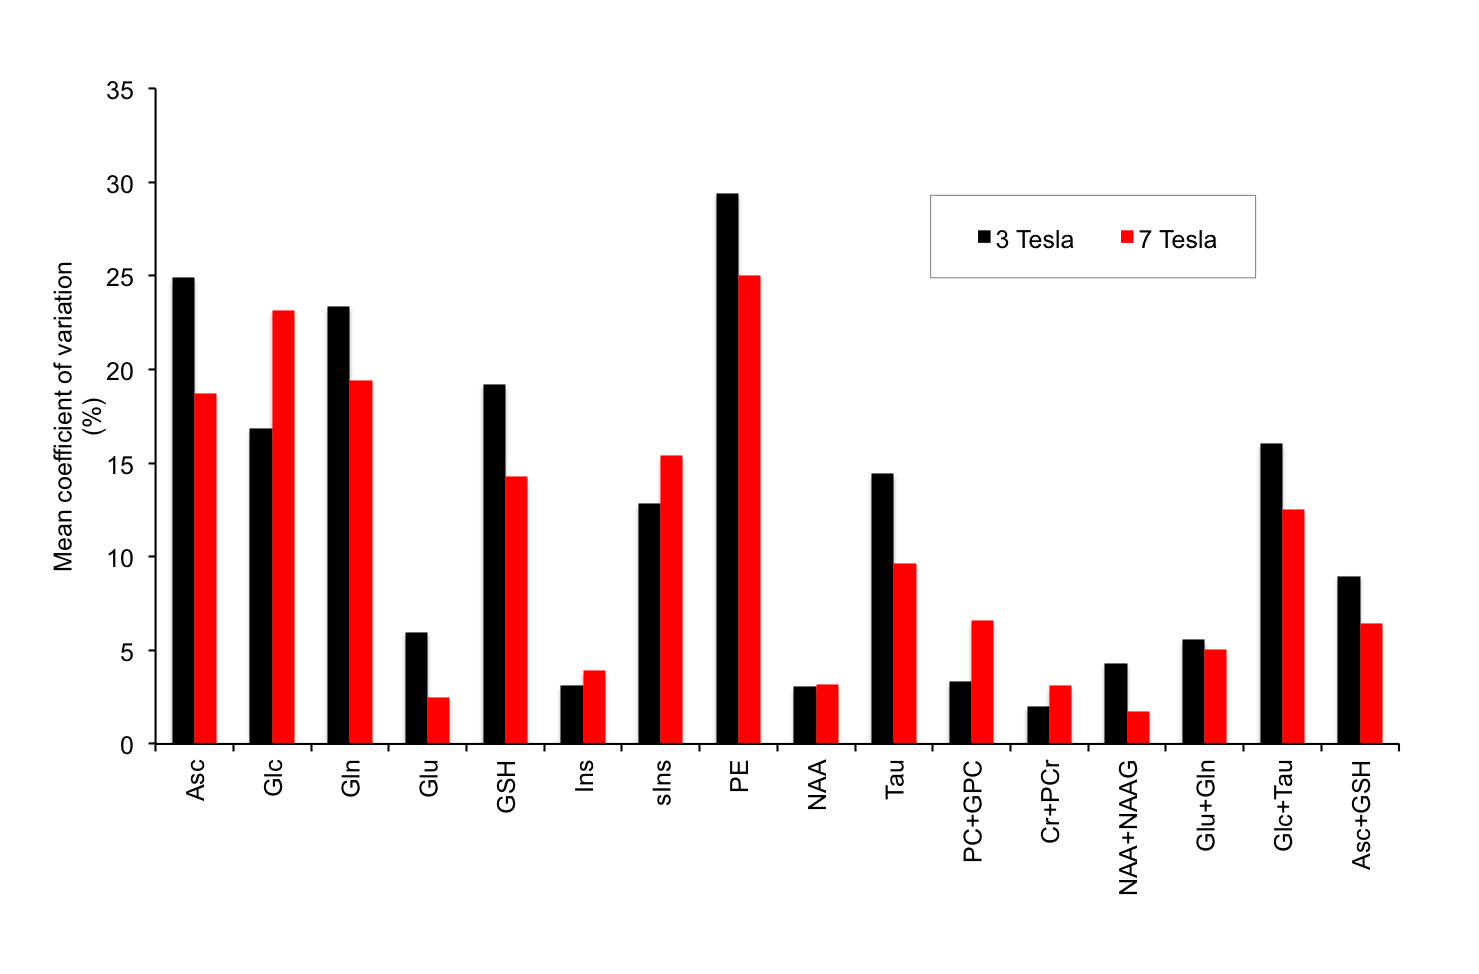
The average SNR achieved at 7T was 75±10 and the average linewidth was 16.3±1.2 Hz pointing to high spectral quality (Fig 1.). The 3T/7T comparison of CRLB demonstrated that all metabolites, except glucose, exhibit remarkably smaller CRLB for 7T (NEX=32) than for 3T data (NEX=64) acquired from a bigger voxel (4mL) (Fig 2.). Glucose quantification was more reliable at 3T as also shown in other brain regions at 7T.4 CRLB progressively improved with increasing NEX at 7T (Fig.2). In contrast to 3T, Asp, GABA, Lac and NAAG could be quantified at 7T with CRLB<50% in more than half of the scanning sessions. The average within-voxel GM and CSF fractions were 70.9%±7.2%, 1.8%±1.0%, respectively. GM fraction was higher than in 3T data (64%) indicating the higher selectivity for hippocampal gray matter with a smaller voxel at 7T. While CRLB estimate quantification errors of a single-session data, between-session CVs quantify measurement errors that include all factors that affect variability in metabolite concentrations, such as subject placement and day-to-day physiological variability. The CVs were lower for Asc, Gln, Glu, GSH, PE, Tau, Glc+Tau and Asc+GSH at 7T relative to 3T, whereas similar values or opposite trends were observed in metabolites which are well quantifiable at 3T (e.g. myo-Ins, tCho) (Fig 3.). CVs of NAA were very similar at 3T and 7T, whereas CV for tNAA improved at 7T due to more reliable quantification of NAAG at 7T. Hence, improved spectral quantification precision and reproducibility of J-coupled and/or low-abundant metabolites in the hippocampal region demonstrate benefits of 7T and align with previous outcomes from other brain regions.4Conclusions
Our study demonstrated feasibility of single-voxel hippocampal 1H MR spectroscopy at 7T with, commercially available coil, and short acquisition time (~7 min.). Over 3T, 7T benefits from high SNR and allows utilization of a smaller voxel, which can cover hippocampal gray matter more selectively. 7T data showed improved quantification of J-coupled and/or low abundant metabolites that could not be achieved at 3T.Acknowledgements
P41 EB015894, P30 NS076408, UL1TR000114References
1. Bednarik P, Moheet A, Deelchand DK, Emir UE, Eberly LE, Bares M et al. Feasibility and reproducibility of neurochemical profile quantification in the human hippocampus at 3 T. NMR in biomedicine 2015; 28(6): 685-93.
2. van der Kouwe AJ, Benner T, Fischl B, Schmitt F, Salat DH, Harder M et al. On-line automatic slice positioning for brain MR imaging. NeuroImage 2005; 27(1): 222-30.
3. Tannus A, Garwood M. Adiabatic pulses. NMR in biomedicine 1997; 10(8): 423-34.
4. Terpstra M, Cheong I, Lyu T, Deelchand DK, Emir UE, Bednarik P et al. Test-retest reproducibility of neurochemical profiles with short-echo, single-voxel MR spectroscopy at 3T and 7T. Magn Reson Med 2016; 76(4): 1083-91.
Figures