3016
Simultaneous measurement of Aspartate, NAA, and NAAG using HERMES spectral editing at 3 Tesla1Biomedical Engineering, Johns Hopkins School of Medicine, Baltimore, MD, United States, 2Russell H. Morgan Department of Radiology and Radiological Science, Johns Hopkins School of Medicine, Baltimore, MD, United States, 3F. M. Kirby Research Center for Functional Brain Imaging, Kennedy Krieger Institute, Baltimore, MD, United States
Synopsis
It has previously been shown that the HERMES method (‘Hadamard Encoding and Reconstruction of MEGA-Edited Spectroscopy’) can be used to simultaneously edit two metabolites (1). Examples of pairs of metabolites edited include N-acetyl-aspartate (NAA) and N-acetyl aspartyl glutamate (NAAG), or glutathione and GABA (2). Here, we demonstrate that HERMES can acquire simultaneously and then separate three overlapping edited signals, for the example of NAA, NAAG and Aspartate (Asp). We optimize this sequence using simulations, and show its feasibility in phantoms and in vivo. We also explore the echo time modulation of the aspartate spin system using simulations and phantom experiments.
Purpose
It has previously been shown that the HERMES method (‘Hadamard Encoding and Reconstruction of MEGA-Edited Spectroscopy’) can be used to simultaneously edit two metabolites (1). Examples of pairs of metabolites edited include N-acetyl-aspartate (NAA) and N-acetyl aspartyl glutamate (NAAG), or glutathione and GABA (2). The purpose of this abstract is to demonstrate that HERMES can acquire simultaneously and then separate three overlapping edited signals, for the example of NAA, NAAG and Aspartate (Asp).Methods
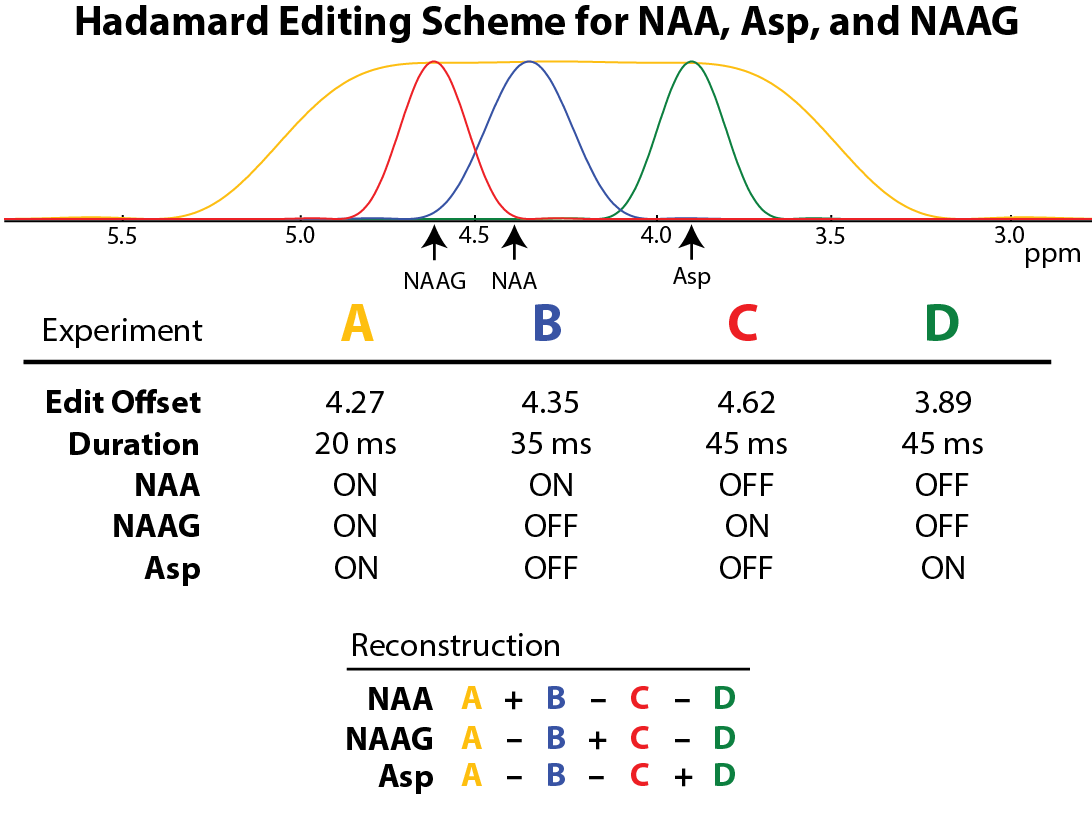
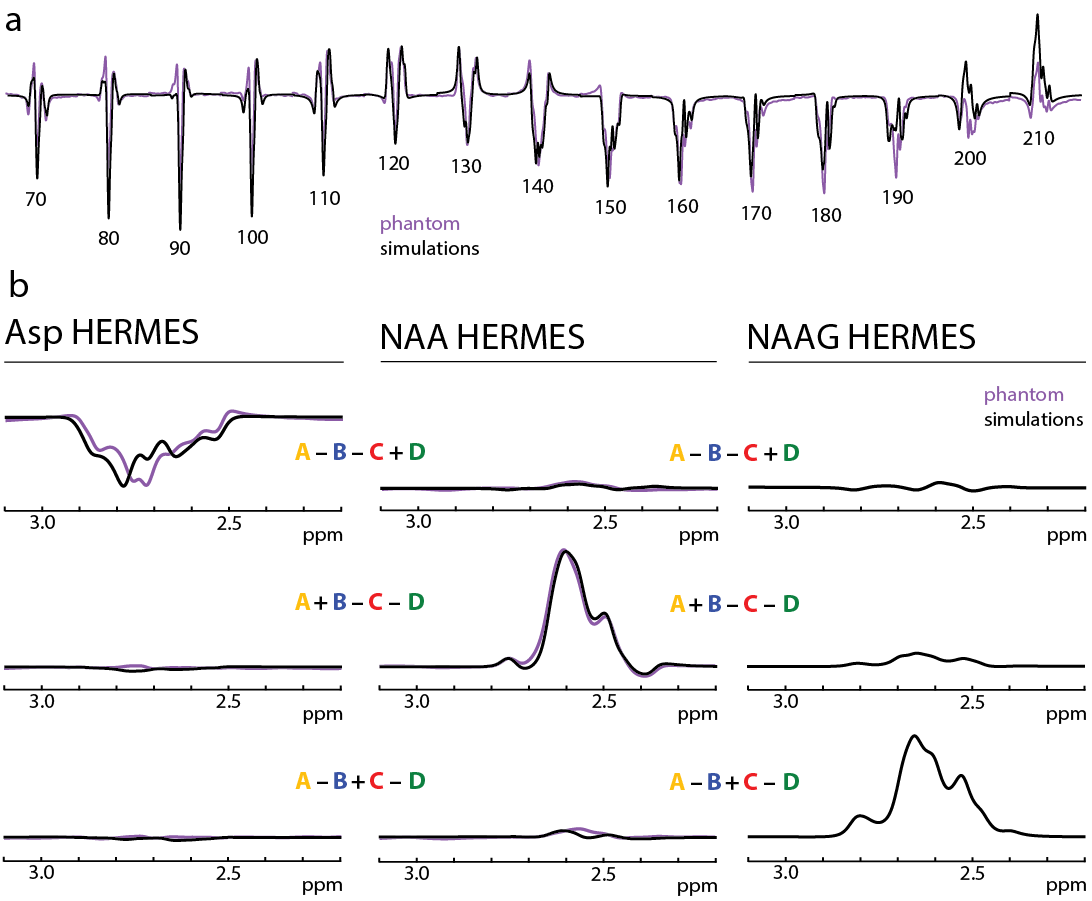
Simulations The b-aspartyl resonances of Asp, NAA and NAAG all resonate in the vicinity of 2.6-2.8 ppm and are heavily overlapped, making them difficult to separate using conventional MRS. However, the coupled a-aspartyl resonances are quite well resolved, resonating at 3.89, 4.38 and 4.62 ppm respectively, and can be used to selectively edit each compound (3,4). To determine the optimal echo time (TE) to edit aspartate, density-matrix simulations were performed at TEs of 70-210 ms with sinc-Gaussian editing pulses applied at 3.89 ppm (‘ON’) and 10 ppm (‘OFF’) . HERMES experiments were then simulated for NAA, NAAG, and Asp according to Figure 1 at TE 150 ms. Experiment A (ON,ON,ON) was performed with 25 ms editing pulses with a square profile at 4.27 ppm to fully invert NAA spins at 4.38 ppm, NAAG spins at 4.61 ppm, and Asp spins at 3.89 ppm. Experiment B (ON,OFF,OFF) was performed with more selective 35 ms sinc-Gaussian editing pulses at 4.35 ppm to invert the 4.38 ppm NAA spins. Experiment C (OFF,ON,OFF) was performed with 45 ms sinc-Gaussian editing pulses at 4.62 ppm to invert the 4.61 NAAG spins. Experiment D (OFF, OFF, ON) was performed with 45 ms sinc-Gaussian editing pulses at 3.89 ppm to invert the Asp spins. Asp, NAA, and NAAG were simulated independently, and Hadamard combinations were calculated to generate metabolite spectra and visualize the degree of ‘crosstalk’ between the combinations. Phantom Experiments HERMES NAA/NAAG/Asp experiments were performed in a 10 mM NAA phantom and a 25 mM Asp phantom using a Philips Achieva 3T scanner. Parameters were same as in the simulations; the voxel size was (3 cm)3 , TR 2 s, and 64 averages. Spectra were reconstructed to generate the three Hadamard combinations, including separated NAA and Asp signals. In vivo HERMES NAA/NAAG/Asp experiments were performed in a 5x3x3 cm3 voxel located in the centrum semiovale white matter in 8 healthy adults using VAPOR water suppression and 384 averages. Prospective frequency correction for B0 field drift was performed based on interleaved water-unsuppressed reference scans (5). The ‘Gannet’ program was used for post-hoc frequency- and phase-correction of individual transients using the 2 ppm acetyl resonance (6). The Hadamard reconstructed NAA, NAAG, and Asp spectra were then fit a model based on the simulations to extract a scaling factor indicative of the metabolites’ relative concentrations. For Asp, the simulated models of residual NAA and NAAG were also fit. Concentrations of all three metabolites were then estimated as in reference (1).Results
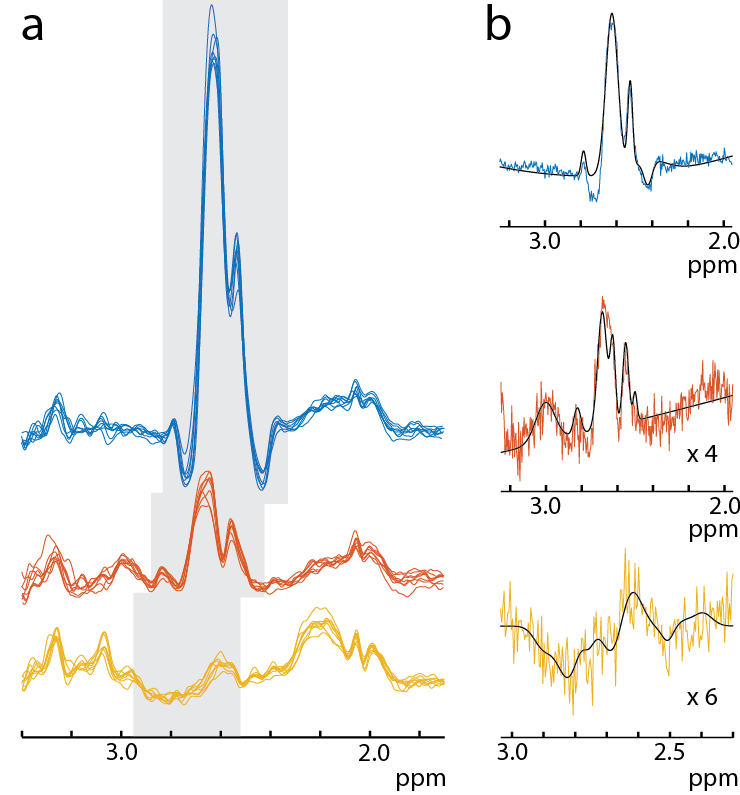
In both simulations and phantom experiments, Asp shows significant TE-modulation of the observed peak at 2.6 ppm (Figure 2a). Asp reaches a maximally negative signal at TE 140-160 ms, a range that is also optimal for NAA and NAAG editing (1). Figure 2 shows good agreement between phantom and simulations in both the multiplet patterns and relative signal intensities of all Hadamard combinations for NAA, NAAG, and Asp. Both simulations and phantom experiments show minimal metabolite crossover. Relative to NAA and NAAG, Asp shows an inverted peak. Figure 3a shows the Hadamard reconstructed NAA, NAAG, and Asp spectra in all 8 subjects. Asp is inverted, consistent with the simulations and phantom experiments. Fitting the data as in Figure 3b leads to the following concentrations: NAA 8.03 ± 0.69 mM, and NAAG 2.16 ± 0.34 mM and Asp 0.88 ± 0.18 mM in agreement with literature values (4,7,8).Discussion
This abstract demonstrates that a 4-step Hadamard-encoded editing scheme is capable of separately editing NAA, NAAG, and Asp, with minimal crosstalk. Although Asp has an inverted TE-modulated edited signal relative to NAA and NAAG (due to its larger J33’ coupling), all three metabolites share the same optimal echo time, allowing for HERMES editing with near maximal sensitivity for each. HERMES editing represents a 3-fold reduction of scan time compared to acquiring each compound individually using MEGA-PRESS. These data demonstrate that Asp can be edited in vivo and that HERMES can be extended to simultaneously edit three otherwise overlapping metabolites.Acknowledgements
This work was supported by NIH R01 EB016089 and P41 EB015909.References
1. Chan KL et al. Magn Reson Med 76(1):11-19, 2016.
2. Saleh MG et al. NeuroImage 2016 142:576-82, 2016.
3. Edden RA et al. Magn Reson Med 57(6):977-82, 2007.
4. Murdoch J et al. Proc ISMRM 2013, p 2026.
5. Edden et al. J Magn Reson Imag 2016, in press.
6. Edden et al. J Magn Reson Imag 40(6):1445-52, 2014.
7. Govinduraju et al. NMR in Biomed 2000;13:129–53
8. Pouwels PJ et al. NMR Biomed 1997;10: 73-78.
Figures