3015
Qualitative Comparison between In Vivo J-Resolved Semi-LASER at 3 T and 9.4 T1High Field Magnetic Resonance, Max Planck Institute for Biological Cybernetics, Tuebingen, Germany, 2Department of Psychiatry, Charité - Universitätsmedizin Berlin, 3Institute of Physics, Ernst-Moritz-Arndt University Greifswald, Greifswald, Germany
Synopsis
J-resolved semi-LASER with maximum-echo sampling is optimized at 9.4T and compared with the same implementation at 3T in terms of SNR and spectral resolution. SODA scheme is appreciated for the sequence rather than the MC scheme. SNR at 9.4T (t1 steps: 85) was approximately 5.8 times greater than at 3T (t1 steps: 100) and strongly coupled peaks are well-resolved. However, the trade-off between SNR and spectral resolution is explained as lactate (1.32 ppm), a weakly-coupled metabolite, is better resolved at 3T. Higher band-width AFP pulses helped in almost vanishing the J-refocused peaks which made the J-resolved peaks clearly distinguishable. A few interesting downfield peaks and the doublet of NAA (7.82ppm) are observed.
Purpose
Enhancing the signal-to-noise ratio(SNR) and
the spectral resolution have always been the ambition in the field of in vivo 1H
magnetic resonance spectroscopy. Spectroscopic studies at ultra-high field
benefit from both increased spectral resolution and improved SNR. A distinct
method to reduce spectral signal overlap is 2D spectroscopy, which spreads the
spectral information along two frequency axes1-5. Exploiting these two
complimentary approaches, a J-resolved semi-LASER sequence with maximum-echo
sampling(MES) scheme was optimized for the application in human brain at 9.4T.
Also a qualitative comparison between J-resolved semi-LASER at 3T1 and 9.4T in
terms of SNR and spectral resolution was done.Methods
J-resolved semi-LASER experiments
were performed on a Siemens Magnetom 9.4T and a Siemens Trio 3T whole-body MRI
scanner(Erlangen, Germany). A voxel of 2x2x2 cm3 was chosen
in the occipital lobe with a mixed gray and white matter content at 9.4T and in
the pre-frontal cortex at 3T. Four-channel transceiver coil6 was
used at 9.4T and was shimmed using the FASTEST MAP7. Power
calibration was performed for the selected voxel. At 3T and 9.4T, the shortest TE
was 24ms, the step size was ∆TE=2ms. 50 or 85 echo time increments were
recorded at 9.4T whereas at 3T 100 steps5,8 were recorded. Bandwidth
in the direct dimension was 4000Hz and 2000Hz at 9.4T and 3T, respectively.
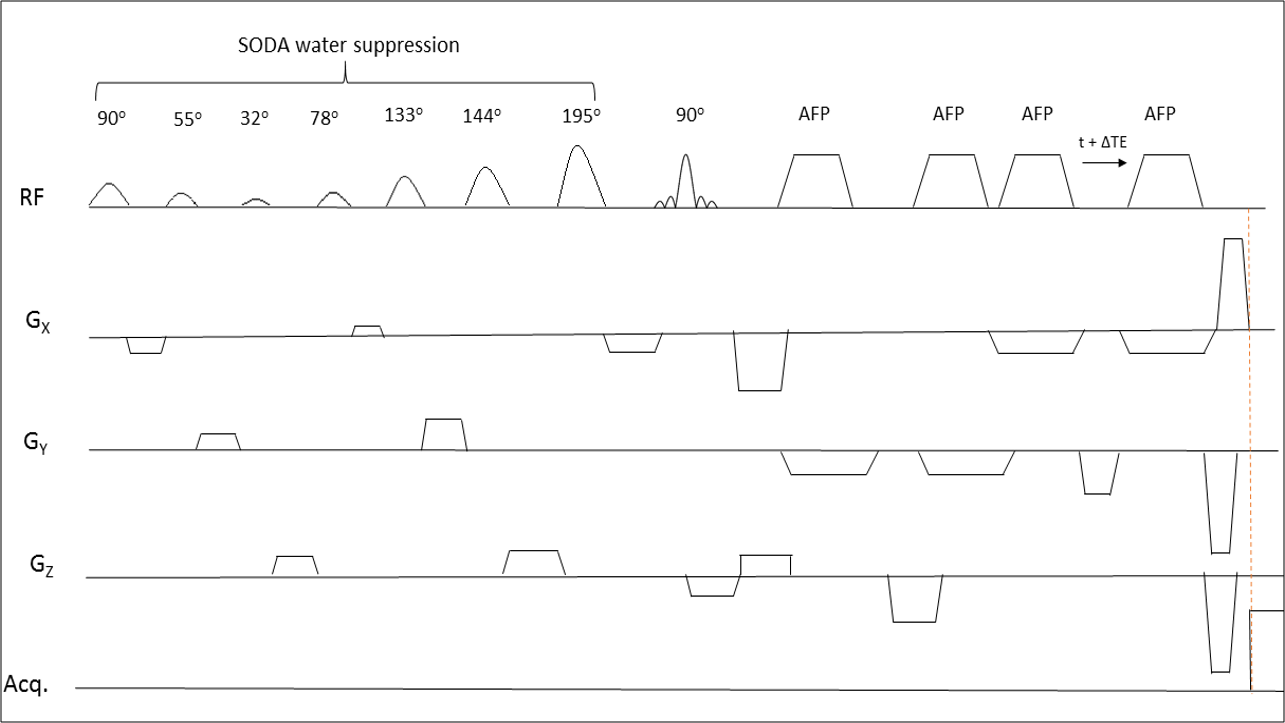
The sampling points were 4096 in the direct dimension. MES scheme was
implemented(Figure 1). Metabolite cycling(MC)9 scheme was tested
for the sequence with 8 and 16 phase-cycling steps and the resulting spectral
quality was compared to experiments with SODA10 water suppression(Short
duration water suppression using optimized flip angles). Also a non-water
suppressed experiment was performed with otherwise identical scan parameters in
order to allow for Eddy current correction11.The sequence was
optimized by performing scans on phantom and 8 healthy volunteers and later 7 healthy
volunteers participated in the study at 3T(n=1), 9.4T with 50(n=5) and 85
steps(n=1), respectively, all of them gave informed signed consent as approved
by the local ethics board.Results
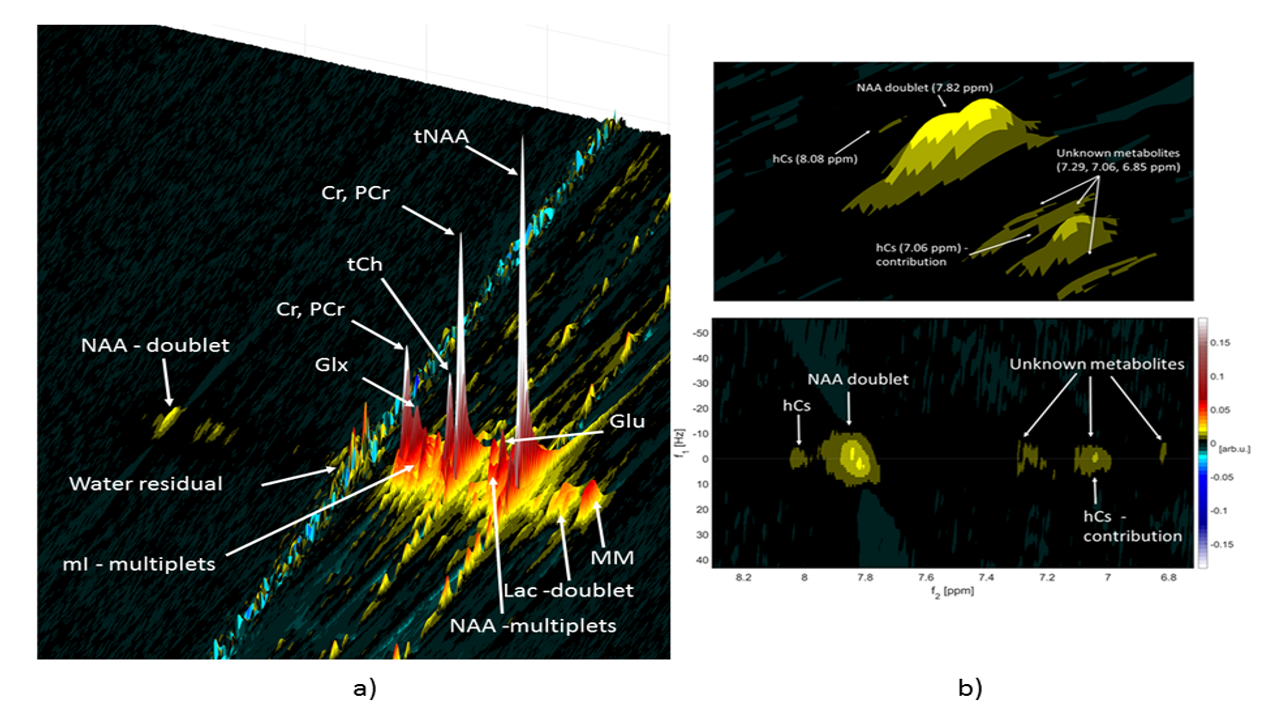
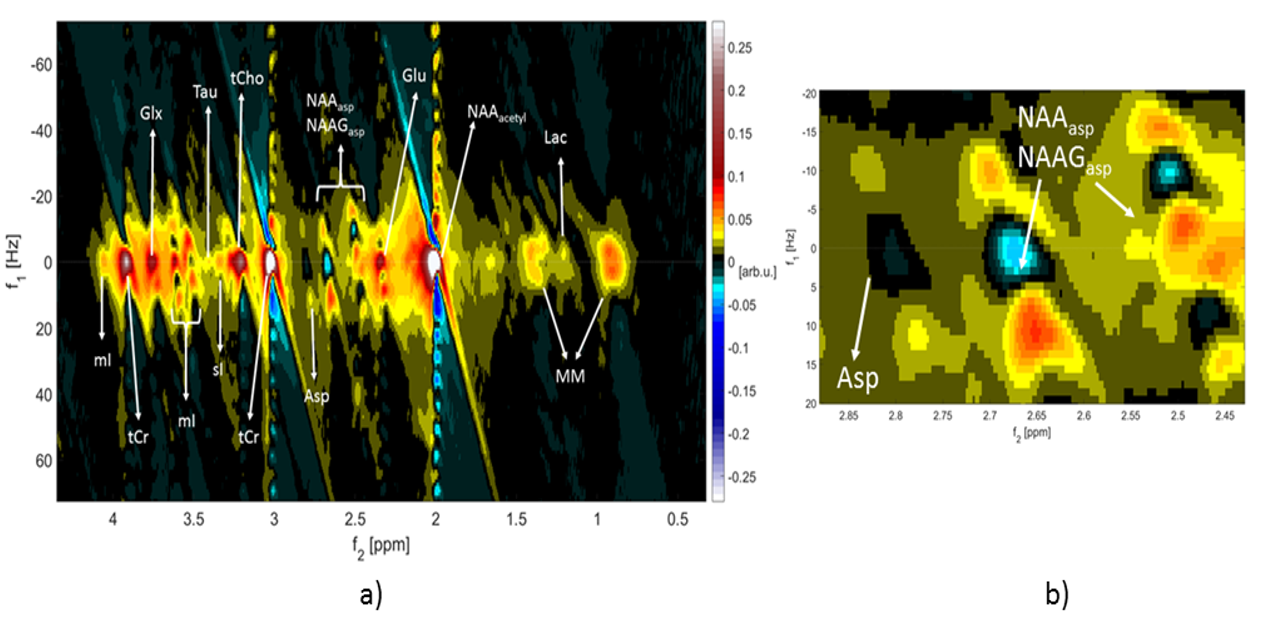
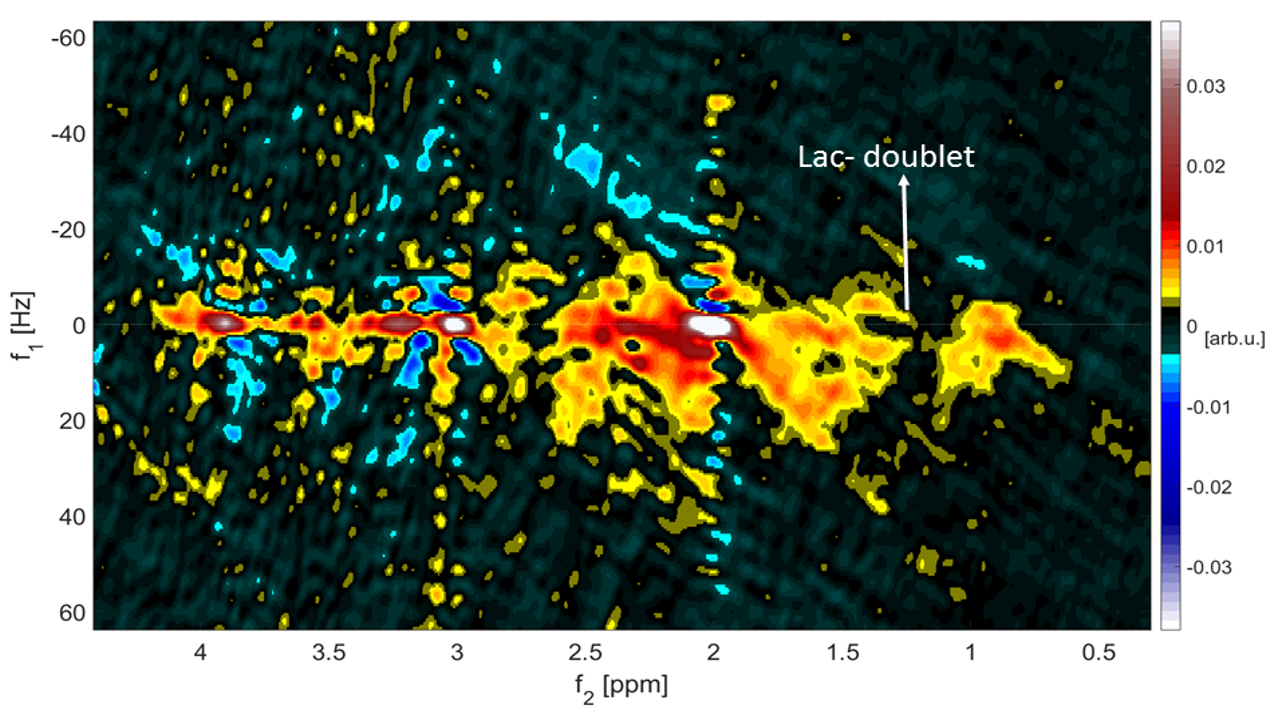
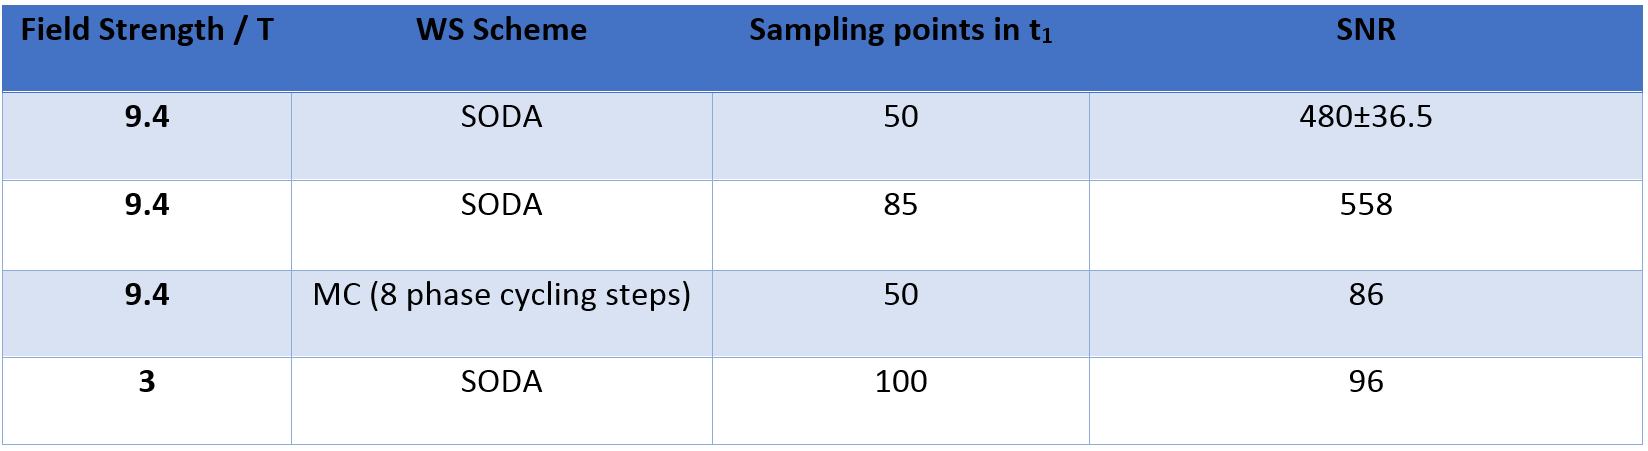
The MES scheme gave the peak tails a tilt in the 2D spectra and therefore avoided overlap of spectral peaks and peak tails from high intensity metabolites and water. SODA water suppression, yielded a suppression factor of 99.47% at 9.4T and 99.23% at 3T, gave minimal ghosting artifacts whereas MC gave stronger ghosting artifacts in the 2D spectra for 8 phase-cycling steps, which reduced with 16-step phase cycle. Due to the high pulse bandwidth and minimal chemical shift displacement artifact, J-refocused peaks were barely visible in either the 2D spectra at 3T or at 9.4T(Figure 3,4). J-resolved peaks could be well-distinguished at 9.4T(Figure 2,3) while 3T J-resolved semi-LASER data exhibited a stronger spectral overlap. However, the lactate peak at 1.32 ppm could clearly be resolved at 3T but not at 9.4T due to a lower number of sampling points in the indirect dimension(Figure 3,4) which represented a trade-off between SNR and spectral resolution at 9.4T. At only 9.4T it was possible to observe some of the down-field peaks12 like NAA(7.82ppm) and hCs(8.08ppm). The doublet of NAA at 7.82 ppm was prominently noticeable at 9.4T(Figure 2).Discussion
J-resolved semi-LASER with MES scheme was investigated for the first time at 9.4T and compared with 3T results. Compared to previous 1D MRS studies at 9.4T13 low number of averages per TE in J-resolved MRS restricts the number of possible phase cycling steps(herein 8), which appeared to be insufficient to suppress ghosting artifacts introduced by metabolite cycling. Nevertheless, SODA10 provided an excellent water suppression despite B1+ inhomogeneity at high field strengths and at 3T. Unwanted coherence pathways were suppressed during the SODA water suppression scheme using the most suitable combination of gradients. The compromise between SNR and spectral resolution of the J-resolved spectra was investigated. The weakly coupled metabolites like lactate could be better resolved at 3T rather than at 9.4T because of a larger TE range due to the Carr-Purcell behavior(CP)14,15 of the semi-LASER sequence(Figure 4). Though 9.4T showed a higher SNR(Table 1) and strongly-coupled peaks such as NAAasp and mI were well-resolved, T2 relaxation times are shorter at 9.4T16 than 3T. So, optimizing the TE range to avoid loss of signal while providing sufficient time for J-evolution is required in order to achieve both higher SNR and well-resolved weakly-coupled peaks. The appearance of the downfield peaks showed that J-resolved semiLASER at 9.4T could be a potential method to help assigning unknown peaks by understanding their J-coupling properties, although the optimal TE range for downfield MRS should be smaller as their T2 values are shorter17.Acknowledgements
This work was supported by the Horizon 2020 CDS-QUAMRI grant. The authors thank Simone Grimm, Evgeniya Kirilina, Yan Fan, Anna Stippl, Ana Herrera from Charité - Universitätsmedizin Berlin for help in this work.References
1. Lin M, Kumar A, Yang S. Two-Dimensional J-Resolved LASER and Semi-LASER Spectroscopy of Human Brain. Magn Reson Med 2014; 71(3):911-920.
2. Thomas M, Yue K, Binesh N, et al. Localized two-dimensional shift correlated MR spectroscopy of human brain. Magn Reson Med 2001; 46:58–67.
3. Andronesi O, Ramadan S, Mountford C, Sorensen A. Low-power adiabatic sequences for in vivo localized two-dimensional chemical shift correlated MR spectroscopy. Magn Reson Med 2010; 64:1542–1556.
4. Lange T, Trabesinger A, Schulte R, Dydak U, Boesiger P. Prostate spectroscopy at 3 Tesla using two-dimensional S-PRESS. Magn Reson Med 2006; 56:1220–1228.
5. Schulte R F, Lange T, Beck J, Meier D, Boesiger. Improved two-dimensional J-resolved spectroscopy. NMR Biomed 2006; 19(2): 264-270.
6. Pfrommer A, Avdievich N and Henning A (May-12-2014): Four Channel Transceiver Array for Functional Magnetic Resonance Spectroscopy in the Human Visual Cortex at 9.4 T, Joint Annual Meeting ISMRM-ESMRMB 2014, Milano, Italy.
7. Gruetter R, Tkac I. Field mapping without reference scan using asymmetric echo-planar techniques. Magn Reson Med 2000; 43(2):319-23.
8. Fuchs A, Boesiger P, Schulte RF, Henning A. ProFit revisited. Magn Reson Med. 2014; 71(2):458-68.
9. Giapitzakis IA, Nassirpour S, Avdievich N, Kreis R, Henning A. Metabolite cycled single voxel 1H spectroscopy at 9.4 T. 23rd Annual Meeting and Exhibition of ISMRM 2015.
10. Giapitzakis IA, Nassirpour S, Henning A. Short duration water suppresion using optimised flip angles (SODA) at ultra high fields.32nd Annual Scientific Meeting ESMRMB 2015.
11. Klose U. In vivo proton spectroscopy in presence of eddy currents. Magn Reson Med. 1990; 14(1):26-30.
12. Govindaraju V, Young K, Maudsley AA. Proton NMR chemical shifts and coupling constants for brain metabolites. NMR Biomed. 2000; 13(3):129-53.
13. Giapitzakis IA, Shao T, Avdievich N, Kreis R, Henning A. Metabolite cycled semi-LASER in human brain at 9.4T: In-vivo results. ISMRM Workshop on MR Spectroscopy, Lake Constance 2016.
14. Allerhand A, Thiele E. Analysis of Carr—Purcell Spin-Echo NMR Experiments on Multiple-Spin Systems. II. The Effect of Chemical Exchange. J Chem Phys. 1966; 45(3):902-16.
15. Deelchand DK, Henry PG, Marjanska M. Effect of carr-purcell refocusing pulse trains on transverse relaxation times of metabolites in rat brain at 9.4 Tesla. Magn Reson Med. 2015; 73(1):13-20.
16. Deelchand DK, Van de Moortele PF, Adriany G, Iltis I, Andersen P, Strupp JP, Vaughan JT, Ugurbil K, Henry PG. In vivo 1 H NMR spectroscopy of the human brain at 9.4 T: initial results. J Magn Reson. 2010; 206(1):74-80.
17. Fichtner ND, Henning A, Zoelch N, Boesch C, Kreis R. Eludication of the Downfield Spectrum of Human Brain at 7 T Using Multiple Inversion Recovery Delays and Echo Times. Magn Reson Med 2016.
18. Scheenen TW, Klomp DW, Wijnen JP, Heerschap A. Short echo time 1H-MRSI of the human brain at 3T with minimal chemical shift displacement errors using adiabatic refocusing pulses. Magn Reson Med. 2008; 59(1):1-6.
19. Edden RAE, Barker P B. If J doesn’t evolve, it won’t J-resolve: J-PRESS with bandwidth-limited refocusing pulses. Magn Reson Med 2011; 65(6): 1509-14.
Figures