3014
Editing of GABA at variable TEs with antiphase J-difference editing approach1Erwin L. Hahn Institute for Magnetic Resonance Imaging, Essen, Germany, 2Donders Institute for Brain, Cognition and Behaviour, Nijmegen, Netherlands
Synopsis
The most commonly used editing MRS method for measuring GABA is MEGA which works at TE=68 ms and any odd multiples thereof. Here we present a J-difference editing method which makes it possible to measure GABA signal at variable TEs independent of the effect of J-evolution by preserving the two side peaks of GABA in antiphase states at any echo time above 34ms. We also show an application of this editing technique to be measurement of T2 relaxation time of GABA in vivo.
Purpose
The most commonly used editing MRS method for measuring GABA is MEGA1. This editing method works at TE=68 ms and any odd multiples thereof. Here we present a J-difference editing method which makes it possible to measure GABA signal at variable TEs independent of the effect of J-evolution by preserving the two side peaks of GABA in antiphase states at any echo time above 34ms.Methods
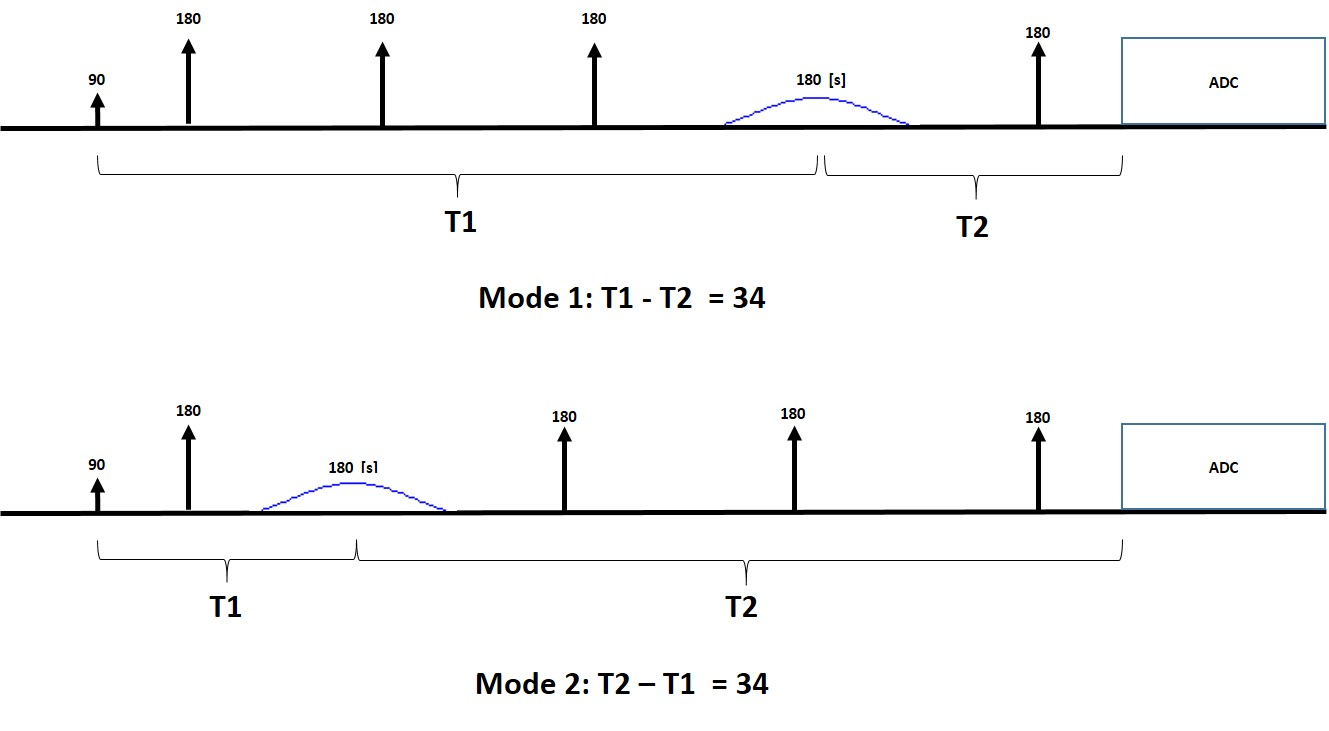
The antiphase editing sequence is shown in Figure1 which involves two interleaved modes, Mode1 and Mode2. A single narrow bandwidth Gaussian pulse is used for editing. As shown in Figure1, the timing conditions for Mode1 is T1-T2 = 34ms=1/4J and the condition for Mode2 is T2–T1=34ms=1/4J ms. By having these two timing conditions at any TE, the two side peaks of GABA will be in antiphase state relative to the central peak (90 and -90 degrees out of phase relative to the central peak). The difference between the two modes would be that the phase of the two side peaks will be reversed relative to each other. Therefore, taking the difference of the two modes will remove central peak and the two side peaks will be doubled. Compared to the MEGA method where the two side peaks are in phase in both ON and OFF modes, in antiphase editing method, the two side peaks are 180 degrees out of phase relative to each other. The antiphase technique is only viable because the separation of the two sidepeaks is 15Hz, so for commonly encountered shim conditions where the linewidth is comparable to or narrower than the separation of the sidepeaks, the signal cancellation can be acceptable. The antiphase editing sequence was implemented in a sLASER sequence using a single Gaussian pulse with duration of 15ms and bandwidth of 120Hz. Phantom and in vivo scans were performed on a 7T system (Magnetom 7T, SIEMENS Healthcare GmbH, Germany) with 32 channel Rx and 1 channel Tx head coil (Nova Medical, NY). The editing performance of the sequence was first tested on a 30 mMol GABA phantom at six different TEs of 77,87,97,107,117 and 127ms. In vivo data were then acquired from one healthy subject who participated with ethical approval from institutional ethics committee. Anatomical reference was acquired using 3D MPRAGE. B0 shimming was performed using FASTESTMAP2. Single voxel MRS data were collected at TEs = 77,87,97,107,117and 127ms from 20x20x20 mm3 voxel positioned at occipital region using antiphase editing sequence. Data were analyzed using JMRUI software3 and MATLAB4.Results
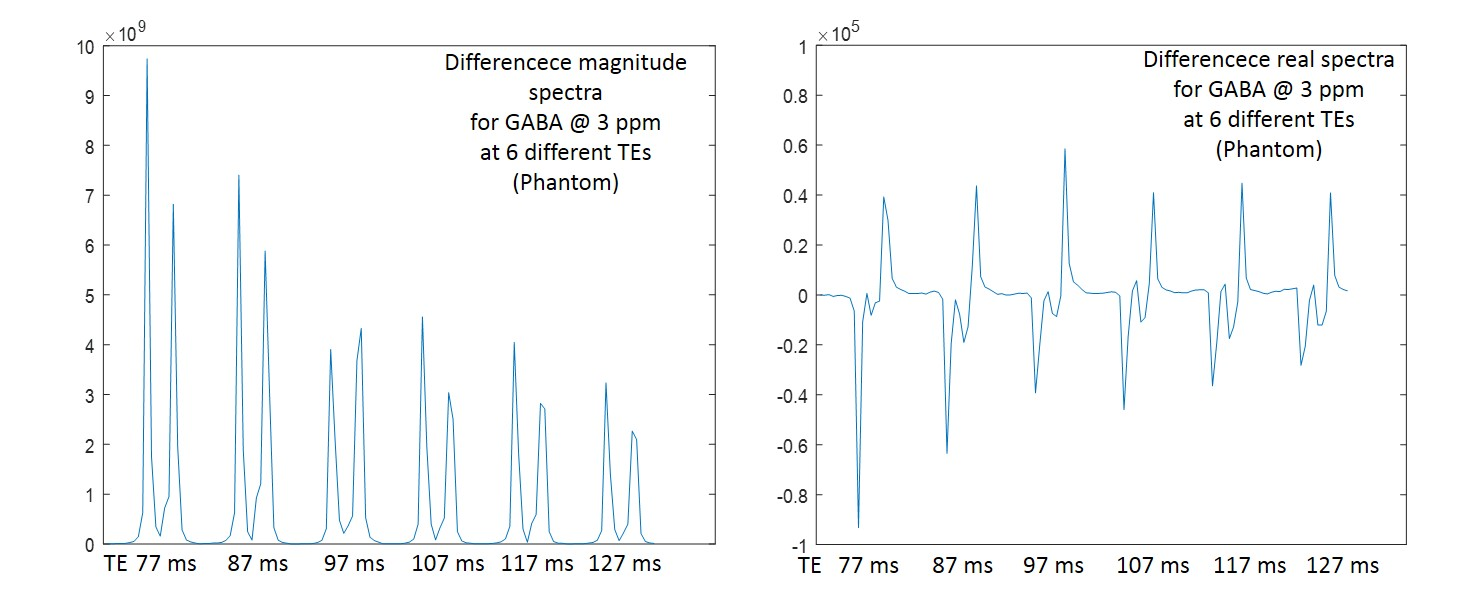
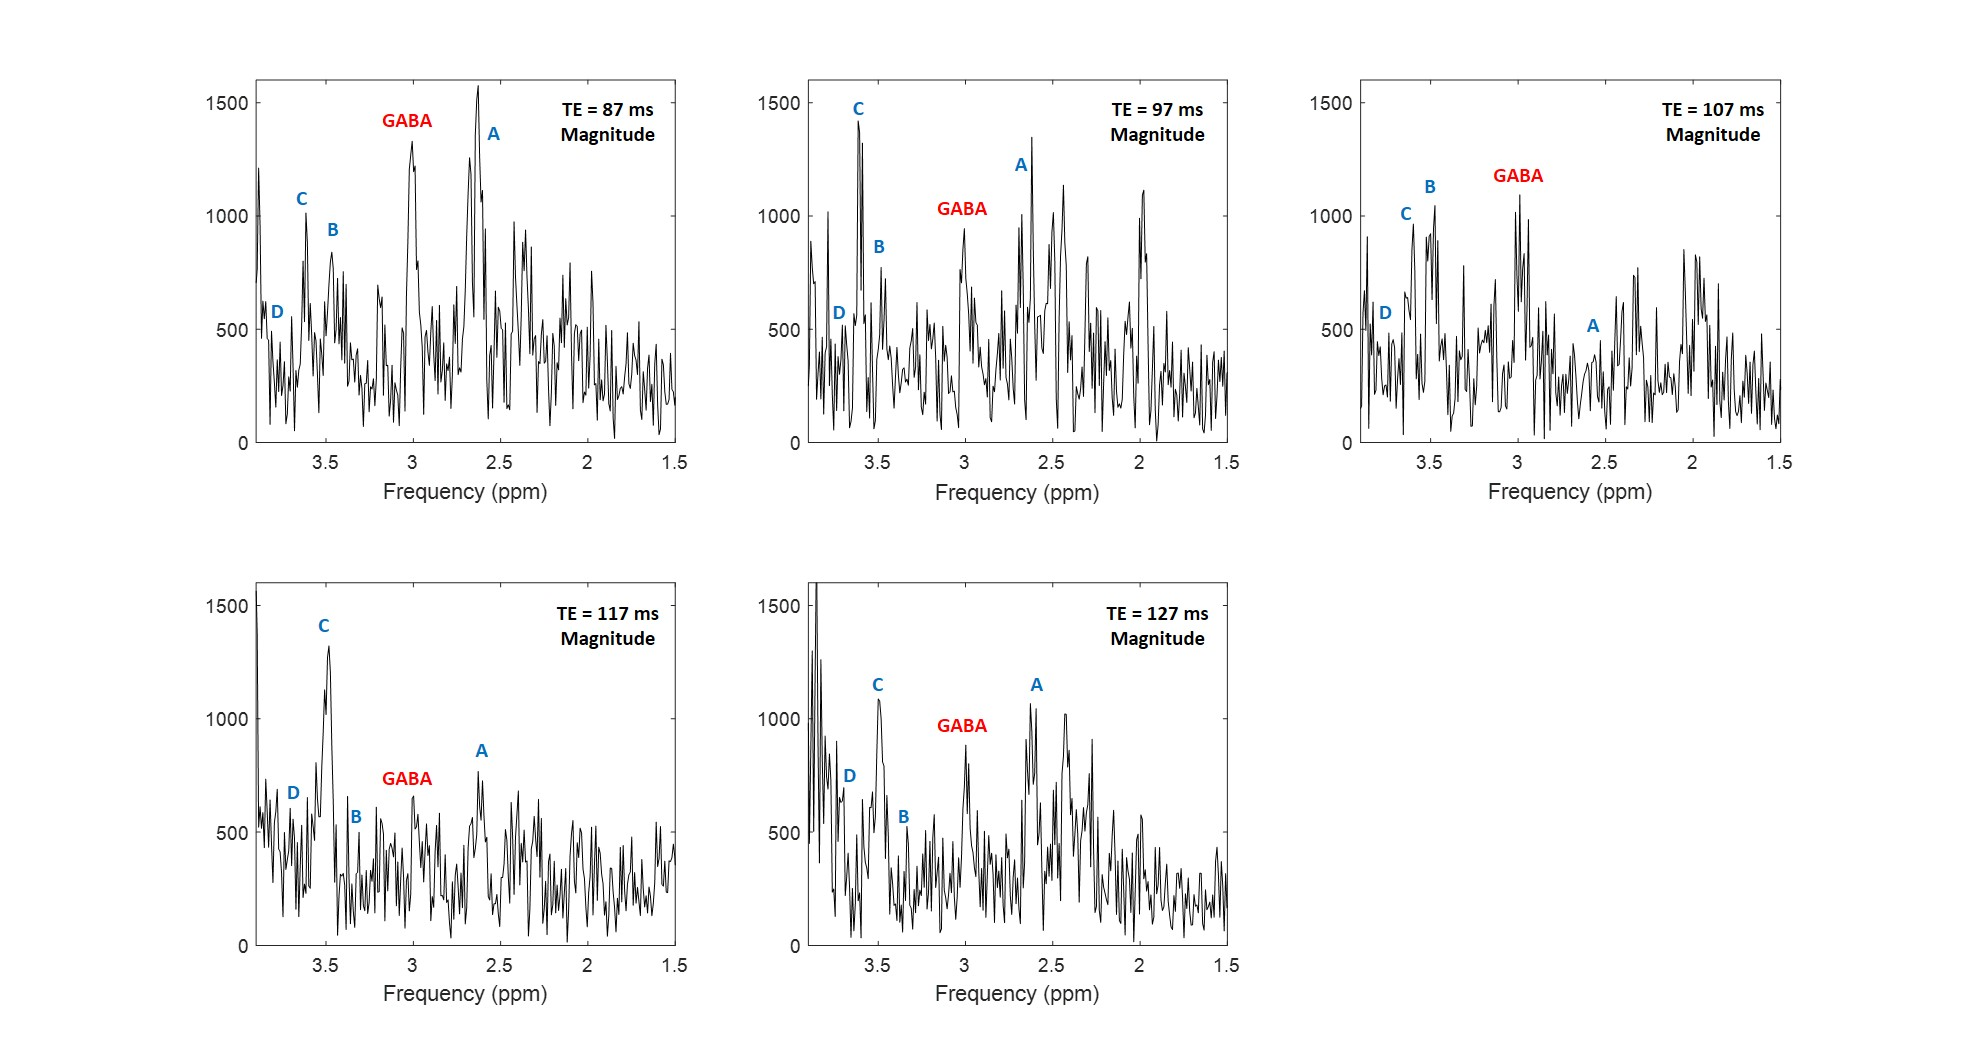
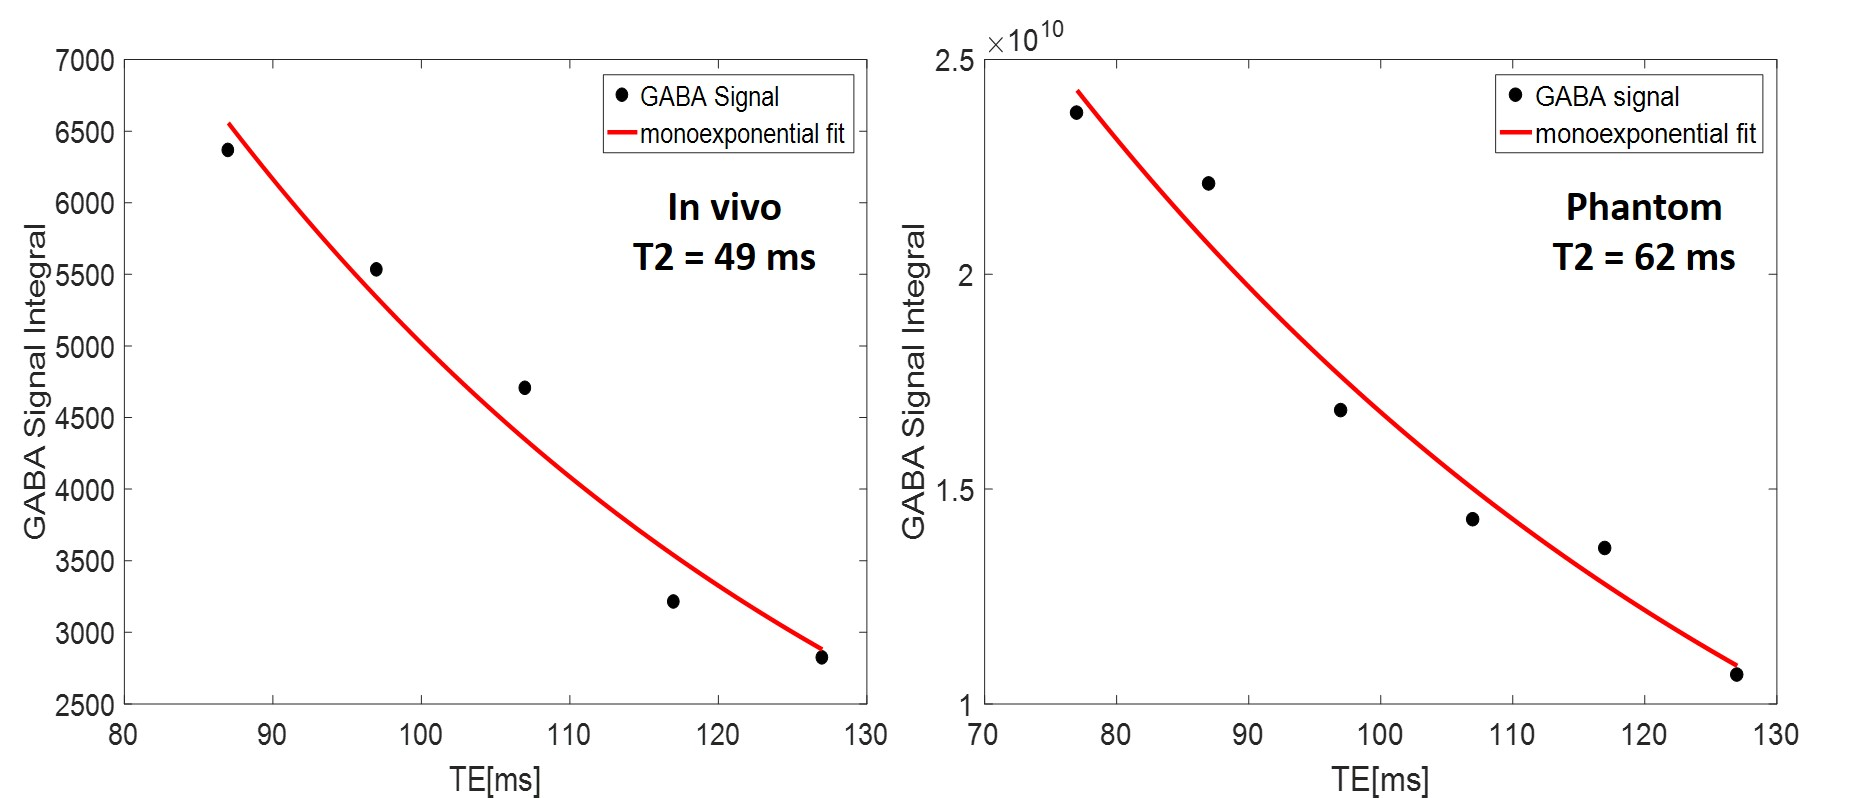
Figure2 shows acquired difference spectra from phantom at 6 different TEs. It shows the two side peaks of GABA being in antiphase state independent of TE demonstrated in the real spectra and decay of GABA signal and elimination of the central peak demonstrated in the magnitude spectra. For in vivo scan, while no GABA signal was observed in the difference spectrum at TE=77 ms, results at other five TEs are shown in Figure3. GABA at 3 ppm is indicated in the spectra in this figure. In addition to GABA, there are some other coedited peaks observable in the difference spectra indicated with letters A-D in each resultant spectrum. Figure4 shows T2 relaxation time of GABA in phantom and in vivo calculated by mono-exponential fitting to be 62 ms and 49 ms respectively.Discussion
The editing method we present here measures GABA signal independent of the effect of J evolution. The antiphase editing method brings the danger of the two signals canceling each other if they are closer than the linewidth. For GABA, the two side peaks are around 15 Hz away from each other, but the method is not useful for editing metabolites like lactate where the side peaks are just 7 Hz away or for J coupled metabolites with doublet of doublet pattern. For instance, a characteristic of antiphase difference spectrum compared to standard MEGA spectrum is the absence of Glx at 3.75 ppm indicated in Figure3 as D which is because Glutamate being doublet of doublet. In addition to GABA there are some coedited signals observable in the antiphase editing difference spectrum indicated as A,B, and C in Figure3 which do not show up in the MEGA technique.Conclusion
The antiphase editing method provides the possibility of measuring GABA at variable TEs independent of the effect of J evolution on signal intensity and hence provides the possibility of measuring T2 relaxation time of GABA as an application.Acknowledgements
This work was funded by the Helmholtz Alliance ICEMED – Imaging and Curing Environmental Metabolic Diseases, through the Initiative and Networking Fund of the Helmholtz Association.References
1. Mescher M, et al. Simultaneous in vivo spectral editing and water suppression. NMR Biomed. 1998;11(6):266-72.
2. Gruetter R, Tkác I. Field mapping without reference scan using asymmetric echo-planar techniques. Magn Reson Med. 2000;43(2):319-23
3. Naressi A, et al. Java-based graphical user interface for the MRUI quantitation package. MAGMA. 2001;12(2-3):141-52.
4. MATLAB Release 2016b, The MathWorks, Inc., Natick, Massachusetts, United States.
Figures