3011
Dual spectral analysis for metabolite quantification in the presence of lipids and macromolecules1Imperial College London, London, United Kingdom, 2Imperial College Healthcare NHS Trust, London, United Kingdom, 3Medical Physics & Bioengineering, University College London Hospitals NHS Trust, London, United Kingdom
Synopsis
In this study, we aim to reduce the bias inherent in fitting short echo time spectra by performing a two-point saturation recovery experiment. At both points lipid and macromolecule magnetisation is excited from an approximately fully relaxed state and so this signal component is unchanged, thus the fitting model can be constrained. We show that this may be an advantageous strategy in comparison to other common techniques, reducing bias where fitting spectra with narrow linewidths.
Purpose
Fitting metabolite amplitudes in
1H MRS accurately in the presence of broad lipid/macromolecular (LipMM) signals
is challenging1,2,3. Techniques
to obtain metabolite nulled spectra can address this issue4,5 but
are typically lengthy and not readily available on clinical systems. In relatively short TR 1H specta (TR=1500ms) LipMM
signals are approximately fully relaxed6. If a second spectrum is
acquired with a longer TR, metabolite signals with longer T1s will increase but
LipMM signals will be unchanged. By applying this constraint to LipMM signals
in a two-point saturation recovery experiment, the robustness of metabolite
signal estimation may be improved. In this study we implement this analysis
technique, and examine the performance using simulated spectra with varying global
spectral SNR and linewidth.Methods
TARQUIN7,8 (version 4.3.9) source code was modified to allow simultaneous analysis of two spectra and to fit the results to a saturation recovery curve to yield fully relaxed signal ($$$a_i$$$) for each component of the basis set. The TARQUIN signal equation was modified to include a saturation recovery term ($$$r_{i,TR}$$$) and global frequency shift ($$$\triangle{\omega_{TR}}$$$) as follows:
$$\sum_{i=1}^M{a_{i}r_{i,TR}S_{i}\exp{(j.\Delta\omega_{TR}t)}}$$
where $$$S_i$$$ is the $$$i$$$th basis vector with a Voigt lineshape. The $$$r_{i,TR}$$$ term modifies the amplitude of $$$S_i$$$ for incomplete longitudinal signal recovery. For the STEAM sequence (assuming steady state and a 90 degree excitation pulse) this is:
$$r_{i,TR}=1-\exp(-\frac{TR-TM-{TE}/2}{T1_i})$$
The two spectra being analysed simultaneously are aligned using $$$\Delta\omega_{TR}$$$, which is optimised during fitting. All existing soft constraints on relative signal amplitudes were removed. Basis signals for LipMM species were set with a fixed T1i of 300ms (such that $$$r_{i,TR}\approx$$$ 1); a soft constraint was applied to all other components, setting each T1i to be in the range 300-4000ms.
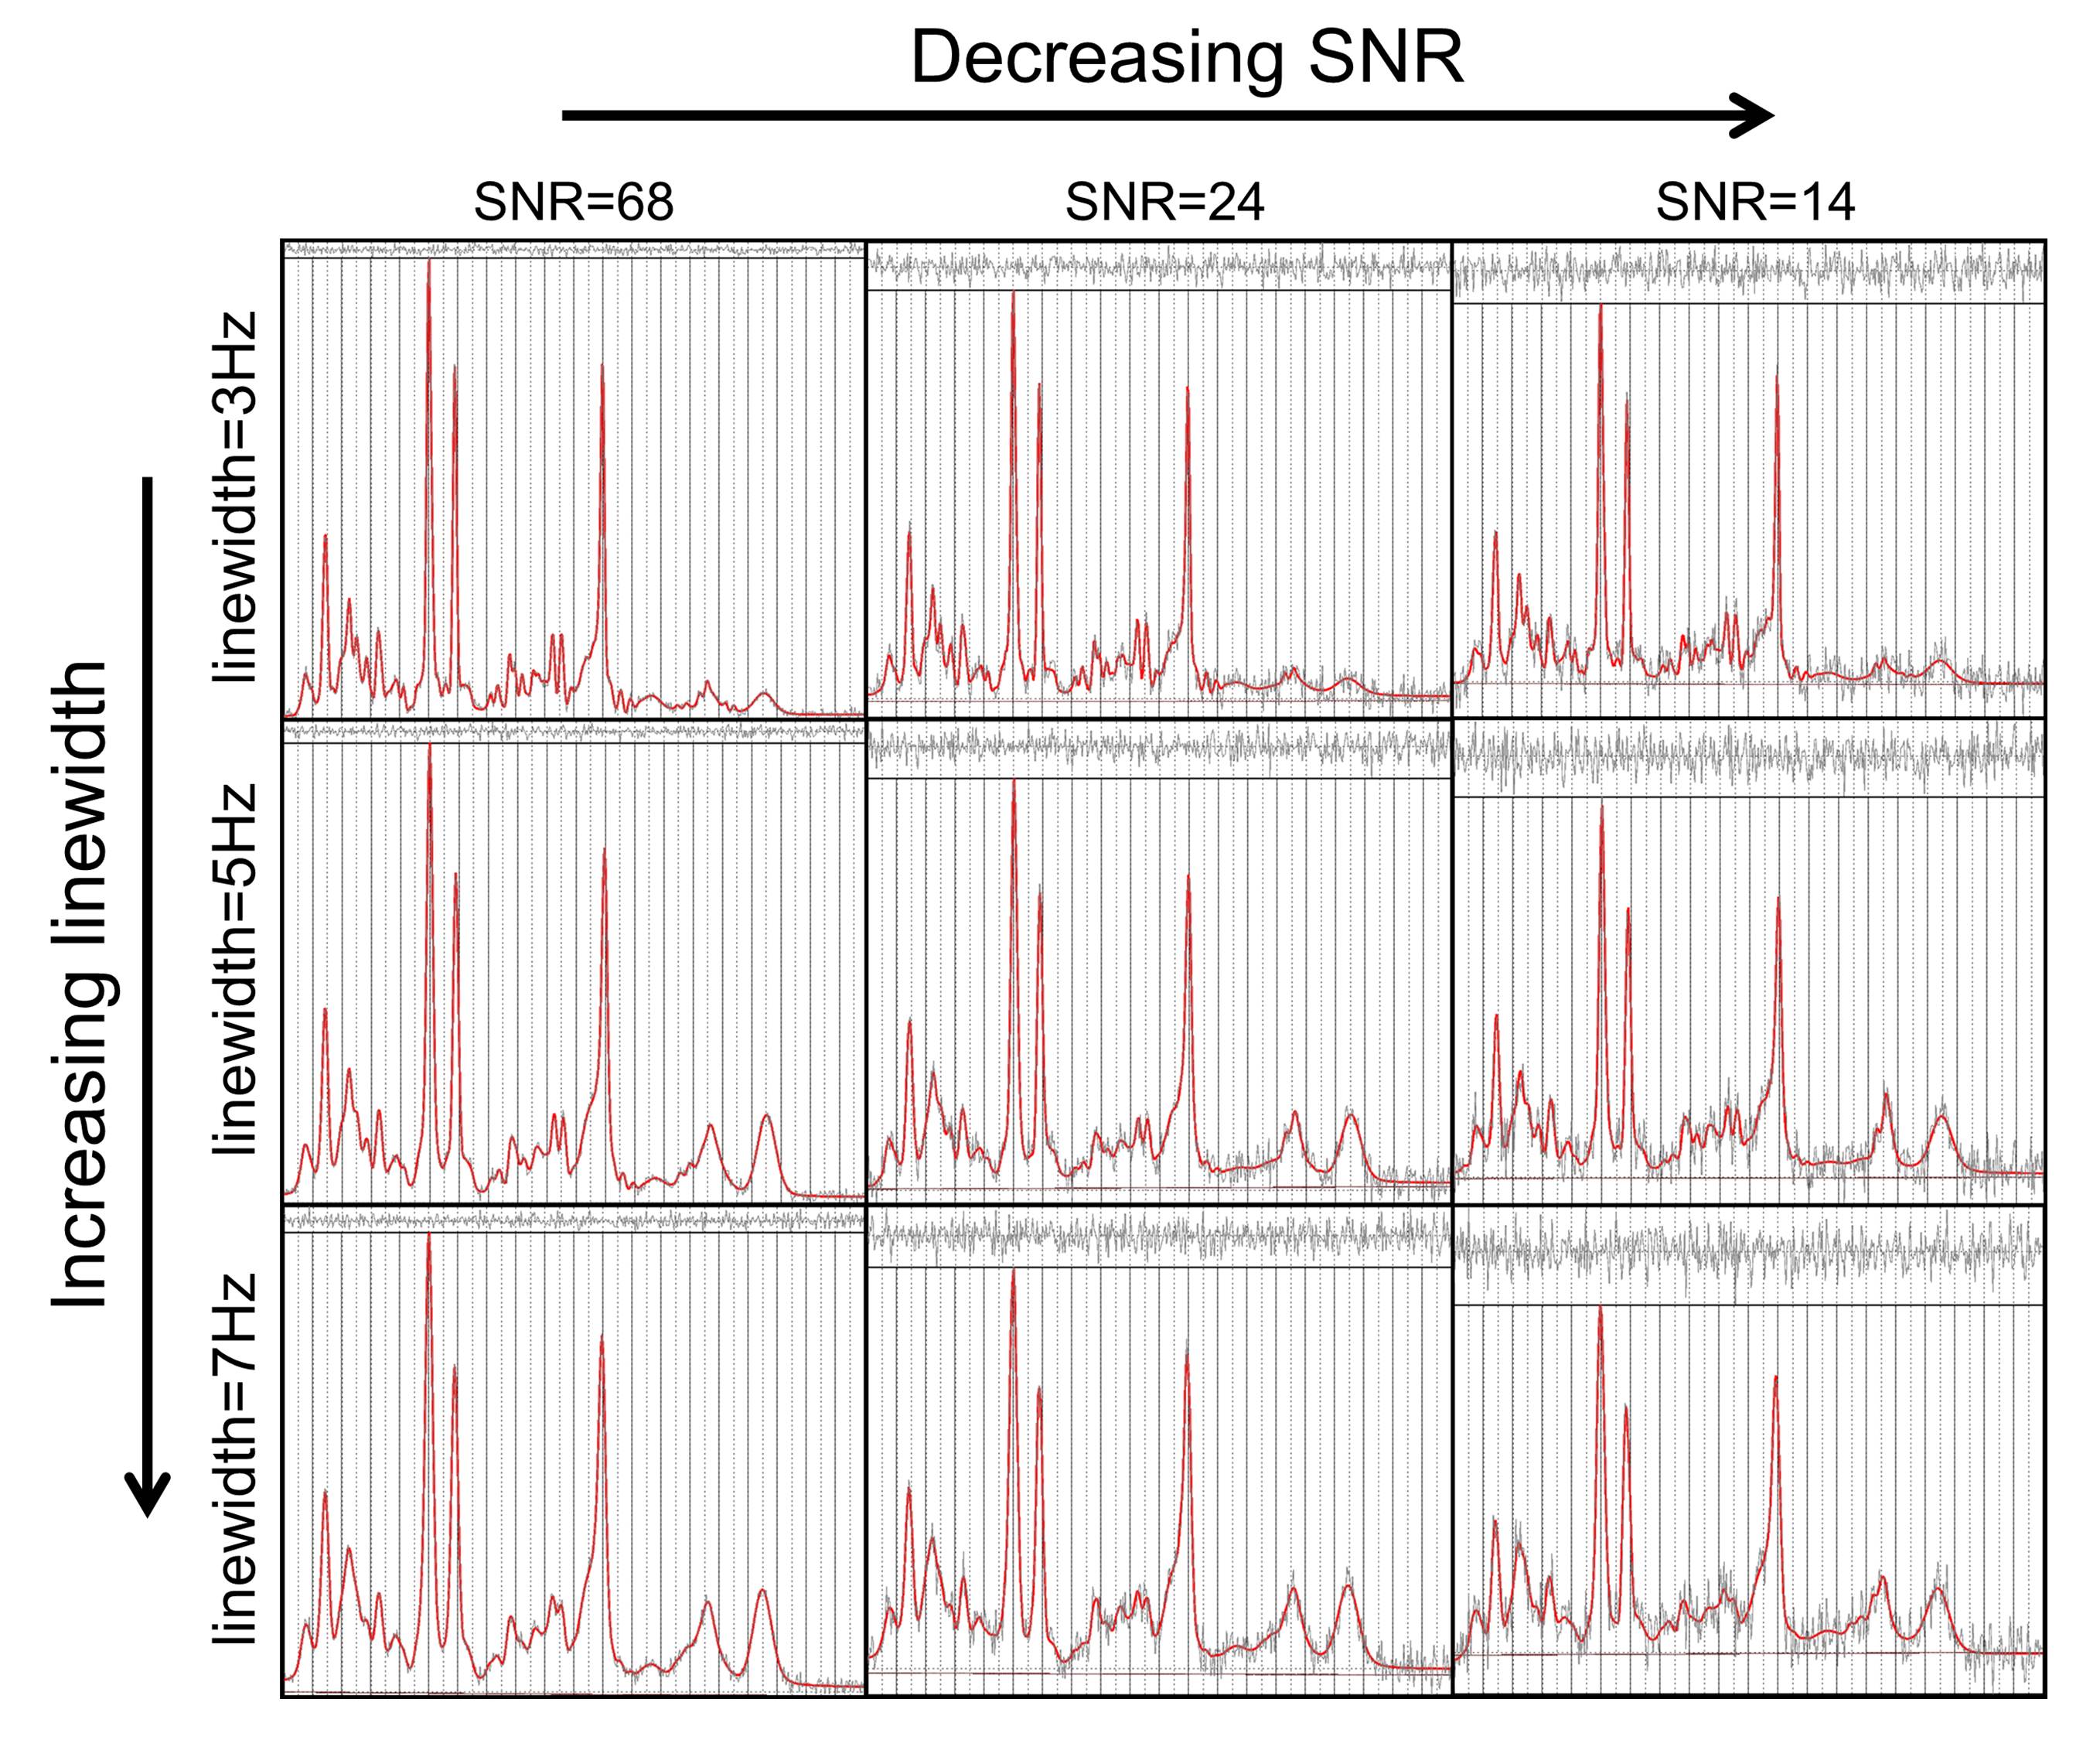
Spectra were simulated with the typical appearance of brain spectra for two STEAM acquisitions at 3 Tesla (TR = 1500ms and 5000ms, TM = 20ms, TE = 20ms) using the VeSPA Simulation package9 (version 0.9.3) and MATLAB (version 2013b). Metabolite T1s were varied in the range 400-3000ms with LipMM T1 fixed at 300ms. The baseline SNR for a fully longitudinally relaxed spectrum was set at 68, 24, or 14 and spectral linewidths at either 3Hz, 5Hz, or 7Hz. Spectra at the two TRs were analysed simultaneously using TARQUIN as described. Spectra were also analysed individually using standard TARQUIN (version 4.3.9) or LCModel10 (version 6.3-1J), with metabolite amplitudes fitted post hoc to a saturation recovery curve. In the case of grouped metabolites (tNAA=NAA+NAAG, tCr=Cr+PCr or Glx=Glu+Gln) in the post hoc fitting, a single T1 was assumed. Additionally, a fixed relaxation correction (assumed T1=1700ms) was used to estimate metabolite amplitudes using the LCModel result at the longer TR only.
Results
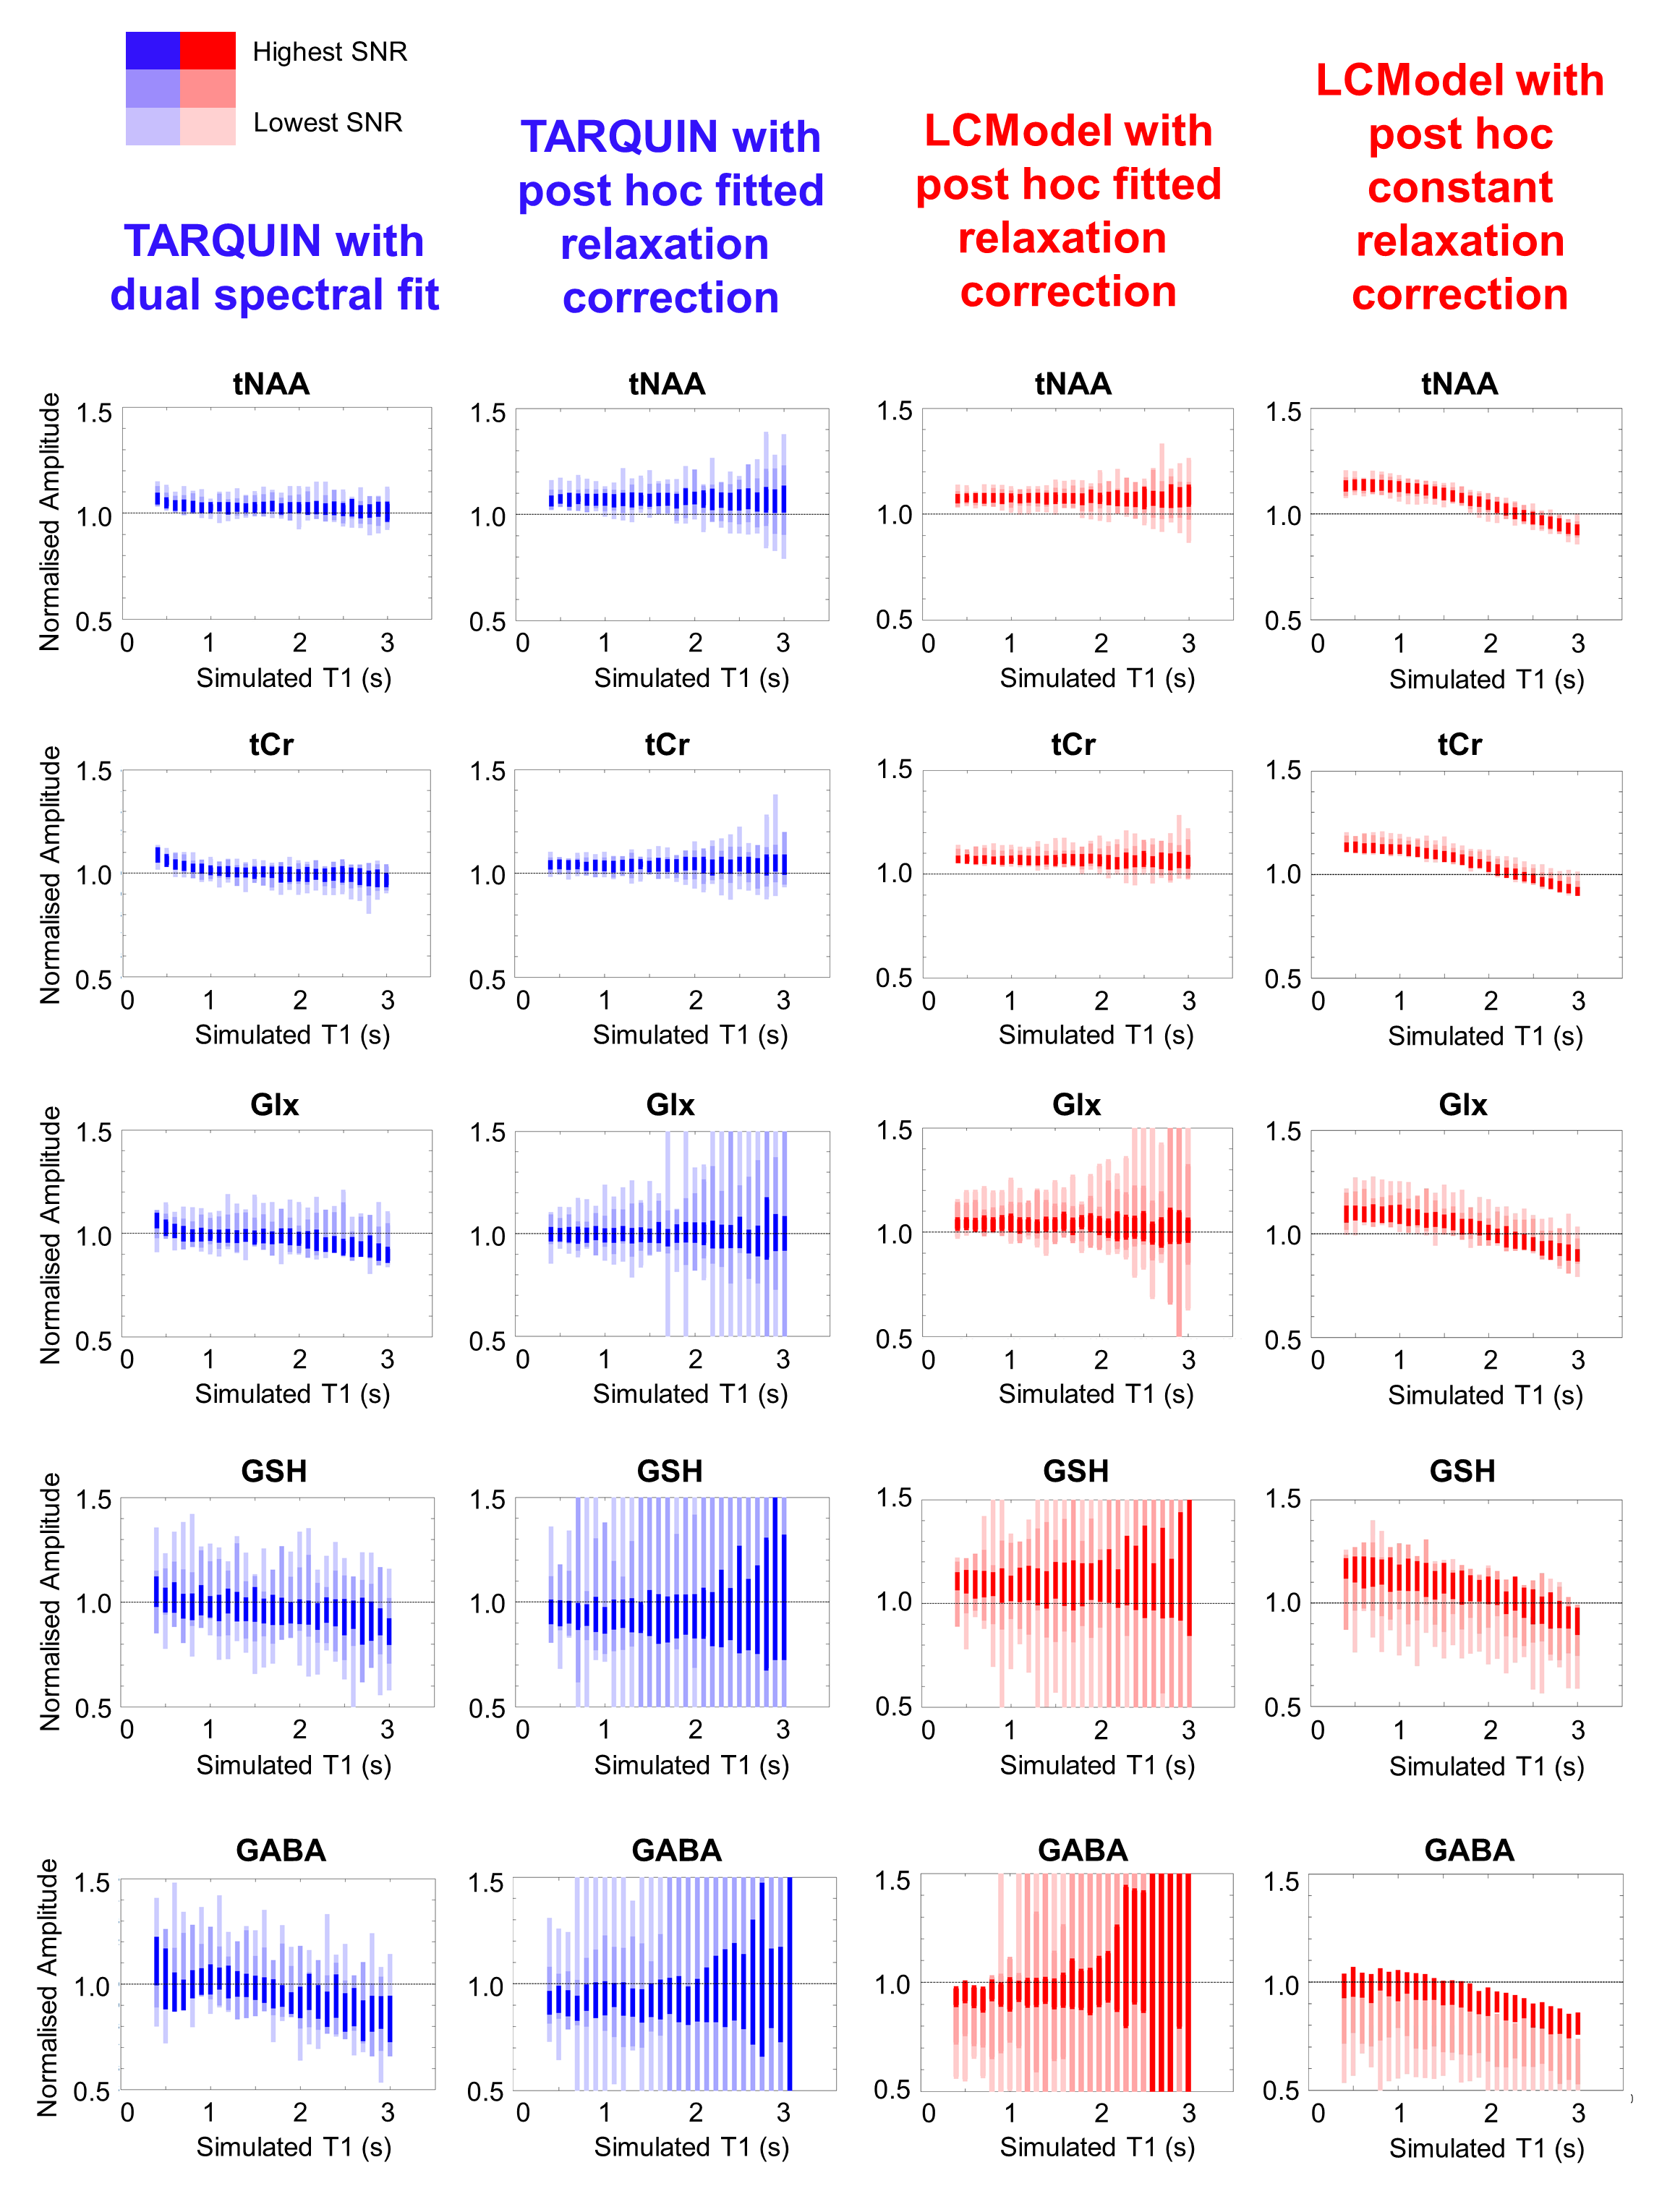
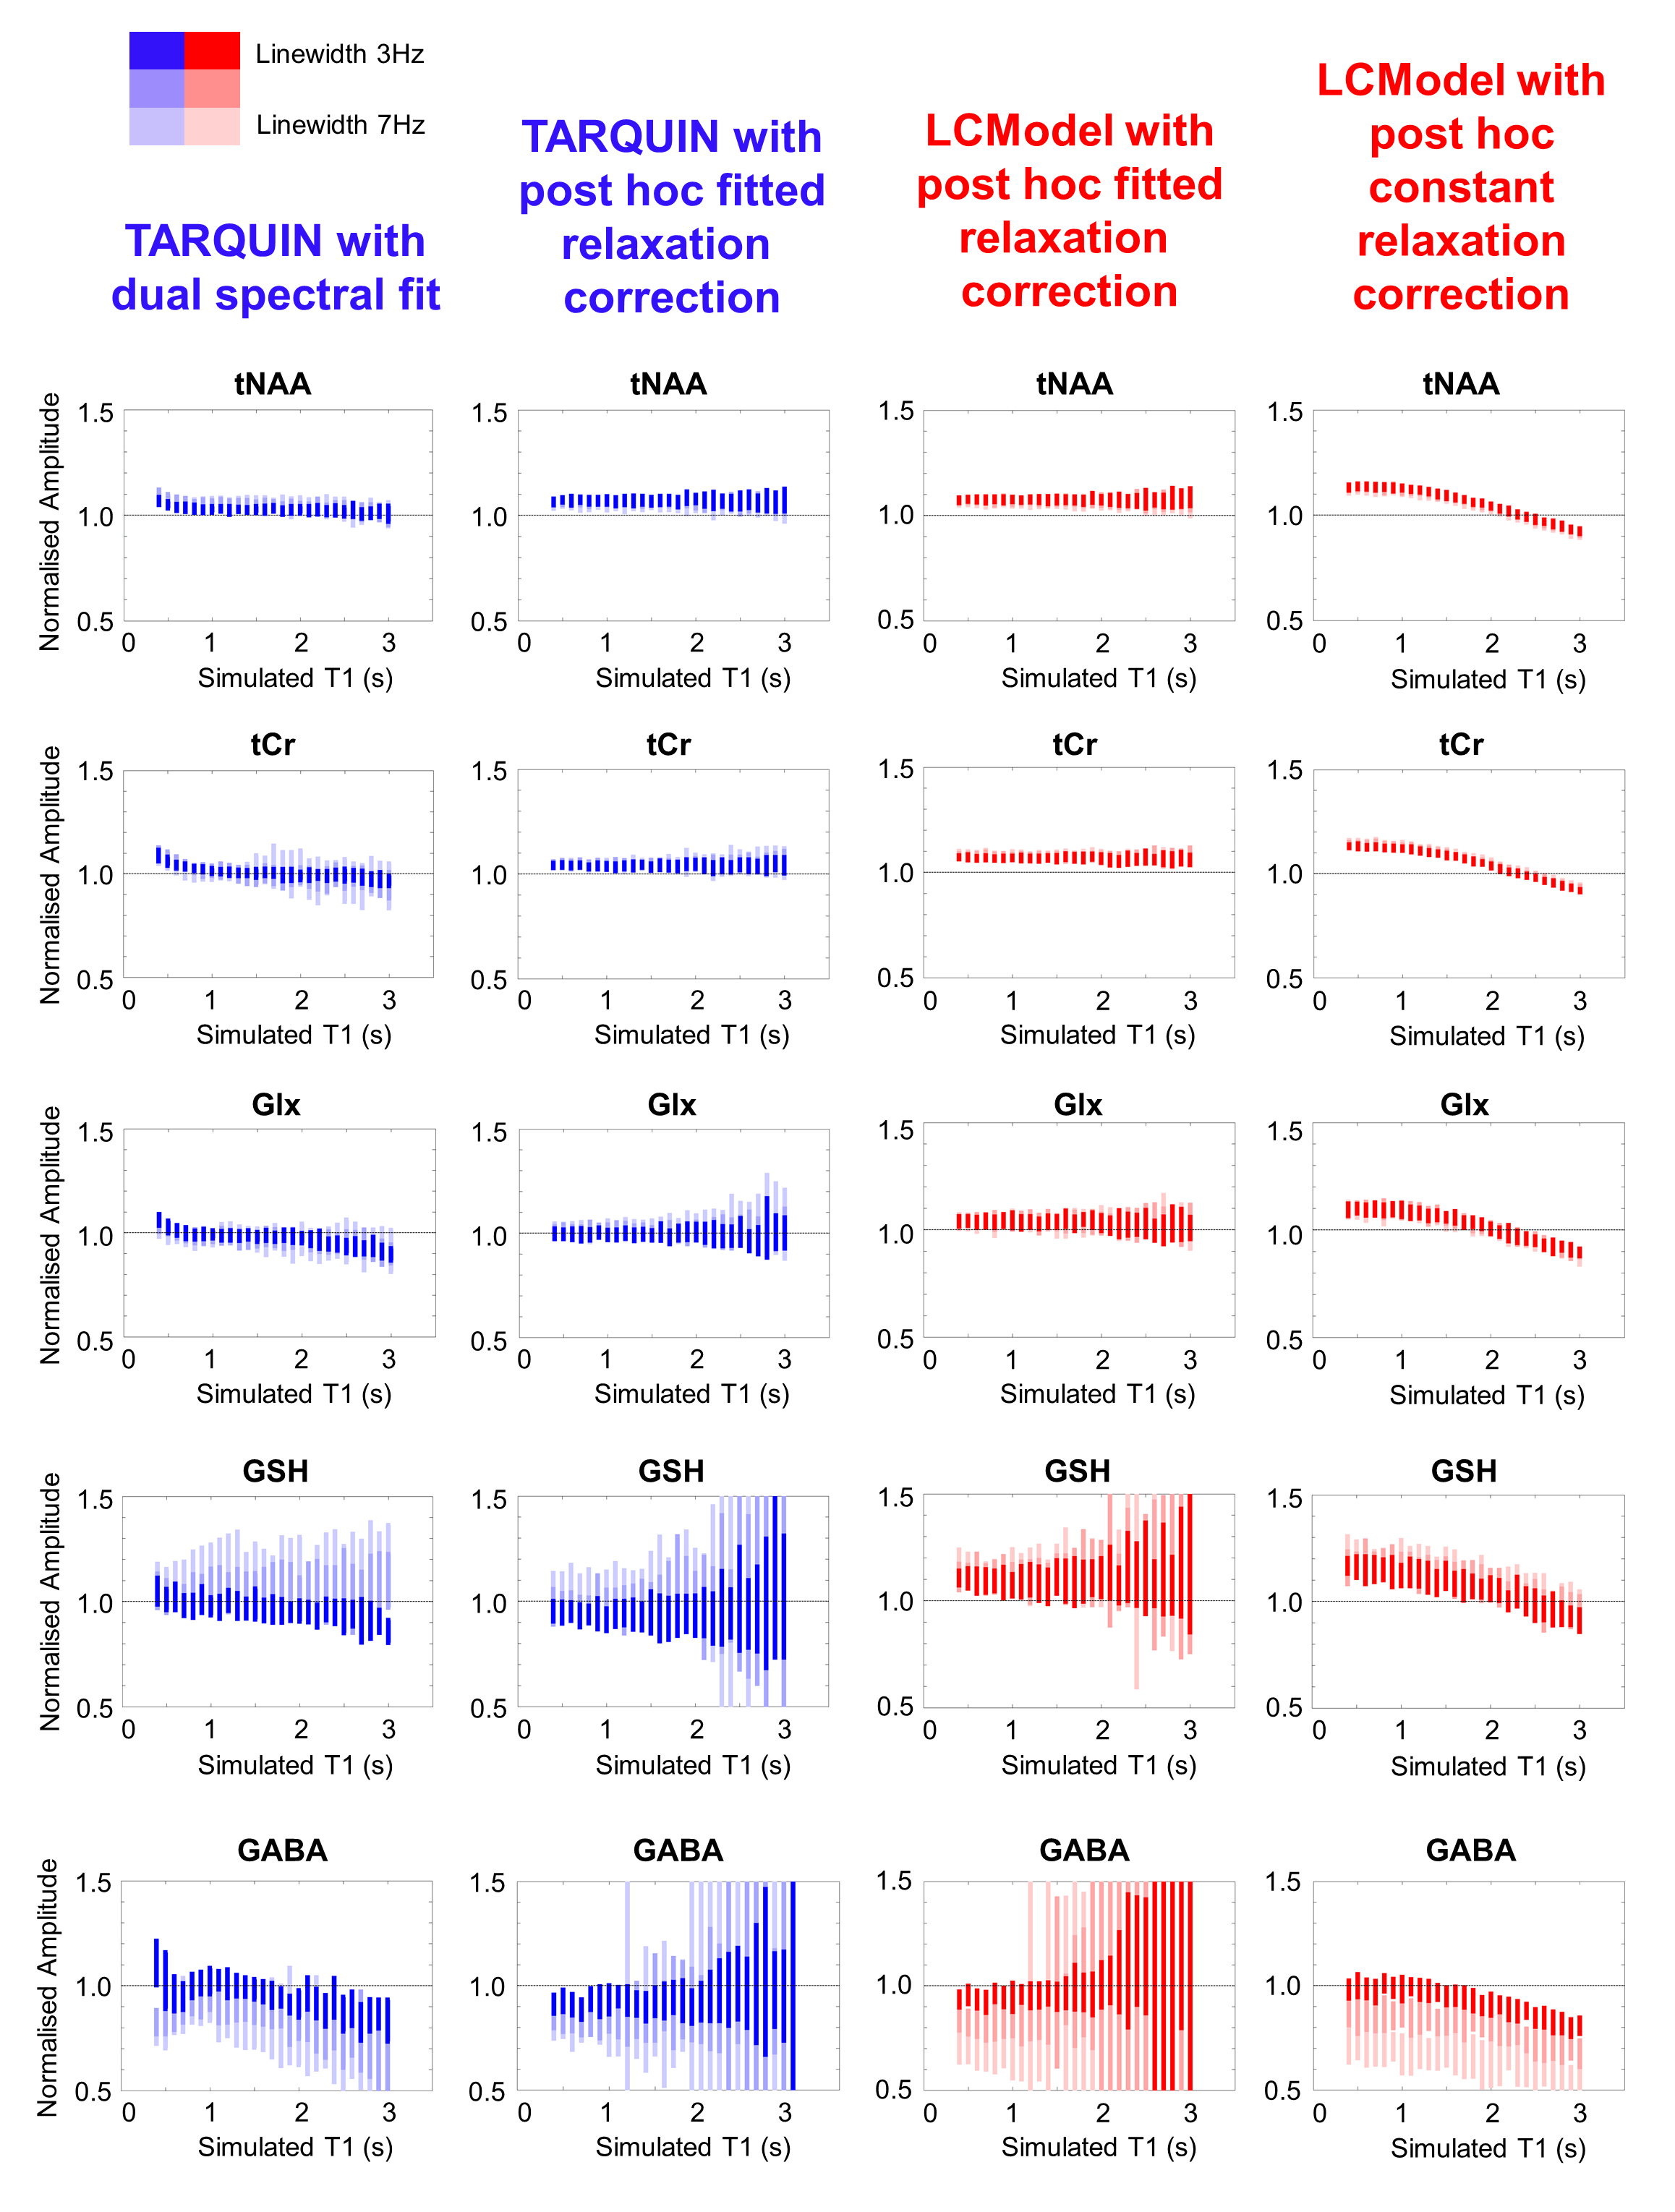
Typical simulated spectra are shown in Figure 1. Fitted metabolite amplitudes, normalised to the simulated amplitudes, are plotted against simulated metabolite T1 in Figure 2 (for varying SNR) and Figure 3 (for varying linewidth), with TARQUIN results in blue and LCModel results in red.Discussion
Simultaneous dual spectral analysis with TARQUIN produced metabolite amplitudes closest to the simulated amplitudes when the T1 was in the physiological range (Figure 2 – leftmost column). For very short T1 (<1000ms), this method overestimates the amplitude of all metabolites, presumably because LipMM signals are included in the metabolite fit. With decreasing SNR and a linewidth of 3Hz, variance increases but is consistently clustered around the ground truth.
Metabolite amplitudes from LCModel or standard TARQUIN with saturation recovery fitting (Figure 2 – centre columns) are more independent of simulated T1 for the most prominent metabolites (i.e. tNAA and tCr), but are consistently overestimated. Estimated GABA and GSH signal amplitudes are especially sensitive to low SNR, due to the magnification of errors during the saturation recovery fit.
Applying a fixed relaxation correction (Figure 2 – rightmost column) results in a characteristic bias across the range of simulated metabolite T1s.
Increasing the simulated linewidth from 3 Hz to 7Hz (Figure 3), increases the variance in the metabolite amplitudes fitted with the dual spectral TARQUIN method, but estimations for prominent peaks (tNAA, tCr) are still good. Standard individual LCModel or TARQUIN fitting is relatively insensitive to linewidth changes for tNAA, tCr and Glx metabolites, but GABA and GSH are more strongly biased.
Conclusion
Simultaneously fitting two spectra, whilst assuming fully relaxed lipid/macromolecule signals, helps to improve metabolite quantification. This is most effective where the acquired spectra have sharp linewidths.Acknowledgements
Thanks to M Wilson for useful discussions. PL is supported by a National Institute for Health Research Healthcare Science Doctoral Fellowship (HCS DRF-2014-05-013)References
1. Tkác, I et al (2002) “On the Quantification of low Concentration Metabolites by 1H NMR Spectroscopy in the Human Brain at 7 Tesla.” Proc. Intl. Soc. Mag. Reson. Med. 12:528
2. Kreis, R (2003) "Bad Spectra Can Be Better Than Good Spectra." Proc. Intl. Soc. Mag. Reson. Med. 11: 264.
3. Near, J (2014) "Investigating the effect of spectral linewidth on metabolite measurement bias in short-TE MRS." Proc. Intl. Soc. Mag. Reson. Med. 22: 2915.
4. Knight-Scott, J (1999) “Application of multiple inversion recovery for suppression of macromolecule resonances in short echo time 1H NMR spectroscopy of human brain” J Magn Reson 140(1):228-34
5. Kassem, M and Bartha, R (2003) “Quantitative proton short-echo-time LASER spectroscopy of normal human white matter and hippocampus at 4 Tesla incorporating macromolecule subtraction.” Magn Reson Med 49(5):918-927
6. Behar, K et al (1994) “Analysis of macromolecule resonances in 1H NMR spectra of human brain” Magn Reson Med 32(3):294-302
7. Reynolds, G et al (2006) “An algorithm for the automated quantitation of metabolites in in vitro NMR signals.” Magn Reson Med 56(6):1211-9
8. Wilson, M et al (2011) “A constrained least-squares approach to the automated quantitation of in vivo ¹H magnetic resonance spectroscopy data.” Magn Reson Med 65(1):1-12
9. Soher, BJ et al (2011) “VeSPA: Integrated applications for RF pulse design, spectral simulation and MRS data analysis.” Proc. Intl. Soc. Mag. Reson. Med. 19:1410.
10. Provencher, S (2001) “Automatic quantitation of localized in vivo 1H spectra with LCModel.” NMR Biomed 14(4):260-4
Figures