3009
Investigation of the brain energy metabolism by simultaneous detection of lactate and β-hydroxybutyrate using MEGA-sLASER1Department of Radiology, Medical Physics, University Medical Center Freiburg, Freiburg, Germany
Synopsis
For the detection and quantification of lactate (Lac) and β-hydroxybutyrate (bHB) via 1H-MRS, difference editing methods such as MEGA-PRESS have been proposed. Since MEGA-PRESS suffers from substantial signal loss due to large chemical shift displacement, we propose MEGA-sLASER for simultaneous detection of the two metabolites at 3T. It is demonstrated that the signal-to-noise ratio of the target resonances in the difference spectrum is increased by a factor of two compared to MEGA-PRESS and that quantification accuracy can thus be substantially improved, enabling the robust detection of Lac and bHB in healthy brain.
Purpose
Lactate
as a marker of anaerobic glycolysis and β-hydroxybutyrate
(bHB) (ketone body) as an alternative substrate under fasting
conditions are important MR-visible biomarkers for the energy
metabolism of the human brain. Since detection and quantification via
1H-MRS are strongly hampered by overlap with macromolecular (MM)
resonances, difference editing has been
proposed for lactate [1,2] and bHB [3,4]
detection. However, the most widely used difference editing method
MEGA-PRESS [5] suffers from substantial signal loss due to large
chemical shift displacement. At 7T,
MEGA-sLASER has been proposed as a viable remedy for lactate
detection [6].
In
this work, we show that the Lac and bHB can
be simultaneously detected using MEGA-sLASER and that their
quantification can be significantly improved compared to MEGA-PRESS
at a clinical field strength of 3T.Methods
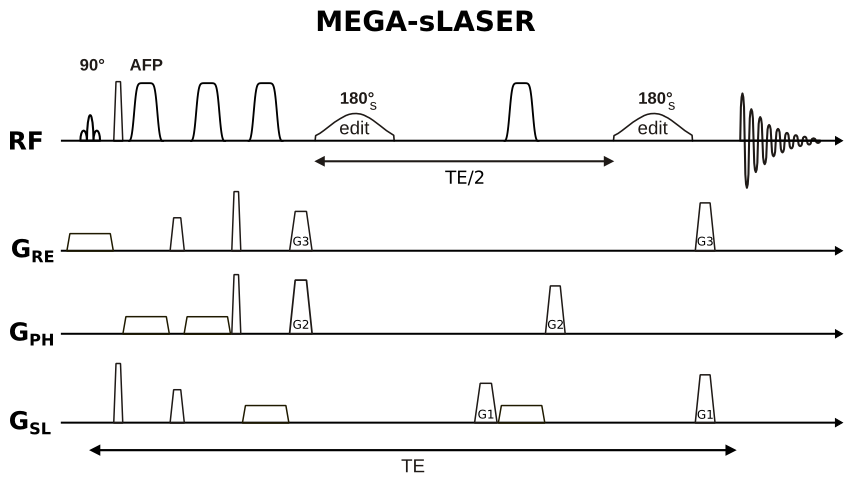
Experiments were performed on a 3T Prisma MR system (Siemens Healthineers, Germany) using a 64-channel receiver head coil. A single-voxel MEGA-sLASER sequence was implemented with two pairs of adiabatic hyperbolic secant pulses for slice-selective refocusing (bandwidth: 5 kHz) and two Hanning-filtered Gaussian editing pulses (bandwidth: 49 Hz) for J-refocusing (Fig. 1). The target resonances for J-editing of Lac and bHB were the two methyl groups at 1.31 ppm and 1.19 ppm, respectively. Both methyl groups are coupled to methine protons resonating at 4.1 ppm (Lac) and 4.13 ppm (bHB), with coupling constants of JLac = 6.9 ppm and JbHB = 6.3 ppm. For simultaneous editing of both metabolites the editing pulses were irradiated at 4.13 ppm and an echo time of 148 ms was chosen, as previously proposed by Pan et al. [3,4]. The edited ("ON") and unedited ("OFF") shots were acquired in an interleaved fashion and for the OFF shots the editing pulse was irradiated at 5.27 ppm.
MEGA-sLASER was compared with a MEGA-PRESS sequence [5] based on slice-selective Mao refocusing pulses (bandwidth: 1 kHz) performing simulations as well as in vitro and in vivo measurements and using the same echo time and editing pulse for the two methods.
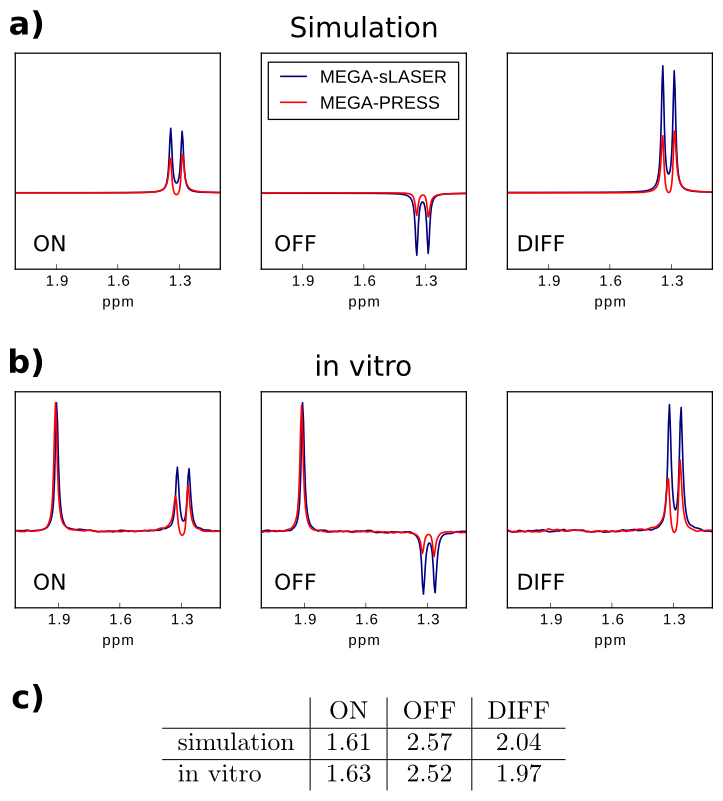
Spatially resolved MEGA-sLASER and MEGA-PRESS simulations were conducted utilizing the pyGAMMA library and incorporating shaped radiofrequency waveforms of slice-selective and frequency-selective refocusing pulses as applied by the scanner. Complete metabolite basis sets for LCModel quantification of the acquired in vivo spectra were simulated.
Experimental: Sequence validation was performed through MEGA-sLASER and MEGA-PRESS measurements in a phantom solution containing Lac and acetate as well as in the occipital cortex of three healthy subjects. In one of the subjects the measurements were repeated during a ketogenic (low carbohydrate) diet. For the in vivo experiments, 1024 spectral averages were acquired, amounting to a scan time of 25.6 min.
Quantification: Lac and bHB were quantified as concentrations ratios to creatine through LCModel fitting. While the Lac and bHB signals were measured in the difference ("DIFF") spectra, the creatine signal was quantified from the corresponding OFF shot
Result
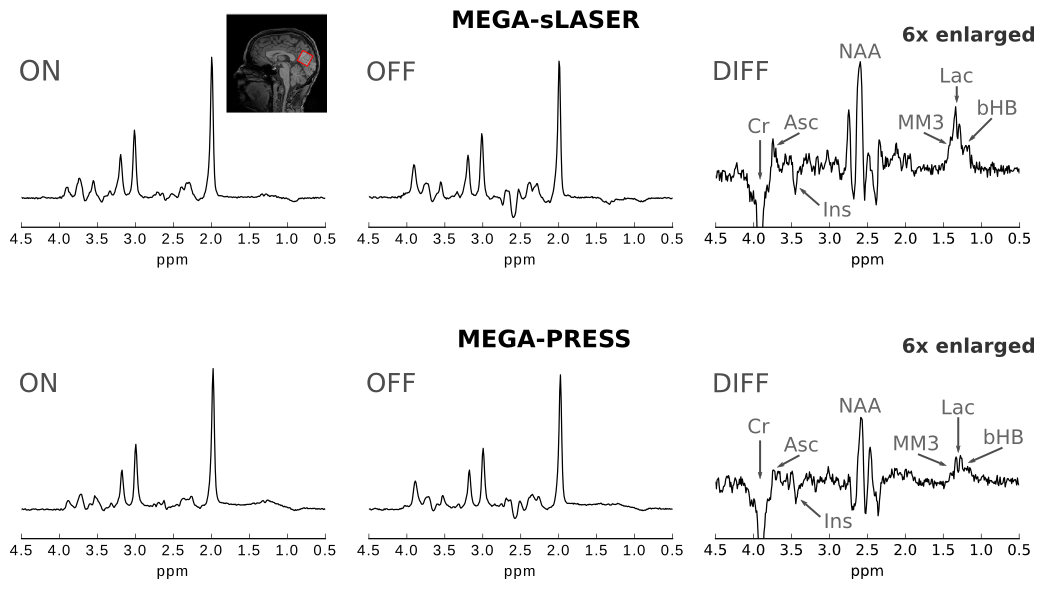
Simulated spectra and phantom spectra were in good agreement and demonstrated the CSDA-induced signal loss in the MEGA-PRESS experiments (Fig. 2). Lactate quantification on the simulated as well as acquired data yielded a twice as large signal in the MEGA-sLASER difference spectra compared to MEGA-PRESS. Exemplary in vivo MEGA-sLASER and MEGA-PRESS spectra are shown in Fig. 3. Apart from Lac and bHB resonances, the difference spectra contain coedited peaks from N-acetylaspartate, creatine, myo-inositol, and ascorbate. Furthermore, at 1.43 ppm, a coedited macromolecular resonance (MM3) could be identified.
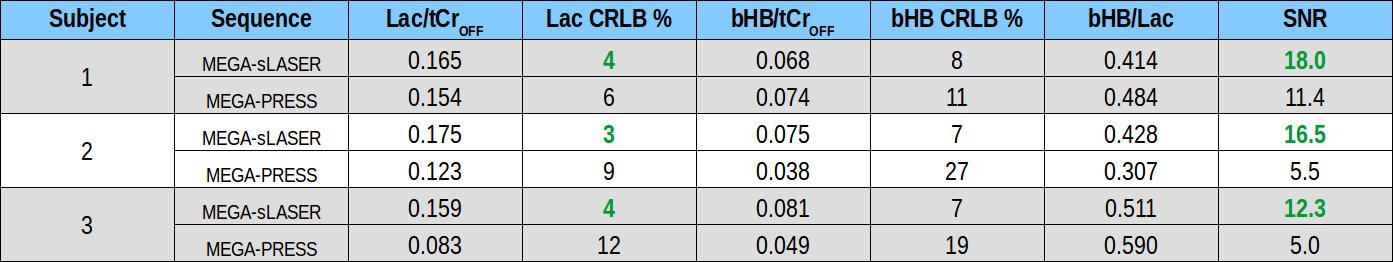
All in vivo experiments revealed a strongly increased SNR for the Lac methyl resonance and reduced CRLBs for Lac and bHB in the LCModel quantification for MEGA-sLASER spectra compared to MEGA-PRESS (Fig. 4).
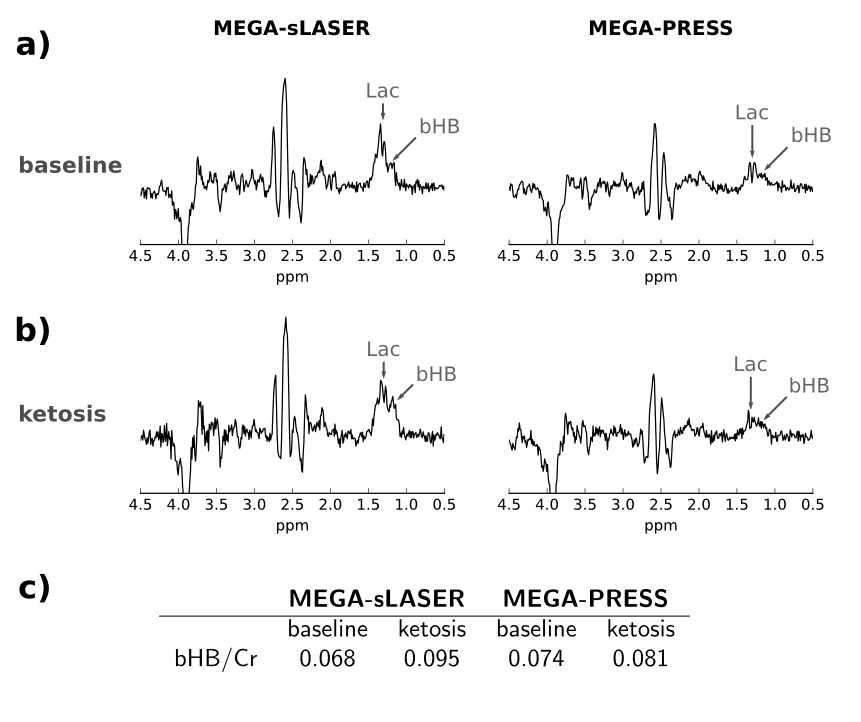
Fig. 5 shows DIFF spectra from measurements before and during the (low carbohydrate) ketogenic diet. The bHB increase is more evident in the MEGA-sLASER than in the MEGA-PRESS spectra. MEGA-sLASER quantification results yielded a substantial increase in the bHB/Cr ratio during the ketogenic diet while there was hardly any change in the Lac/Cr ratio.
Discussion
For detection of Lac and bHB, MEGA-sLASER benefits from a roughly twice as large SNR compared to MEGA-PRESS as a consequence of the strongly reduced chemical shift displacement. In the spectral quantification, this SNR gain is also reflected by substantially decreased CRLBs obtained for MEGA-sLASER. It must be noted that with the proposed sequence two macromolecular resonances (MM2 at 1.21 ppm and MM3 at 1.43 ppm) are coedited [7], which may affect quantitative results obtained for Lac and bHB. This issue requires further investigation, e.g. through the acquisition of metabolite-nulled spectra, and might be addressed by inclusion of corresponding MM model spectra in the fit.Acknowledgements
This work was funded by the German Research Foundation (DFG), grant number LA 3353/2-1.References
1. Edden RAE, Harris AD, Murphy K, et al. Edited MRS is sensitive to changes in lactate concentration during inspiratory hypoxia. J Magn Reson Imaging. 2010;32(2):320-325. doi:10.1002/jmri.22233.
2. Lange T, Ko CW, Lai PH, Dacko M, Tsai SY, Buechert M. Simultaneous detection of valine and lactate using MEGA-PRESS editing in pyogenic brain abscess. NMR Biomed. doi: 10.1002/nbm.3660.
3. Pan JW, Telang FW, Lee JH, et al. Measurement of β-hydroxybutyrate in acute hyperketonemia in human brain. Journal of Neurochemistry. 2001;79(3):539-544. doi:10.1046/j.1471-4159.2001.00575.x.
4. Pan JW, Rothman DL, Behar KL, Stein DT, Hetherington HP. Human Brain β-Hydroxybutyrate and Lactate Increase in Fasting-Induced Ketosis. J Cereb Blood Flow Metab. 2000;20(10):1502-1507. doi:10.1097/00004647-200010000-00012.
5. Mescher M, Merkle H, Kirsch J, Garwood M, Gruetter R. Simultaneous in vivo spectral editing and water suppression. NMR Biomed. 1998;11(6):266-272.
6. Arteaga de Castro CS, Boer VO, Andreychenko A, et al. Improved efficiency on editing MRS of lactate and γ-aminobutyric acid by inclusion of frequency offset corrected inversion pulses at high fields. NMR Biomed. 2013;26(10):1213-1219. doi:10.1002/nbm.2937.
7. Behar KL, Rothman DL, Spencer DD, Petroff OAC. Analysis of macromolecule resonances in 1H NMR spectra of human brain. Magn Reson Med. 1994;32(3):294-302. doi:10.1002/mrm.1910320304.
Figures