3008
Effect of dietary intervention on liver fat content during the day. A pilot MR study1MR Unit, Dept Diagnostic and Interventional Radiology, Institute for Clinical and Experimental Medicine, Prague, Czech Republic, 2Centrum of Experimental Medicine, Institute for Clinical and Experimental Medicine, Prague, Czech Republic
Synopsis
Liver fat content is an important parameter characterizing clinical status of the liver. Steatosis can be measured by magnetic resonance spectroscopy and imaging techniques non-invasively. The group of healthy volunteers was examined by MRS and MRI on three occasions after fat load, fat load with glucose and during whole-day fasting.
Obtained results show that both used MR techniques are suitable for fat content measurements in the liver during dietary intervention. The pilot study results suggest that concentration of NEFA in systemic circulation is a critical factor that determines whether fat accumulates in the liver during the day in healthy insulin sensitive subjects.
Introduction
Liver fat (LF) content is an important parameter characterizing clinical status of the liver. Steatosis can be measured by magnetic resonance spectroscopy and imaging (MRS and MRI) techniques non-invasively. To best of our knowledge there is no information how the hepatic fat content changes during the day and whether such changes can be affected by dietary manipulation. Therefore, the group of healthy volunteers was examined by MRS and MRI methods three times within 8 hours on three occasions: after fat load (F), fat load with glucose (FG) and during whole-day fasting (C).Material and methods
Subjects and experimental protocol
Six healthy volunteers (age 41±11 years, BMI 27±3 kg/m2, mean liver fat content 1.8±0.8 %) participated in the study. The protocol was approved by local ethical committee. Each of the volunteers underwent three experiments lasting 8 hours. In the first experiment volunteers received pure cream (150 g of fat, experiment F), in the second experiment cream (150 g of fat) and 50 g of glucose and additional two boluses of glucose 2 and 4 hours later (experiment FG), and in the third experiment subjects fasted the whole day (control experiment C). The MR examination was carried out three times during each experiment, first after overnight fasting and then 3 and 6 hours after ingestion of the cream. Blood for determination of plasma triglyceride (TG), non-esterified fatty acids (NEFA), glucose and insulin was drawn 10 times during each experiment. Subjects were allowed to drink water or herbal tea during the experiments.
MR examination
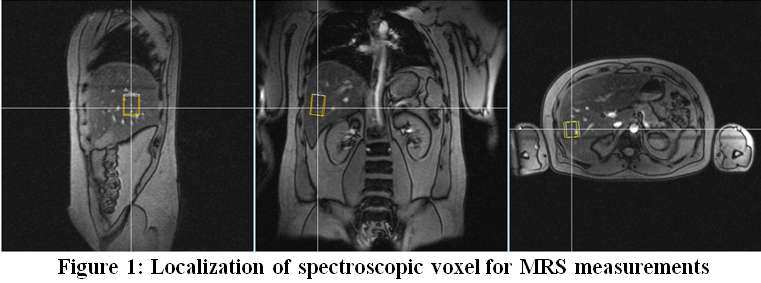
In the beginning of MR examination, standard T2-weighted images were measured and used for localization of spectroscopic voxel. 3D spoiled gradient echo (SPGR) sequence (12 echoes, 16 slices) was used to determine lipids distribution in the liver [1]. Single voxel spectroscopy method (SVS) by PRESS sequence with TR/TE=4500/30 ms and voxel size VOI=40x30x25 mm3 was used with 1 acquisition in breath hold. Localization of voxel is shown in Figure 1. All spectroscopic data were measured three times and from this we determined reproducibility as 90 % (1-SD/Mean).
Data analysis
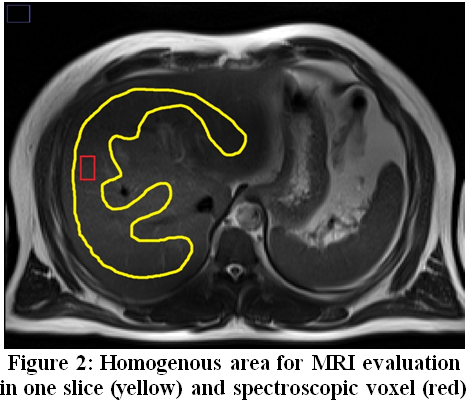
Spectroscopic data were evaluated by LCModel [2]. Percentage of lipid content was calculated according to [3,4] and corrected to T2 relaxations (we used literature values of lipid T2 60 ms and 27 ms for water). Images resulting from SPGR sequence measurements were evaluated by ImageJ program [5] and liver images were segmented manually in all sixteen slices. Homogenous area of interest in the right lobe of the liver (without arteries) was selected manually for the calculation of lipid content (see Figure 2) according to [1]. Calibration curve between MRS and MRI data for lipid content determination was constructed using phantoms with known lipid content. This calibration curve was used to correct MRI to make them comparable with MRS results. Paired t-test was used for data analysis with p<0.05 considered significant (between morning and afternoon examination).
Results
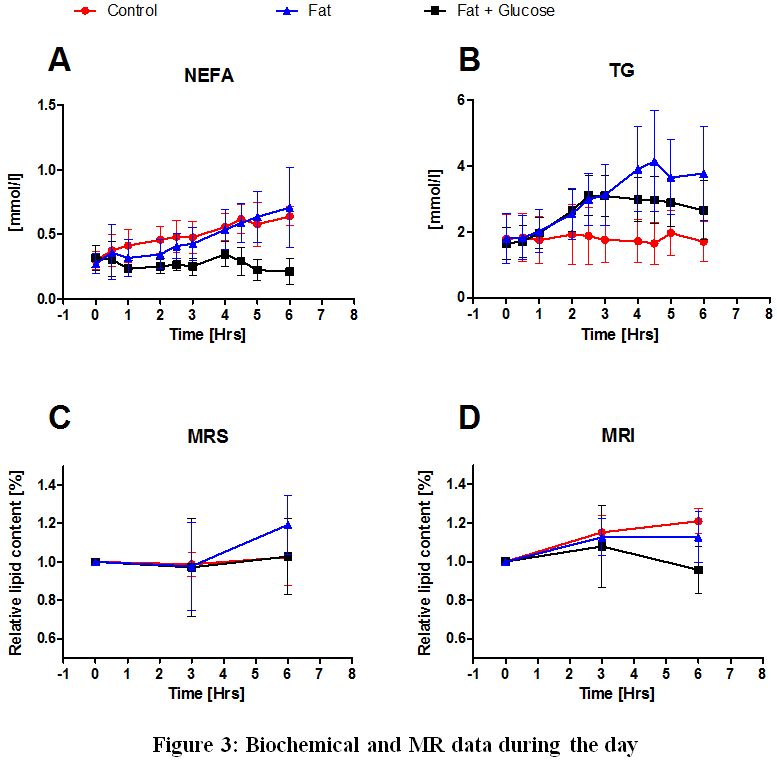
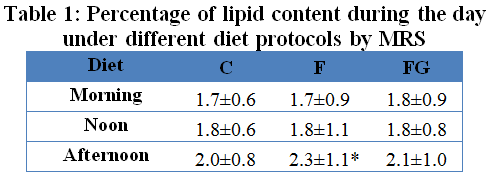
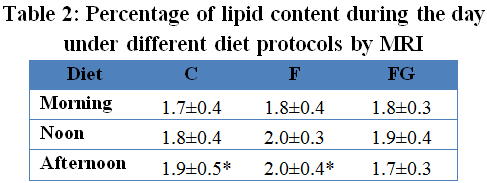
We found good correlation between MRS and MRI fat content after the application of correction factors (r=0.57). These MR results show that the administration of pure fat (experiment F) and fasting (experiment C) resulted in liver lipid accumulation (MRI: p=0.03, p=0.01 for F and C experiment, respectively, MRS: p=0.02, p=0.30 for F and C experiment, respectively; paired t-test). No change of hepatic fat content was found in experiment FG (Figure 3).
Biochemical data shows the concentration of NEFA (substrate for hepatic TG synthesis) rises during experiments F and C and was not affected in experiment FG. Moreover, there was a positive correlation between the increment of hepatic fat and area under increment curve of NEFA (r=0.44, p=0.07 for MRS and r=0.45, p=0.06 for MRI).
Discussion
MRI and MRS results show that both used techniques are suitable for the measurement of fat content in the liver during dietary intervention. LF content obtained from MRI represents mean value contrary to that obtained from MRS which describes the fat content in relatively small volume of the liver. We cannot exclude that there are differences in spatial distribution of LF in the liver. It is another part of our study and results are not available yet.
The results of this pilot study suggest that concentration of NEFA in systemic circulation is a critical factor that determines whether fat accumulates in the liver during the day in healthy insulin sensitive subjects.
Acknowledgements
The study was supported by Ministry of Health, Czech Republic AZV: 16-28427A and 00023001IKEM Institutional support.References
[1] Jirak D et al. World Molecular Imaging Congress. 2014; Book of Abstracts, No. SS53.
[2] Provencher SW. NMR Biomed. 2001;14(4):260-4.
[3] Longo R et al. J Magn Reson Imaging. 1995;5(3):281-5.
[4] Hajek M et al. MAGMA. 2011;24(5):297-304.
[5] https://imagej.nih.gov/ij/
Figures