3007
Temperature Calibration and Errors Assessed by Magnetic Resonance Spectroscopy1Signal and Image Processing, Singapore Bioimaging Consortium, Singapore, Singapore, 2Laboratory of Molecular Imaging, Singapore Bioimaging Consortium, Singapore, Singapore, 3Singapore Institute for Clinical Sciences, Singapore, 4Miller School of Medicine, University of Miami, Miami, FL, United States
Synopsis
Whole brain temperature mapping is of great interest for investigating traumatic brain injuries. Single-voxel-spectroscopy (SVS) and CSI approaches provides limited spatial coverage in the brain, whereas 3D Echo-planar spectroscopic imaging (EPSI), covers the entire brain for investigating temperature and metabolism in traumatic brain injury and other studies . Our study focuses on calibration and validation of the temperature measurement in brain phantoms using EPSI and SVS at pre-clinical and clinical scanners, to study and analysis of whole brain temperature in rodents and humans.
Purpose
In vivo assessment of temperature is of clinical interest in various pathological conditions including brain injuries1, 2. Magnetic resonance spectroscopic approaches rely on the shift of the water signal due to change in temperature3. The change in chemical shift of water signal is commonly assessed in relation to another signal which is insensitive to temperature. In this work we have assessed the errors that can influence the temperature calibration at 3T and 7T.Methods
Two-chamber brain phantoms were fabricated using glass. The inner chamber was filled with 61.25 mM of NAA, 39.25 mM of Creatine and 8.5 mM of Choline dissolved in 100 ml of phosphate buffer solution maintained at a pH of 7.2. Calibration: Data was acquired at 7T, Bruker ClinScan, and 3T, Siemens Tim Trio. Temperature controlled water was circulated in the outer chamber of the phantoms to raise the temperature of the buffer solution in the inner chamber. Temperature of the buffer solution was continuously monitored using an optical temperature probe with a resolution of 0.10C. At every step the temperature of the inner chamber was allowed to stabilize before MR measurements. Single voxel PRESS and Echo-planar spectroscopic imaging (EPSI) was performed on the phantom in both 3T and 7T at different temperatures (30 0C – 40 0C at ~10C step). MR Sequences: - Localized PRESS was performed with TR/TE = 4000/13 ms; 7 x 7 x 7 mm voxel was placed at the center of the inner compartment; water-suppressed (with 16 averages) and water-unsuppressed (with 2 averages) spectra were acquired whereas in 3T, PRESS spectra were acquired with TR/TE – 2000/30 ms; 15 x 15 x 15 mm voxel, 24 averages for water-suppressed and 2 averages for water-unsuppressed acquisition. EPSI: - A 3D EPSI sequence was implemented on both 3T and 7T and spectroscopic data was collected using spin echo (SE) based EPSI sequence, with interleaved water reference acquisition. EPSI data on 7T was acquired with a voxel resolution of 2 x 2 x 2 mm, FOV- R >>L -100mm, A >> P - 40mm and F >> H - 10mm respectively, and TR1 / TR2 / TE of 3000/ 1200 / 70 ms, with 84 Ernst angle for excitation followed by 1800 for re-focusing of metabolite signals. 3T EPSI was acquired with an in-plane resolution of 5.6 x 5.6 mm and 7.5 mm slice thickness; TR1 / TR2 / TE of 2000/ 700 / 70 ms; 2 averages, FOV- R >>L - 280mm, A >> P - 180mm and F >> H - 60mm respectively and flip angle of 730. EPSI processing – A 3D MPRAGE data was acquired along with EPSI for spatial reference. EPSI data was collected and post processed with MIDAS software 4. Using the MIDAS processed water (SI_Ref ) and metabolite (SI) spectrum we calculated the Water, NAA, Cr and Cho chemical shift differences (ppm) using an in-house developed MATLAB program. The chemical shift difference in ppm between water and metabolite signals of NAA, Cr and Cho were estimated for the temperature range of 30 0C to 40 0C with a resolution of (~ 10C).Results
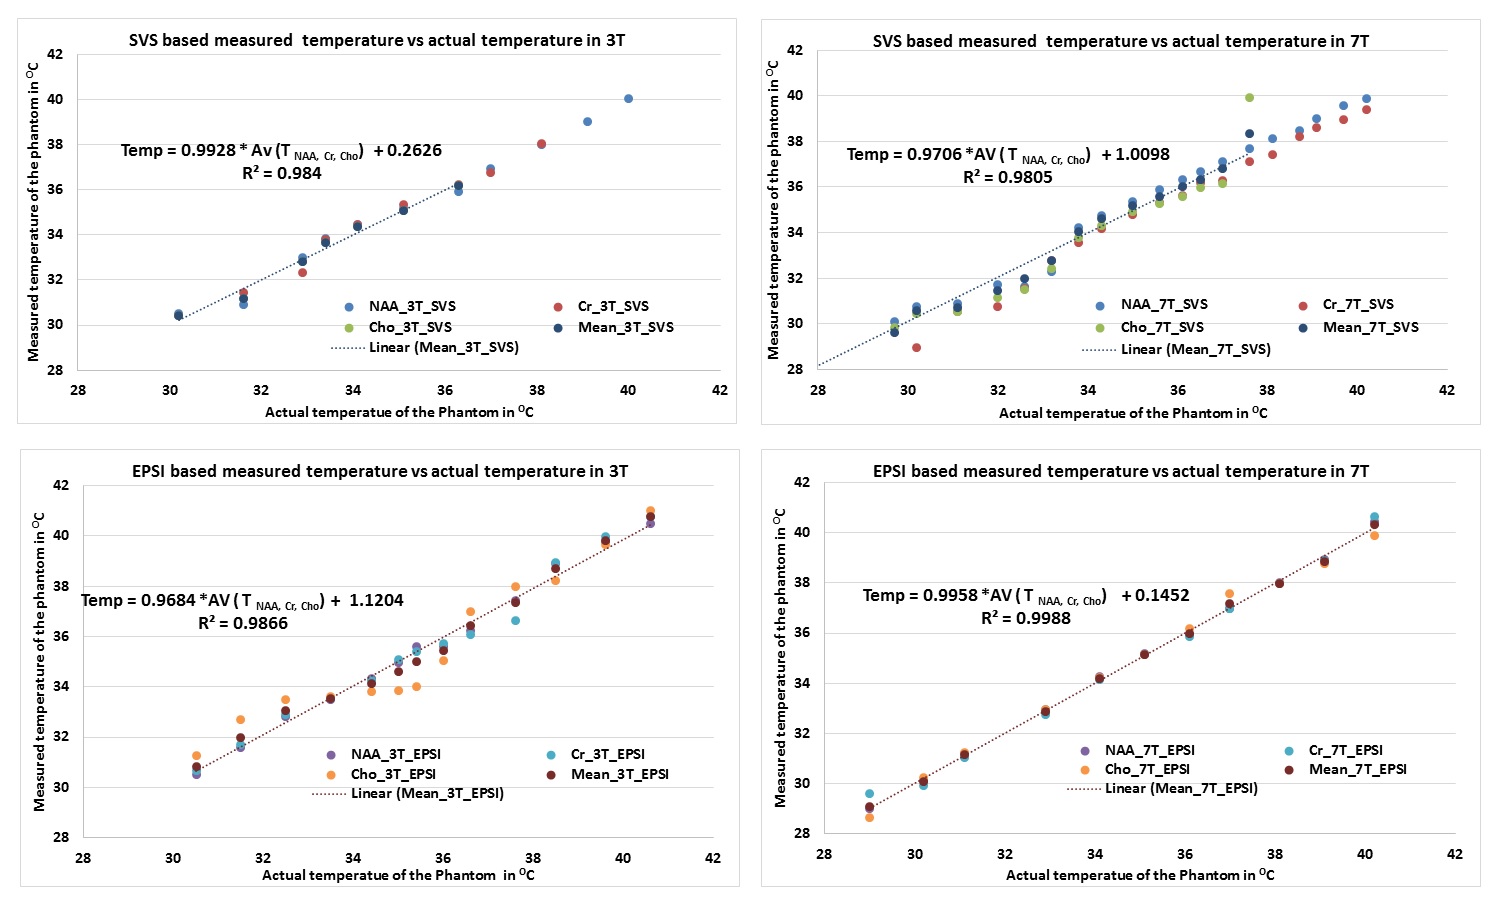
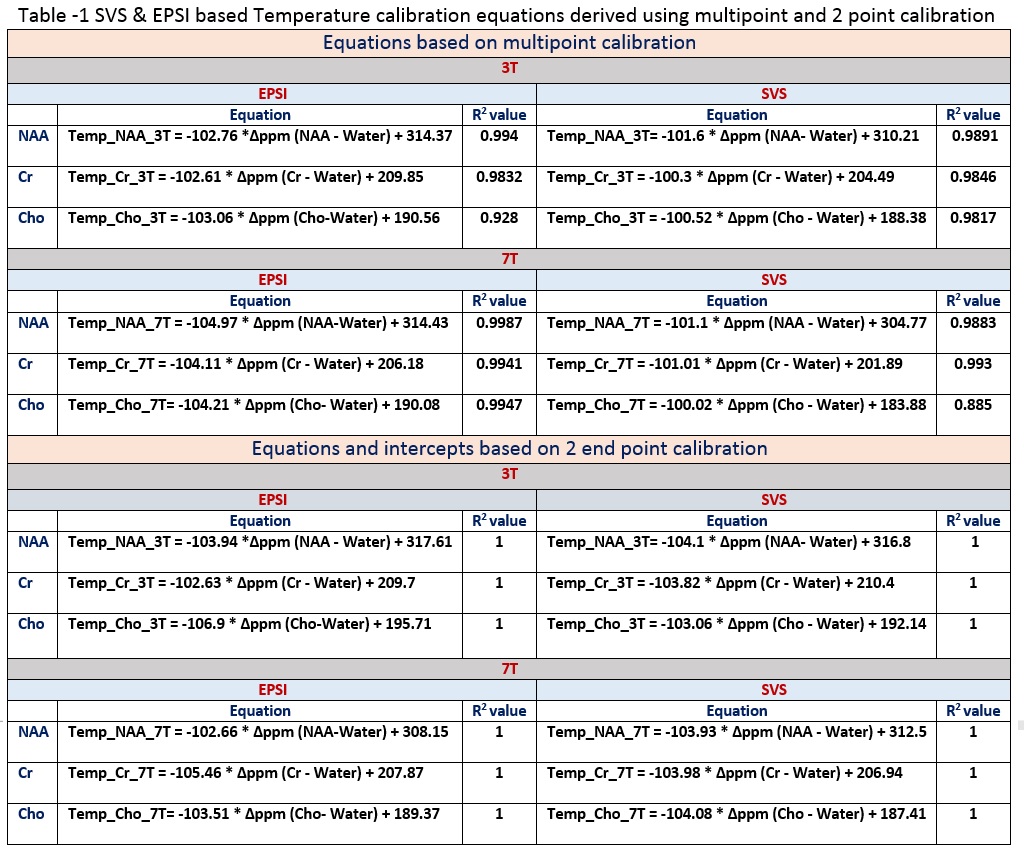
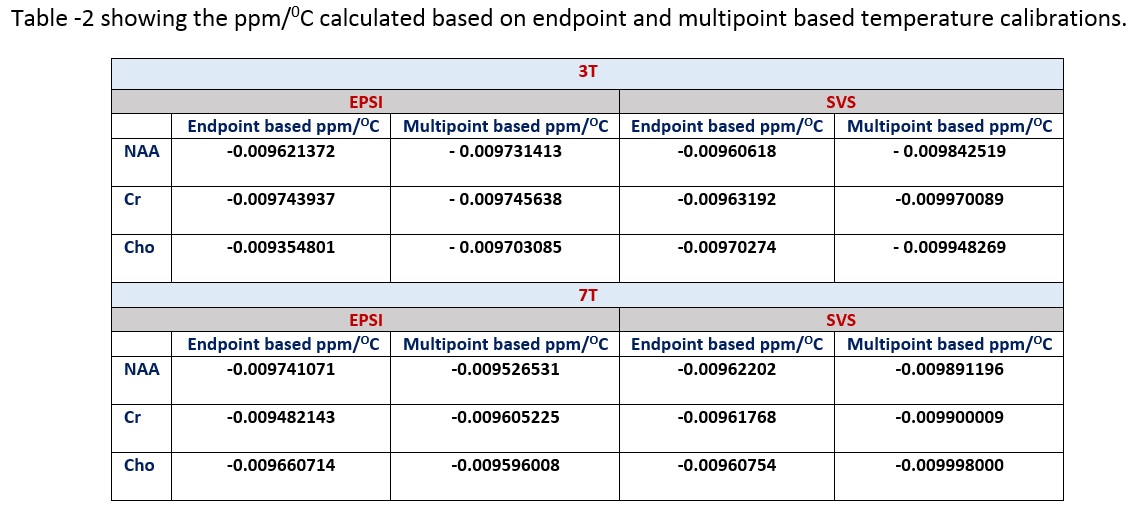
Figure shows the single voxel based measurements (PRESS) and spectroscopic imaging (EPSI) based measurements in 3T and 7T. Table 1 gives the derived least square error based linear relationship between chemical shift separation in ppm and temperature for both methods. Table 2 shows the ppm change / 0C estimated using the equation’s slope as well from the slope calculated by using the endpoints of the line. The linewidths of the resonances at 360C for EPSI at 3T – Water 4Hz, NAA 10Hz, Cr 7Hz, Cho 7Hz; EPSI 7T – Water 4 Hz, NAA 5 Hz, Cr 4 Hz, Cho 3 Hz); SVS_3T Water 3Hz, NAA 6Hz, Cr 5Hz, Cho 5 Hz; and SVS_7T Water 3Hz, NAA 4Hz, Cr 3Hz, Cho 3Hz.Conclusions
NAA, Cr and Cho showed differences in linearity for the change in temperature and also varied between 3T and 7T. The changes in ppm relative to temperature is nonlinear (ex. The individual data points of metabolites at every temperature point) and hence a piecewise relationship is more accurate compared to linear fit considering the fact that a small change in frequency or ppm has a significant change in temperature. PRESS based measurements showed better accuracy compared to spectroscopic imaging (EPSI) due to better homogeneity and higher spectral resolution though both EPSI and SVS had similar linewidths for all the metabolites. EPSI offers the advantage of larger spatial coverage and might be suitable for obtaining whole brain temperature maps. The temperature calibration is more accurate when multiple metabolites are used for each temperature. Phantom based calibration results might differ from actual invivo based measurements due to differences in susceptibility, ionic and protein content, and other heterogeneity in tissues 5. Instead of performing a 2 point based calibration it is better to use multipoint calibration as it provides the advantage of signal averaging.Acknowledgements
No acknowledgement found.References
[1] Tazoe J et al. Neuroradiology. 2014; 56(10): 809–815.
[2] Childs C et al. Critical Care. 2013; 17:222.
[3] Rieke V et al. JMRI. 2008; 27(2):376-390.
[4] Maudsley, et al. NMR Biomed. 2006; 19: 492–503.
[5] Soumya et al. BioMed Research International. 2013; Article ID 60298Figures