3006
Linear discriminant and principle component analysis of MR spectroscopy data in pediatric mild traumatic brain injury (pmTBI)1Imaging, Huntington Medical Research Institutes, Pasadena, CA, United States, 2Huntington Medical Research Institutes, Pasadena, CA, United States, 3California Institute of Technology, 4Division of Systems Biology, FDA National Center for Toxicological Research, Jefferson, AR, United States
Synopsis
Pediatric mild traumatic brain injury data is necessary to understanding and predicting recovery of cognitive and psychiatric sequelae as pediatric subjects may take longer to recover than adults. Our study presents MR spectroscopy data acquired in five different brain regions of concussed and non-concussed high school athletes. Data were analyzed utilizing linear discriminant in combination with principal component analysis. Initial results demonstrate reasonable separation of mTBI subjects compared to normal controls. In addition, data from multiple time-points after injury demonstrate a return toward normal pattern and can be used to predict recovery and return-to-play times.
Introduction
Traumatic brain injury (TBI) is the leading cause of death in children and adolescents1. Mild TBI is the most common form of TBI and the focus of this study. Post-concussion syndromes (lasting >3 months) occur in a large subset of patients2. Pediatric patients take longer to recover than adults from mild (mTBI) (Hovna) but currently there are no ways to predict time to recovery from mTBI. MR spectroscopy in adult TBI reveals an acute increase lactate3 and reduction of N-acetyl aspartate4 acutely, and increased choline after repetitive injuries5. But MRS data are sparse in pediatric TBI, and this study aims to fill that gap.Methods
Student athletes ages 10-18 were recruited for MR examination on a GE 1.5T scanner (with IRB approval); four normal controls were examined at baseline, and six with acute concussions (football) were examined on 3 visits: 1-3 days, 14 days, and 30 days post-injury. Single-voxel PRESS MRS was acquired in five brain locations in all participants: posterior grey matter (GM), frontal GM, left parietal white matter (WM), and left and right frontal WM. We first calibrated an in-house spectral pre-processing algorithm on controls. Side-to- side misalignment of peaks was adjusted using a two-point calibration with peak misalignment results from depth of tissue effects on the strength of the magnetic field. Then, an error reduction signal enhancement based on relative standard deviation calculation was applied. The relative intensity differences between scans is impacted by magnetic field inhomogeneity. The effect of the two-part adjustment is to increase true signal and reduce noise, sharpening peaks relative to their original appearance. The weighting algorithm measures the reliability of the peaks in a non-biased process, so that resulting scans are not skewed or biased toward any particular subject group and can be analyzed using pattern recognition software. Major metabolites from the five brain regions of concussed and normal subjects were then analyzed. Linear discriminant analysis was used as the basis of pattern recognition by looking for variance in the data and classifying it in eigenvectors. The first vector describes the largest variance with successive vectors describing lesser and lesser components of variance. All classes are separated according to greatest variance. The axes in the image are the first three discriminant functions calculated from original peak intensities in the scans. The discriminant functions are orthogonal vectors that appear perpendicular to each other in the 3D image, creating the axes. The units of the axes are relative since the plot is an image of transformed space. Distance between clusters in the plots is calculated as distance between the data points. These results presented here using linear discriminant analysis are compared with an alternative analysis using principal component analysis (PCA).Results
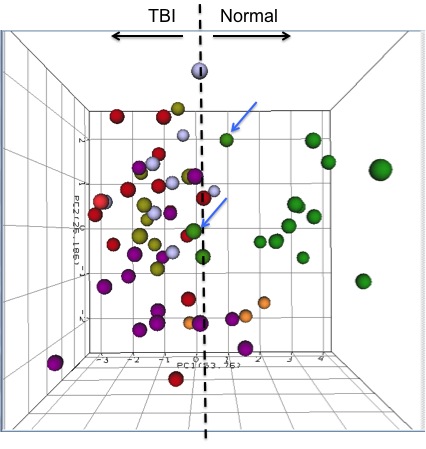
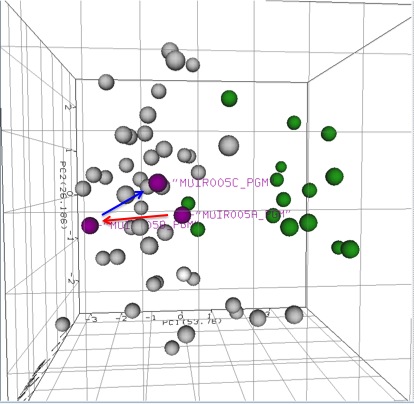
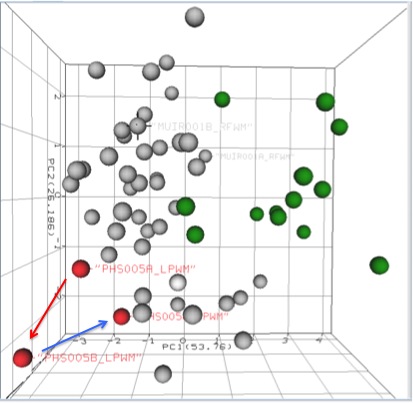
In this pilot analysis, the mTBI MRS scans were performed in 6 acute concussion (mild TBI) subjects (ages 12-16) and 4 normal controls (ages 10-16). There is reasonable separation between normal scan data clusters (Figure 1, green circles) and TBI data clusters (Figure 1, non-green circles). In the normal group, there is wide variance between the same brain regions in two subjects (Figure 1, blue arrows) compared to the TBI data clusters. In 2 of 5 concussion subjects (Figures 2 and 3) and scans from day 1 and 14 showed a trend toward the TBI group (red arrows), but scans from day 30 show a trend toward the normal pattern (blue arrows), in both left frontal WM and poster GM regions. This indicates a possible acute recovery pattern.Discussion
Initial results from the first month of this longitudinal study demonstrate initial discrimination between those with mTBI and normal controls. At 1-month post injury scans from most of the mTBI show a return toward the normal pattern. One control was assigned to the mTBI group but this may reflect a limitation of unrecognized mTBI. We will continue to assess more subjects and work to improve our clinical assessment to better understand the range of MRS data distribution and clustering after mTBI. Additional follow-up scans at 6 and/or 12 months may still be needed to understand implications for long term recovery.Conclusion
Our pilot analysis of pediatric MRS data using linear discriminant analysis and PCA suggests that MRS may be useful in identifying pediatric concussion thereby potentially aiding in its diagnosis and in monitoring acute changes after concussion.Acknowledgements
Acknowledgements: HMRI thanks the Lucas Foundation for their generous support of the research and Darlene Royal for her diligence in the recruitment process.References
1. http://www.biausa.org/brain-injury-children.htm
2. Max, J.E., Keatley, E.; Wilde, E.A., et al. 2012, “Depression in children and adolescents in the first 6 months after traumatic brain injury”, Int. J. Devl Neuroscience, vol. 30, pp. 239-245.
3. Moffett, J.R., Arun, P., Ariyannur, P.S., Namboodiri, M.A. 2013, “N-Acetylaspartate reductions in brain injury: impact on post-injury neuroenergetics, lipid synthesis, and protein acetylation”, Frontiers in Neuroenergetics, vol. 5, pp. 1-19.
4. Ross, B.D., Ernst, T., Kreis, R., et al. 1998, “1H MRS in acute traumatic brain injury”, JMRI, vol. 8, number 4, pp. 829-840.
5. Ng, T.S.C., Lin, A.P., Koerte, I.K., et al. 2014, “Neuroimaging in repetitive brain trauma”, Alzheimer’s Research & Therapy, vol. 6, issue 10, pp. 1-15.
Figures