3005
Comparison of metabolic adaptations between endurance- and sprint-trained athletes in two different muscles using a 31P spectroscopic multi-slice sequence1Medical Physics Group, Institute of Diagnostic and Interventional Radiology, Jena University Hospital - Friedrich Schiller University Jena, Jena, Germany, 2Institute for Physiotherapy, Jena University Hospital - Friedrich Schiller University Jena, Jena, Germany
Synopsis
Due to specific training orientations athletes adapt with different metabolic responses to a given exercise. We used a 31P MR multi-slice sequence allowing a non-invasive investigation of high energy changes in two muscles. Different metabolic adaptations were shown within two muscles of different trained athletes. This may help to characterize training specific effects on energy metabolism.
Purpose
Phosphorous MR Spectroscopy (31P-MRS) is an important tool to investigate energy metabolism in skeletal muscles in vivo by analyzing kinetics of pH, phosphocreatine (PCr) and inorganic phosphate (Pi) during exercise and recovery1. Specific activities like endurance training may induce metabolic adaptations as a consequence of a higher oxidative capacity2. In this study, load induced metabolic changes were spectroscopically investigated in calf muscles of two differently trained groups in order to characterize training specific effects on energy metabolism.Methods
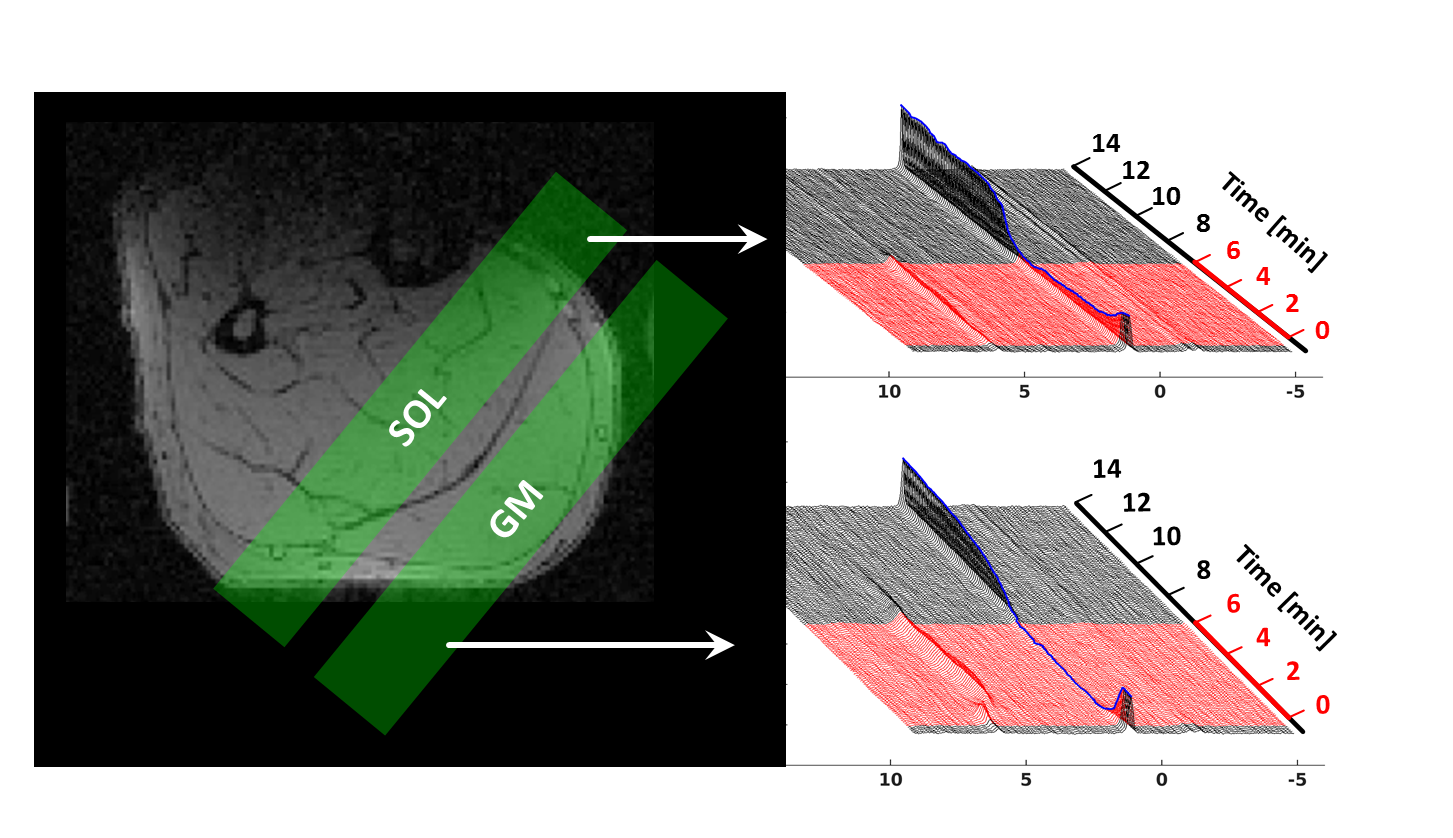
Right calf muscles of seven active endurance- and seven sprint-trained athletes (age: 27 ± 5 years) were exercised till exhaustion by using a maximum voluntary contraction (MVC) adapted plantar flexion in a pedal ergometer3 (20% of MVC, 0.8 Hz pedal frequency). 31P-MR spectra were acquired in a clinical 3 T MR scanner (Magnetom PRISMA fit, Siemens, Erlangen, Germany) in m. gastrocnemius medialis (GM) and m. soleus (SOL) by using a double tuned 1H/31P flexible MR coil (Rapid BioMedical) and a multi-slice FID sequence (Fig. 1). The latter enables interleaved data sampling from multiple tissue regions (TR = 5 s, 16 mm slice thickness, outer volume saturation bands over adjacent muscle regions). MR spectra series were quantified with jMRUI 4.0 software (jmrui.eu) to determine evolutions of PCr and pH.Results
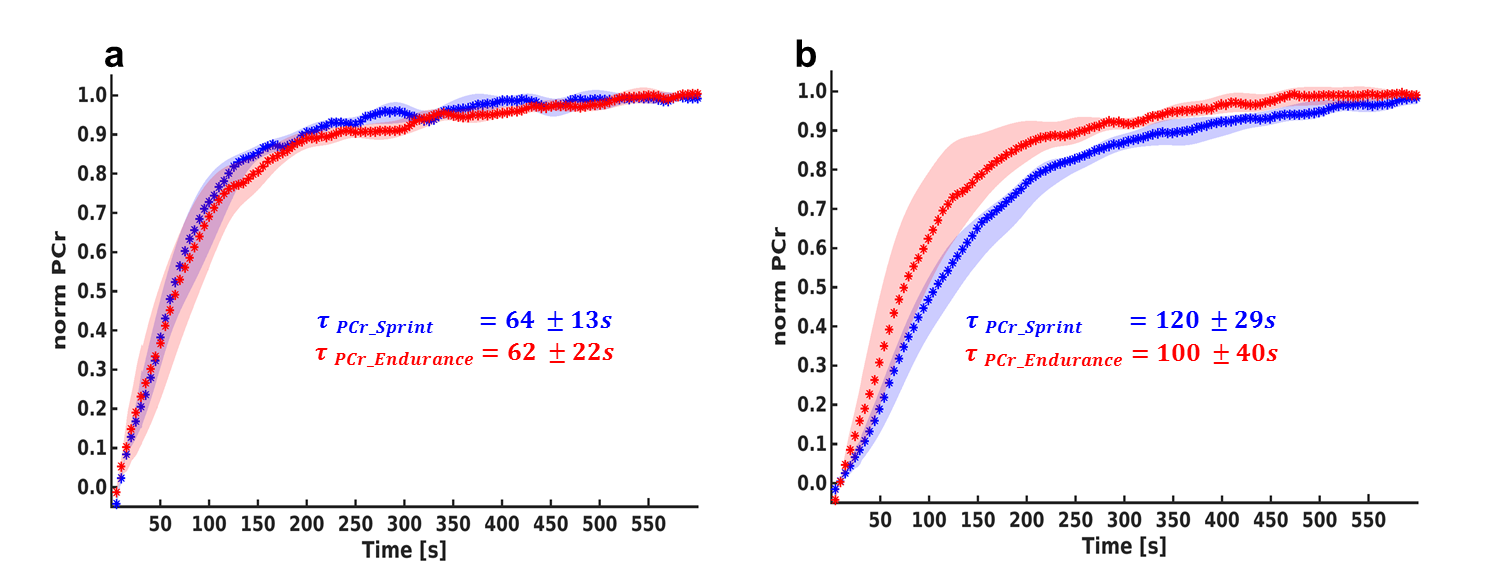
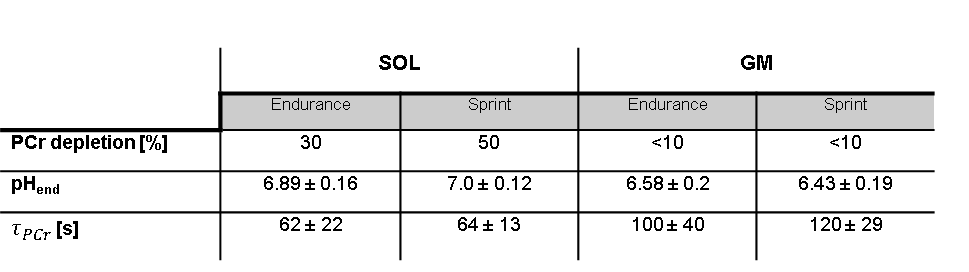
Sprint-trained athletes revealed higher MVC than endurance-trained athletes. Higher metabolic changes (PCr depletion and pH drop) were observed in the GM compared to the SOL (Table 1). PCr was completely depleted in the GM in both groups whereas the SOL showed a lower depletion especially in the sprint-trained group. With similar exercise durations among the subjects (8 ± 3.4 min vs. 7.9 ± 3.7 min) sprint-trained athletes revealed a metabolic impact mainly on the GM compared to endurance-trained athletes who showed a significant metabolic response in both muscles. In both groups a distinctly stronger pH drop was found in the GM than in the SOL. In the GM lower end-exercise pH values were determined in sprinters compared to endurance subjects. In general, the recovery of PCr was faster in the SOL than in the GM. No group specific differences were observed in the SOL. At the same time, sprinters revealed a slower PCr recovery in GM than endurance subjects (Fig. 2).Discussion and Conclusion
In this work we showed the simultaneous non-invasive investigation of metabolic contributions in two muscles (SOL and GM) of differently trained subjects. As expected various metabolic adaptations were observed between investigated muscles as well as between the groups, which reflects different muscle fiber distributions4 as well as training orientations5. While the endurance athletes tend to stress both the SOL and the GM, the metabolic adaptation in sprint athletes remained primarily associated with the GM with a higher fraction of glycolytic fibers1. This more efficient strategy might lead to lower anaerobic load (H+ and lactate production) in endurance athletes and thus provides a higher fatigue resistance during long lasting exercises6. A higher vascularization as a result of endurance training in this group led in a much faster PCr recovery7. However, sprint-trained athletes were able to afford a stronger acidification which may support their ability to perform high-intensity exercises4. To prove and to verify interrelations between metabolic adaptations and training status and to determine possible exhaustion avoiding strategies additional data, like lactate accumulation, buffer capacity, H+ efflux as well as respiration parameters, should be acquired in future studies.Acknowledgements
This work was supported by the Competence Centre for Interdisciplinary Prevention (KIP) atthe Friedrich Schiller University Jena and the German Professional Association for Statutory AccidentInsurance and Prevention in the Foodstuffs Industry and the Catering Trade (BGN). K.M.is supported by a graduate scholarship of the Friedrich-Schiller-University Jena (Landesgraduiertenstipendium).K.M. also acknowledges support by the German Academic ExchangeService (DAAD) for a short-term international scholarship at the University of Liverpool(57044996). The authors declare to have no relevant financial interests to disclose with regard tothis study.References
1. Kemp G. Muscle Studies by 31P MRS. eMagRes. 2015; 4(1): 525-34.
2. Layec G et al. Short-term training alters the control of mitochondrial respiration rate before maximal oxidative ATP synthesis. Acta Physiol Scand. 2013; 208(4): 376-86.
3. Tschiesche K et al. MR-compatible pedal ergometer for reproducible exercising of the human calf muscle. Med Eng Phys. 2014; 36(7): 933-37.
4. Kemp GJ et al. Absolute quantification of phosphorus metabolite concentrations in human muscle in vivo by 31P MRS: a quantitative review. NMR Biomed. 2007; 20(8): 555-65.
5. Fiedler G et al. Skeletal muscle ATP synthesis and cellular H+ handling measured by localized 31P-MRS during exercise and recovery. Sci Rep. 2016; 6.
6. Maassen N et al. Physiologische "Nebenwirkung" der Milchsäure. Dtsch Z Sportmed. 2008; 59(12): 292-6.
7. Johansen L et al. 31P-MRS characterization of sprint and endurance trained athletes. Int J Sports Med. 2003; 24(3): 183-9.
Figures