3004
The effect of sex on neurochemical profile quantified from the human brain at 7T1Department of Radiology, CMRR, University of Minnesota, Minneapolis, MN, United States, 2School of Public Health, University of Minnesota, Minneapolis, MN, United States
Synopsis
Sex is a critical biological factor that needs to be factored into study designs and analyses. In the present work, we sought to quantify sex-related differences of neurochemical profiles, utilizing 1H MRS data from the visual cortex of 22 healthy females (age 24±6 years) and 27 males (age 26±6 years) acquired at 7 T. Whereas there was a trend of sex-related differences for few metabolites, no statistically significant differences were observed above the attained metabolite sensitivity threshold of 0.2 µmol/g. The results indicate that sex is not a major confounding variable for MRS experiments performed on the visual cortex of young subjects.
Purpose
Sex is a critical biological variable that needs to be factored into research designs and analyses, as recently emphasized by the National Institute of Health (NIH). A specific justification must be provided for research applications proposing to study only one sex or exclude sex as a variable in data analysis. Appropriate analysis and transparent reporting of data by sex enhance the rigor, transparency, and applicability of biomedical research. To date, there is conflicting evidence about sex-related differences in the neurochemical profiles of the human brain.1-4 In the present work we sought to quantify sex differences of neurochemical profiles obtained with state-of-the-art 1H MR spectroscopy (MRS) at 7 T. Given our long-term interest in functional MRS studies of the visual system5 , we focused on metabolite MR spectra acquired from the primary visual cortex of young healthy adults.Methods
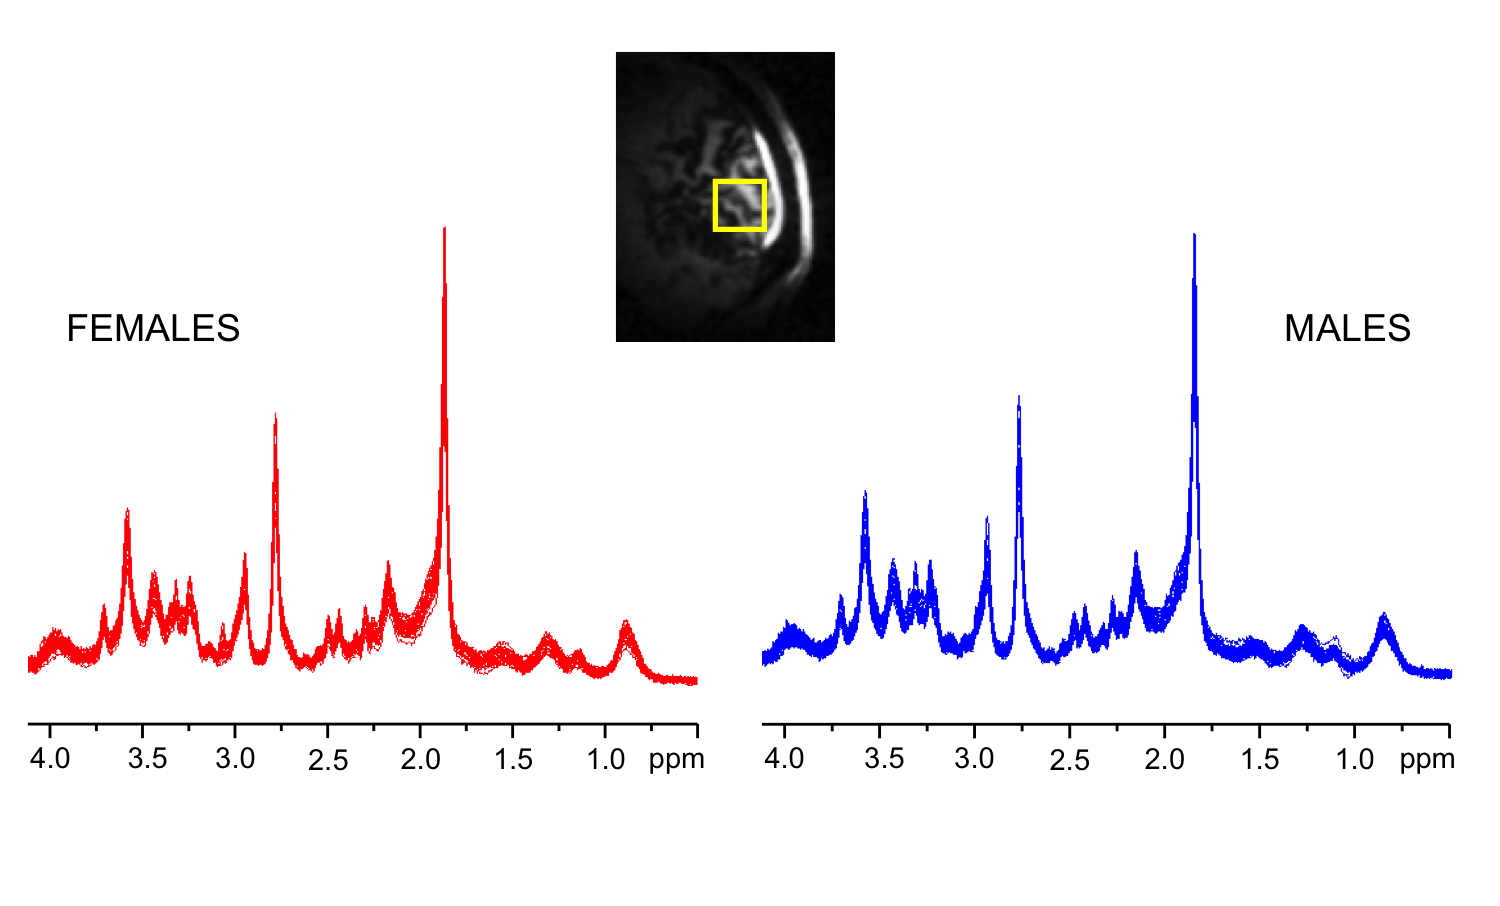
We analyzed data acquired from the visual cortex of 22 healthy females (age 24±6 years) and 27 males (age 26±6 years). The MRS experiments were conducted on a 7T/90cm Agilent magnet interfaced to Siemens console. Data were obtained with half-volume quadrature surface coil providing high transmit field in the occipital cortex. High-resolution MPRAGE images were used to navigate voxel placement in the primary visual cortex based on anatomical landmarks. The 8 mL (2x2x2 cm3) voxel was positioned to cover symmetrically the pericalcarine cortex in the left and right occipital lobe. An automatized FASTMAP technique minimized within-voxel B0 inhomogeneity. Spectra were acquired using a semi-LASER localization sequence (TR = 5 s, TE = 26 ms). Data were averaged in a single-scan mode (32 x 1), corrected for minor frequency and phase fluctuations and summed. Spectra were quantified with LCModel utilizing spectra of 20 simulated metabolites and a measured spectrum of macromolecules. Unsuppressed water spectrum was used as an internal reference for quantification. Only metabolites, consistently quantified with mean Cramer-Rao lower bounds (CRLB) below 50% were used for further analysis. Metabolite concentrations and CRLBs were compared between males and females using unpaired two-tailed t-test. The significance threshold was adjusted with false discovery rate method to limit the likelihood of false positive results to 5%.Results
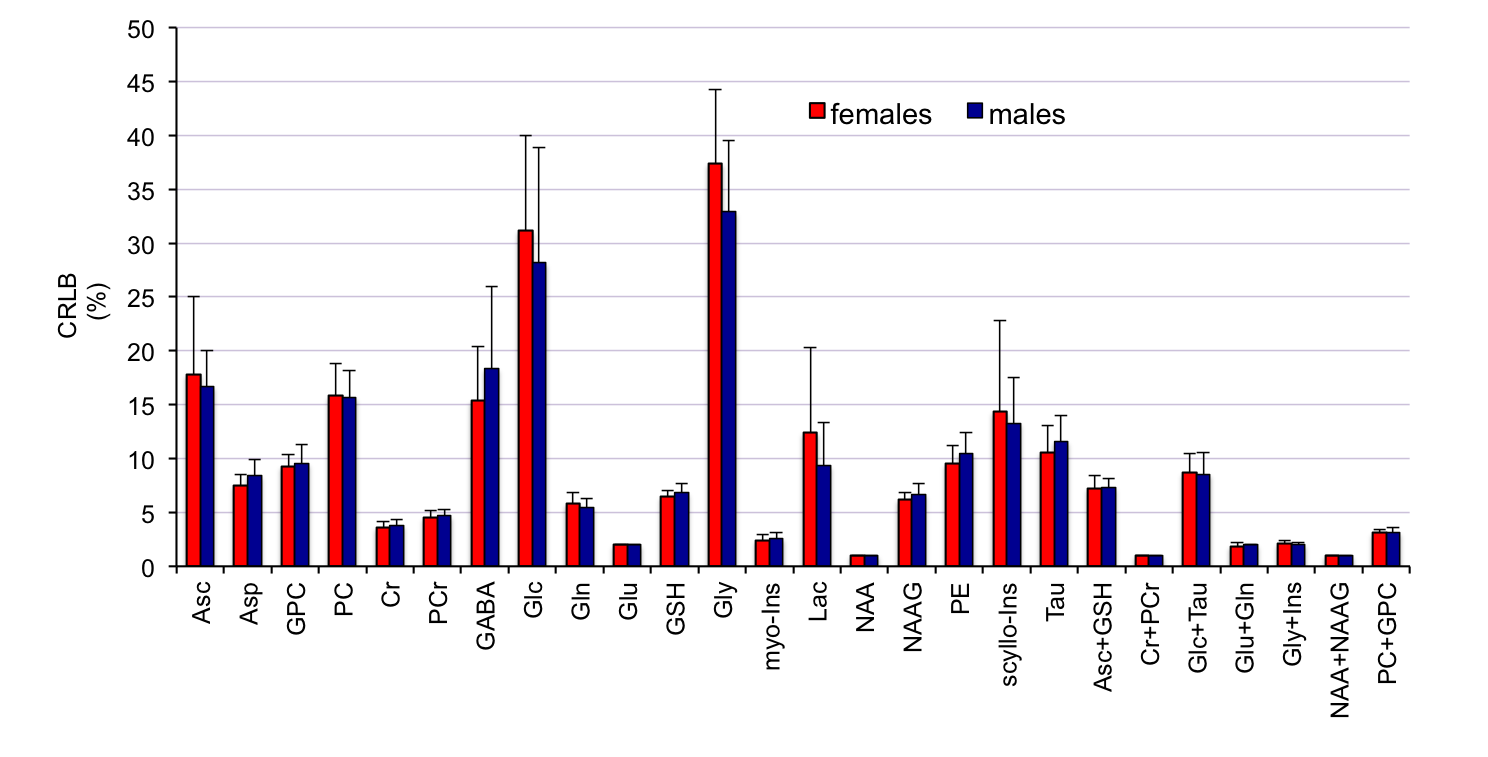
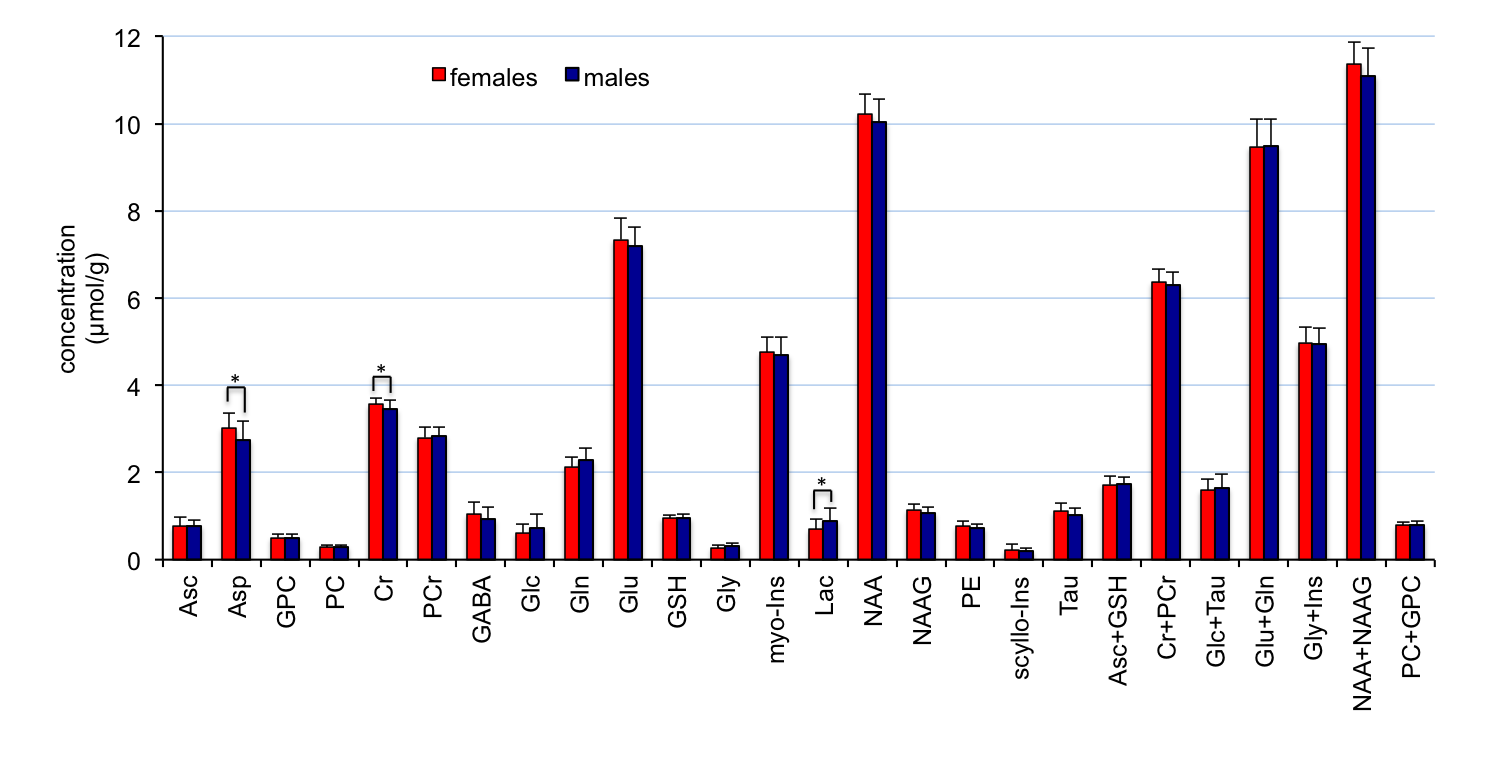
High spectral quality was consistently obtained in all subjects (Figure 1). No significant difference in signal-to-noise ratio (measured in frequency domain as ratio of the NAA methyl resonance at 2.02 ppm and root mean square of the noise on the summed spectrum) was observed between females (223±34) and males (199±26). The average linewidth of unsuppressed water spectra was similar in the two groups (14.0±1.1 Hz vs. 13.7±1.1 Hz for males and females, respectively). Ten metabolites were quantified with CRLB below 10%, 7 other metabolites below 20%; Glc and Gly had average CRLB<40% (Figure 2). No group-differences in CRLBs were observed. Few metabolites showed a trend of sex-related differences, including lower aspartate (Δ = - 0.26 µmol/g, p=0.01), lower creatine (Δ = - 0.11 µmol/g, p=0.03) and higher lactate (Δ =0.19 µmol/g, p=0.02) in males versus females. However, no significant group differences were observed for any of the measured 19 metabolites when taking into account the adjustment of false discovery rates (Figure 3).Discussion
In agreement with some3, 4 but not all1,2 previous reports, our data demonstrated no significant effect of sex on brain metabolite concentrations in the primary visual cortex of healthy young individuals. However, we cannot rule out region-specific sex differences outside the occipital cortex3. In addition, our results did not take into account hormonal factors that might affect GABA concentration.6, 7Conclusions
The results of this study provided reliable evidence of no major sex differences in neurochemical profile between young males and females studied with highly sensitive 7T MRS methodology.Acknowledgements
P41 EB015894, P30 NS076408, R03NS082541References
1. Wilkinson ID, Paley MN, Miszkiel KA, Hall-Craggs MA, Kendall BE, Chinn RJ et al. Cerebral volumes and spectroscopic proton metabolites on MR: is sex important? Magnetic resonance imaging 1997; 15(2): 243-8.
2. Charles HC, Lazeyras F, Krishnan KR, Boyko OB, Patterson LJ, Doraiswamy PM et al. Proton spectroscopy of human brain: effects of age and sex. Prog Neuropsychopharmacol Biol Psychiatry 1994; 18(6): 995-1004.
3. Pouwels PJ, Frahm J. Regional metabolite concentrations in human brain as determined by quantitative localized proton MRS. Magn Reson Med 1998; 39(1): 53-60.
4. Komoroski RA, Heimberg C, Cardwell D, Karson CN. Effects of gender and region on proton MRS of normal human brain. Magnetic resonance imaging 1999; 17(3): 427-33.
5. Mangia S, Tkac I, Gruetter R, Van De Moortele PF, Giove F, Maraviglia B et al. Sensitivity of single-voxel 1H-MRS in investigating the metabolism of the activated human visual cortex at 7 T. Magnetic resonance imaging 2006; 24(4): 343-8.
6. Sanacora G, Mason GF, Rothman DL, Behar KL, Hyder F, Petroff OA et al. Reduced cortical gamma-aminobutyric acid levels in depressed patients determined by proton magnetic resonance spectroscopy. Arch Gen Psychiatry 1999; 56(11): 1043-7.
7. Epperson CN, Haga K, Mason GF, Sellers E, Gueorguieva R, Zhang W et al. Cortical gamma-aminobutyric acid levels across the menstrual cycle in healthy women and those with premenstrual dysphoric disorder: a proton magnetic resonance spectroscopy study. Arch Gen Psychiatry 2002; 59(9): 851-8.
Figures