3002
The use of weighted averaging in spectroscopy studies improves statistical power1Department of Physiology, Anatomy & Genetics, University of Oxford, Oxford, United Kingdom, 2Oxford Centre for Clinical Magnetic Resonance Research, University of Oxford, Oxford, United Kingdom, 3Department of Physics, University of Oxford, Oxford, United Kingdom, 4PulseTeq Limited, Surrey, United Kingdom
Synopsis
In vivo MR spectroscopy is often characterised by a spectral signal-to-noise ratio (SNR) that varies highly between experiments, particularly when investigating non-proton nuclei. A common design for spectroscopic studies is to compare the ratio of two spectral peak amplitudes between groups, e.g. individual PCr/$$$\gamma$$$-ATP ratios in phosphorus MRS, or bicarbonate-to-pyruvate ratios in hyperpolarized $$$^{13}$$$C MRS. The uncertainty on this ratio is often neglected. We show that the correct propagation of this uncertainty improves statistical power.
Purpose
Typically, in vivo magnetic resonance spectroscopy (MRS) studies aim to determine an underlying biological difference between groups of subjects by comparing quantities of interest that are computed from spectra acquired from multiple individuals. For example, the ratio of the amplitude of a small molecule spectral peak to a concentration standard is commonly computed per individual, such as the phosphocreatine to ATP (PCr/ATP) ratio in cardiac 31P-MRS,[1] or the 13C-bicarbonate to 13C-pyruvate ratio in hyperpolarised 13C-MRS.[2]
MRS studies are typically characterised by a highly variable signal-to-noise ratio between individuals and over time, resulting in acquired data that is of variable quality. Most spectroscopic quantification algorithms such as AMARES,[3] VARPRO,[4] or Bayesian methods[5,6] return an estimate of the measure of uncertainty in the resultant fitting of spectral peaks: AMARES returns the Cramér-Rao Lower Bound (CRLB) of amplitude uncertainty directly;[7,8] for Bayesian methods such a measure of uncertainty would be the width of the posterior probability distribution function.[9] Often this uncertainty is used as an inclusion threshold in spectroscopy studies.[10] We wished to investigate the effect of population-level weighted averaging using quantification uncertainty as the weights.
Theory and Methods
Theory: Spectral fitting algorithms return quantities of interest and estimates of uncertainty on those parameters, typically the CRLB derived from the Fisher information matrix of the fit, $$$\mathbf{F}_{ij}$$$.
It can be shown that given two peaks of amplitude $$$x$$$ and $$$y$$$ with associated CRLBs $$$\sigma_x$$$ and $$$\sigma_y$$$ where $$$\sigma_x/x\ll1$$$ and $$$\sigma_y/y\ll1$$$, and neither $$$x$$$ nor $$$y$$$ are close to zero (i.e. 'errors are small'), then the distribution of their ratio is approximated by the normal distribution with mean $$$\mu=x/y$$$.[11] In this case, the width of the distribution is$$\sigma_i\approx\frac{x}{y}\sqrt{\left(\frac{\sigma_x}{x}\right)^2+\left(\frac{\sigma_y}{y}\right)^{2}-2\rho\frac{\sigma_x}{x}\frac{\sigma_y}{y}}$$where $$$\rho=\mathbf{F}_{ij}^{-1}/\sqrt{\mathbf{F}_{ii}^{-1}\mathbf{F}_{jj}^{-1}},\,\rho\in[0,\,1]$$$.
An elementary statistical result is that an unbiased estimator for the mean ($$$\bar{r}$$$) of the population of these ratiometric measurements is given by the weighted sum$$\bar{r}=\frac{\displaystyle\sum_{i}^{n}\frac{\mu_i}{\sigma_{i}^{2}}}{\displaystyle\sum_{i}^{n}\frac{1}{\sigma_{i}^{2}}}$$ and the variance of the population, given the uncertainty on each measurement, is estimated by$$\bar{\sigma}^{2}_{r}=\left(\displaystyle\sum_{i}^{n}\frac{1}{\sigma_{i}^{2}}\right)\left(\left(\displaystyle\sum_{i}^{n}\frac{1}{\sigma_{i}^{2}}\right)^2-\displaystyle\sum_{i}^{n}\left(\frac{1}{\sigma_{i}^{2}}\right)^2\right)^{-1}\sum_{i=1}^{n}\frac{(\mu_i-\bar{r})^2}{\sigma_{i}^2},$$where $$$n$$$ is the number of measurements made. Statistical tests (e.g. $$$t$$$-tests) can then be performed using $$$\bar{\sigma}_r$$$.
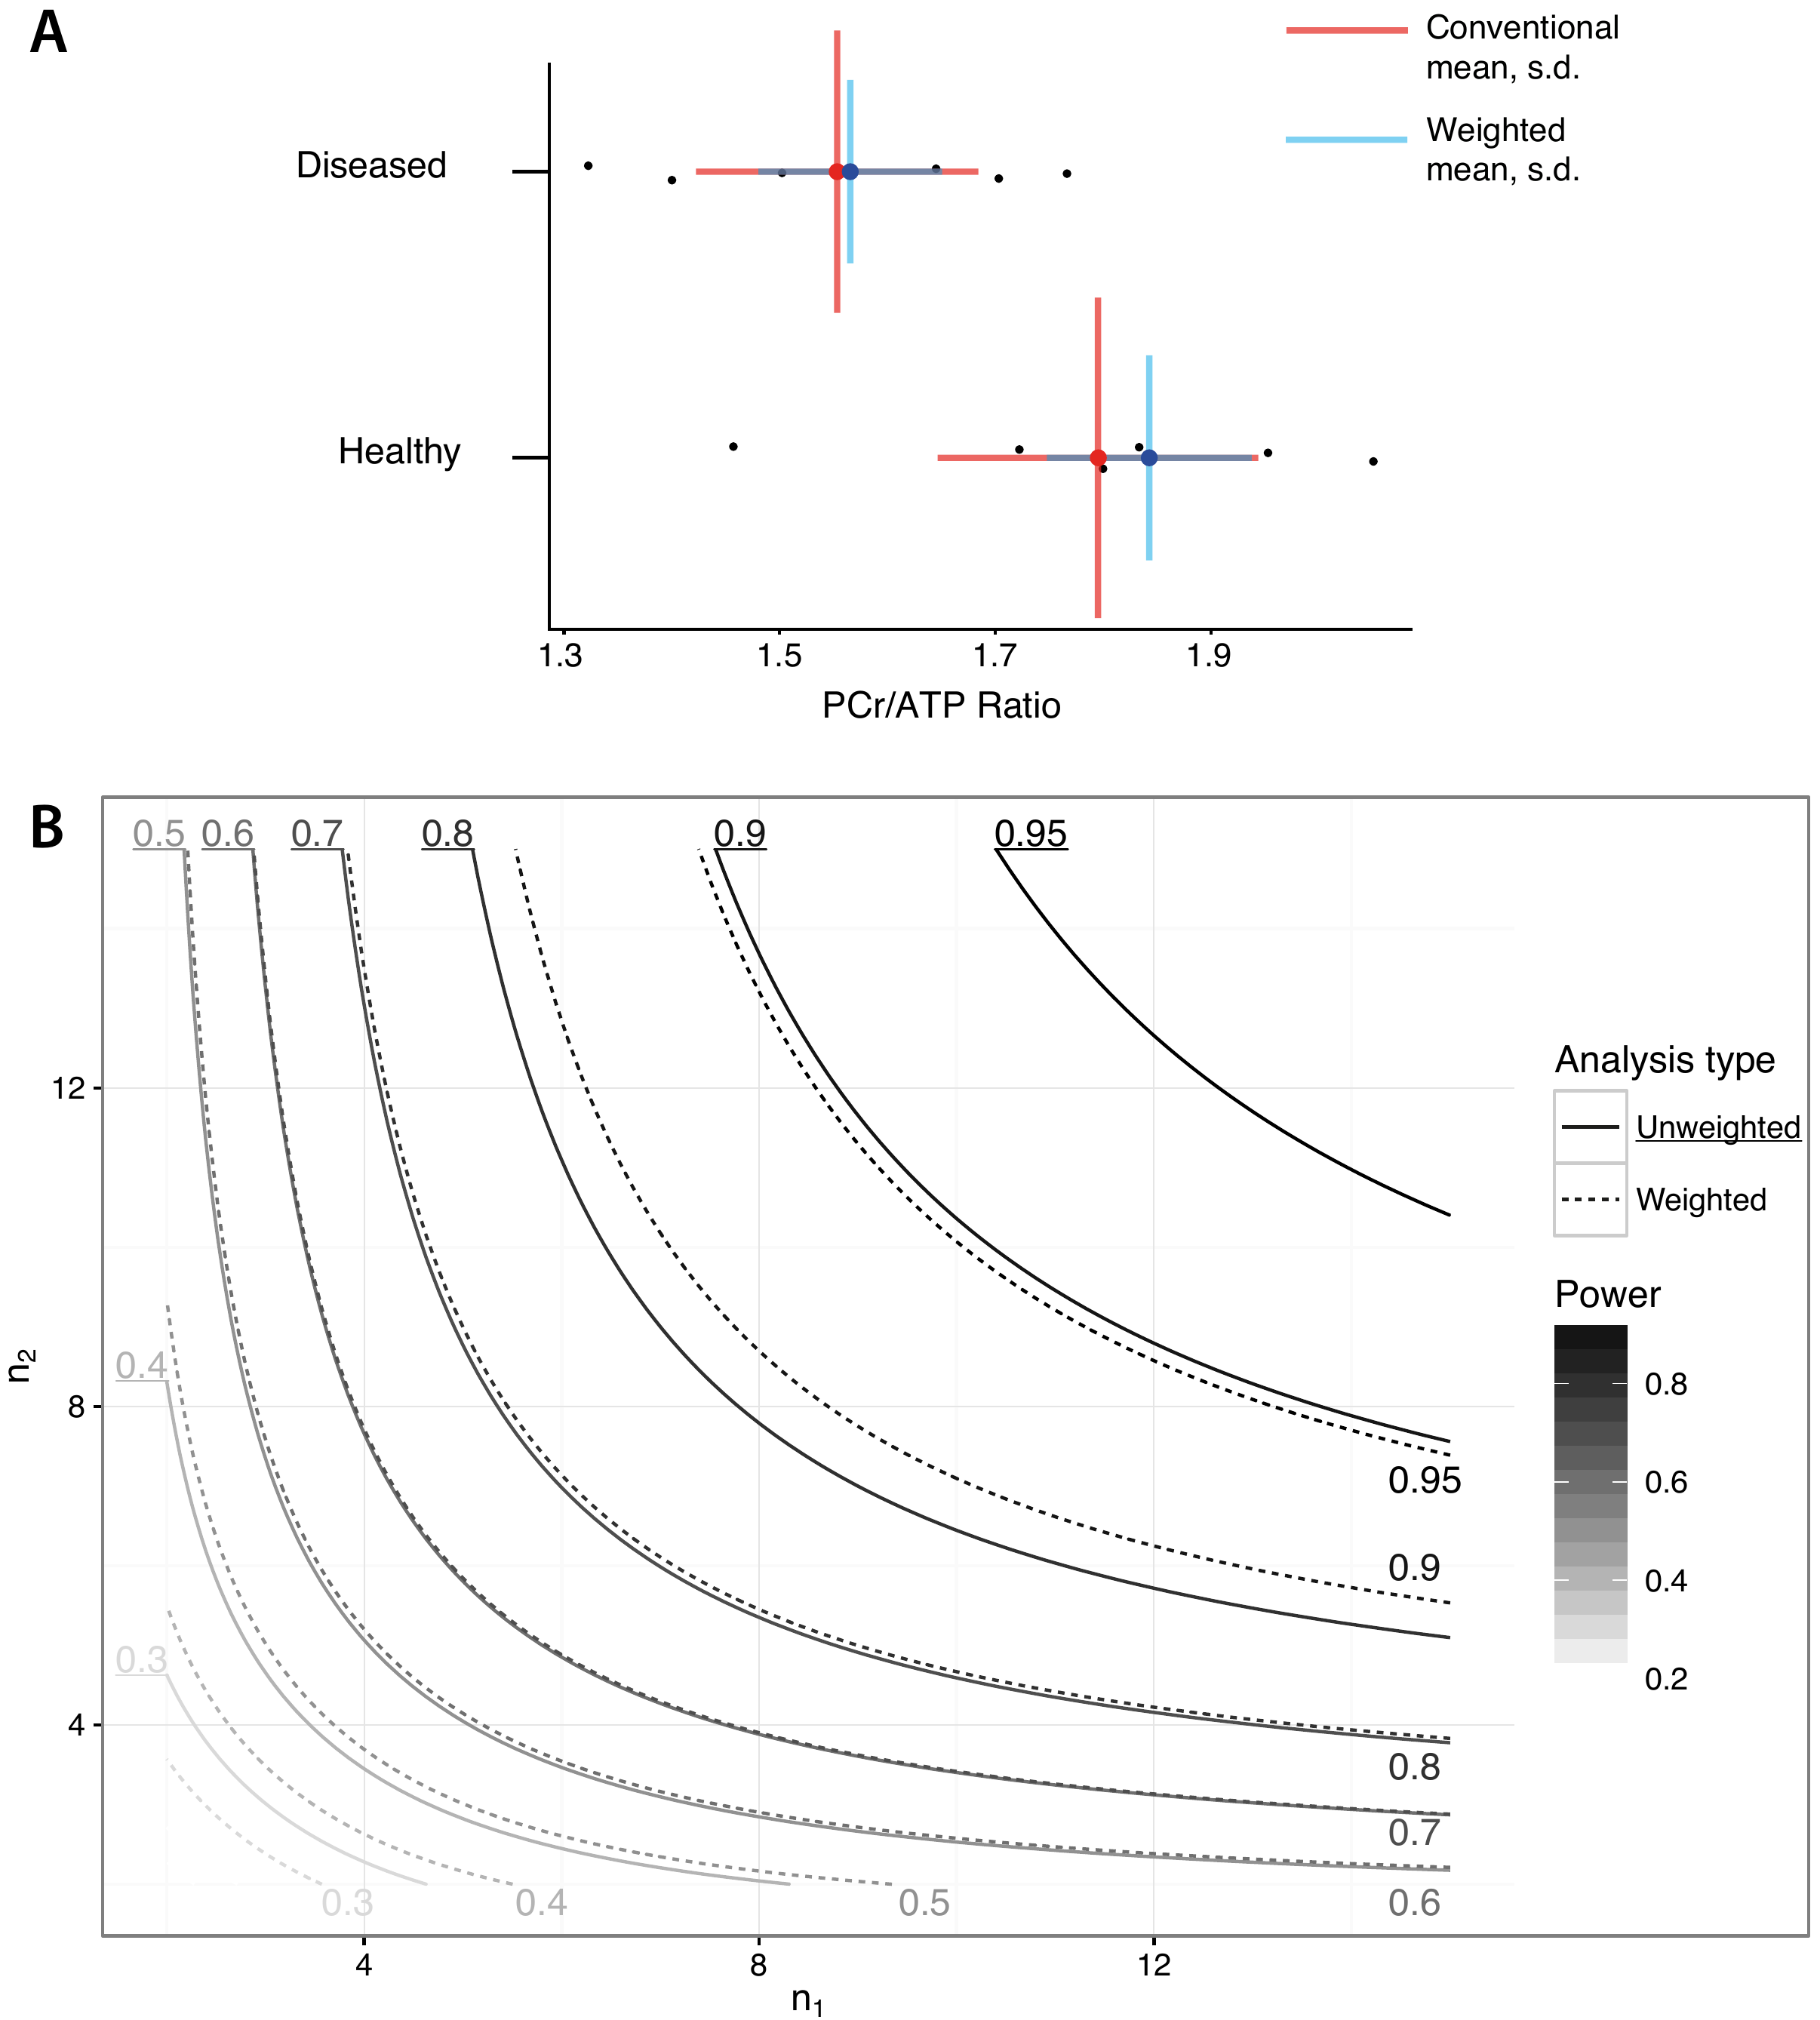
Simulation: Two populations ($$$n=6$$$) of $$$^{31}$$$P cardiac MRS spectra were generated. One population was nominally "healthy" in which the population PCr/$$$\gamma$$$-ATP peak ratio was taken to be $$$1.95$$$ exactly, and one nominally "diseased", where PCr/$$$\gamma$$$-ATP was $$$1.6$$$. Spectra were fitted with AMARES and then population-level weighted averaging performed as above.
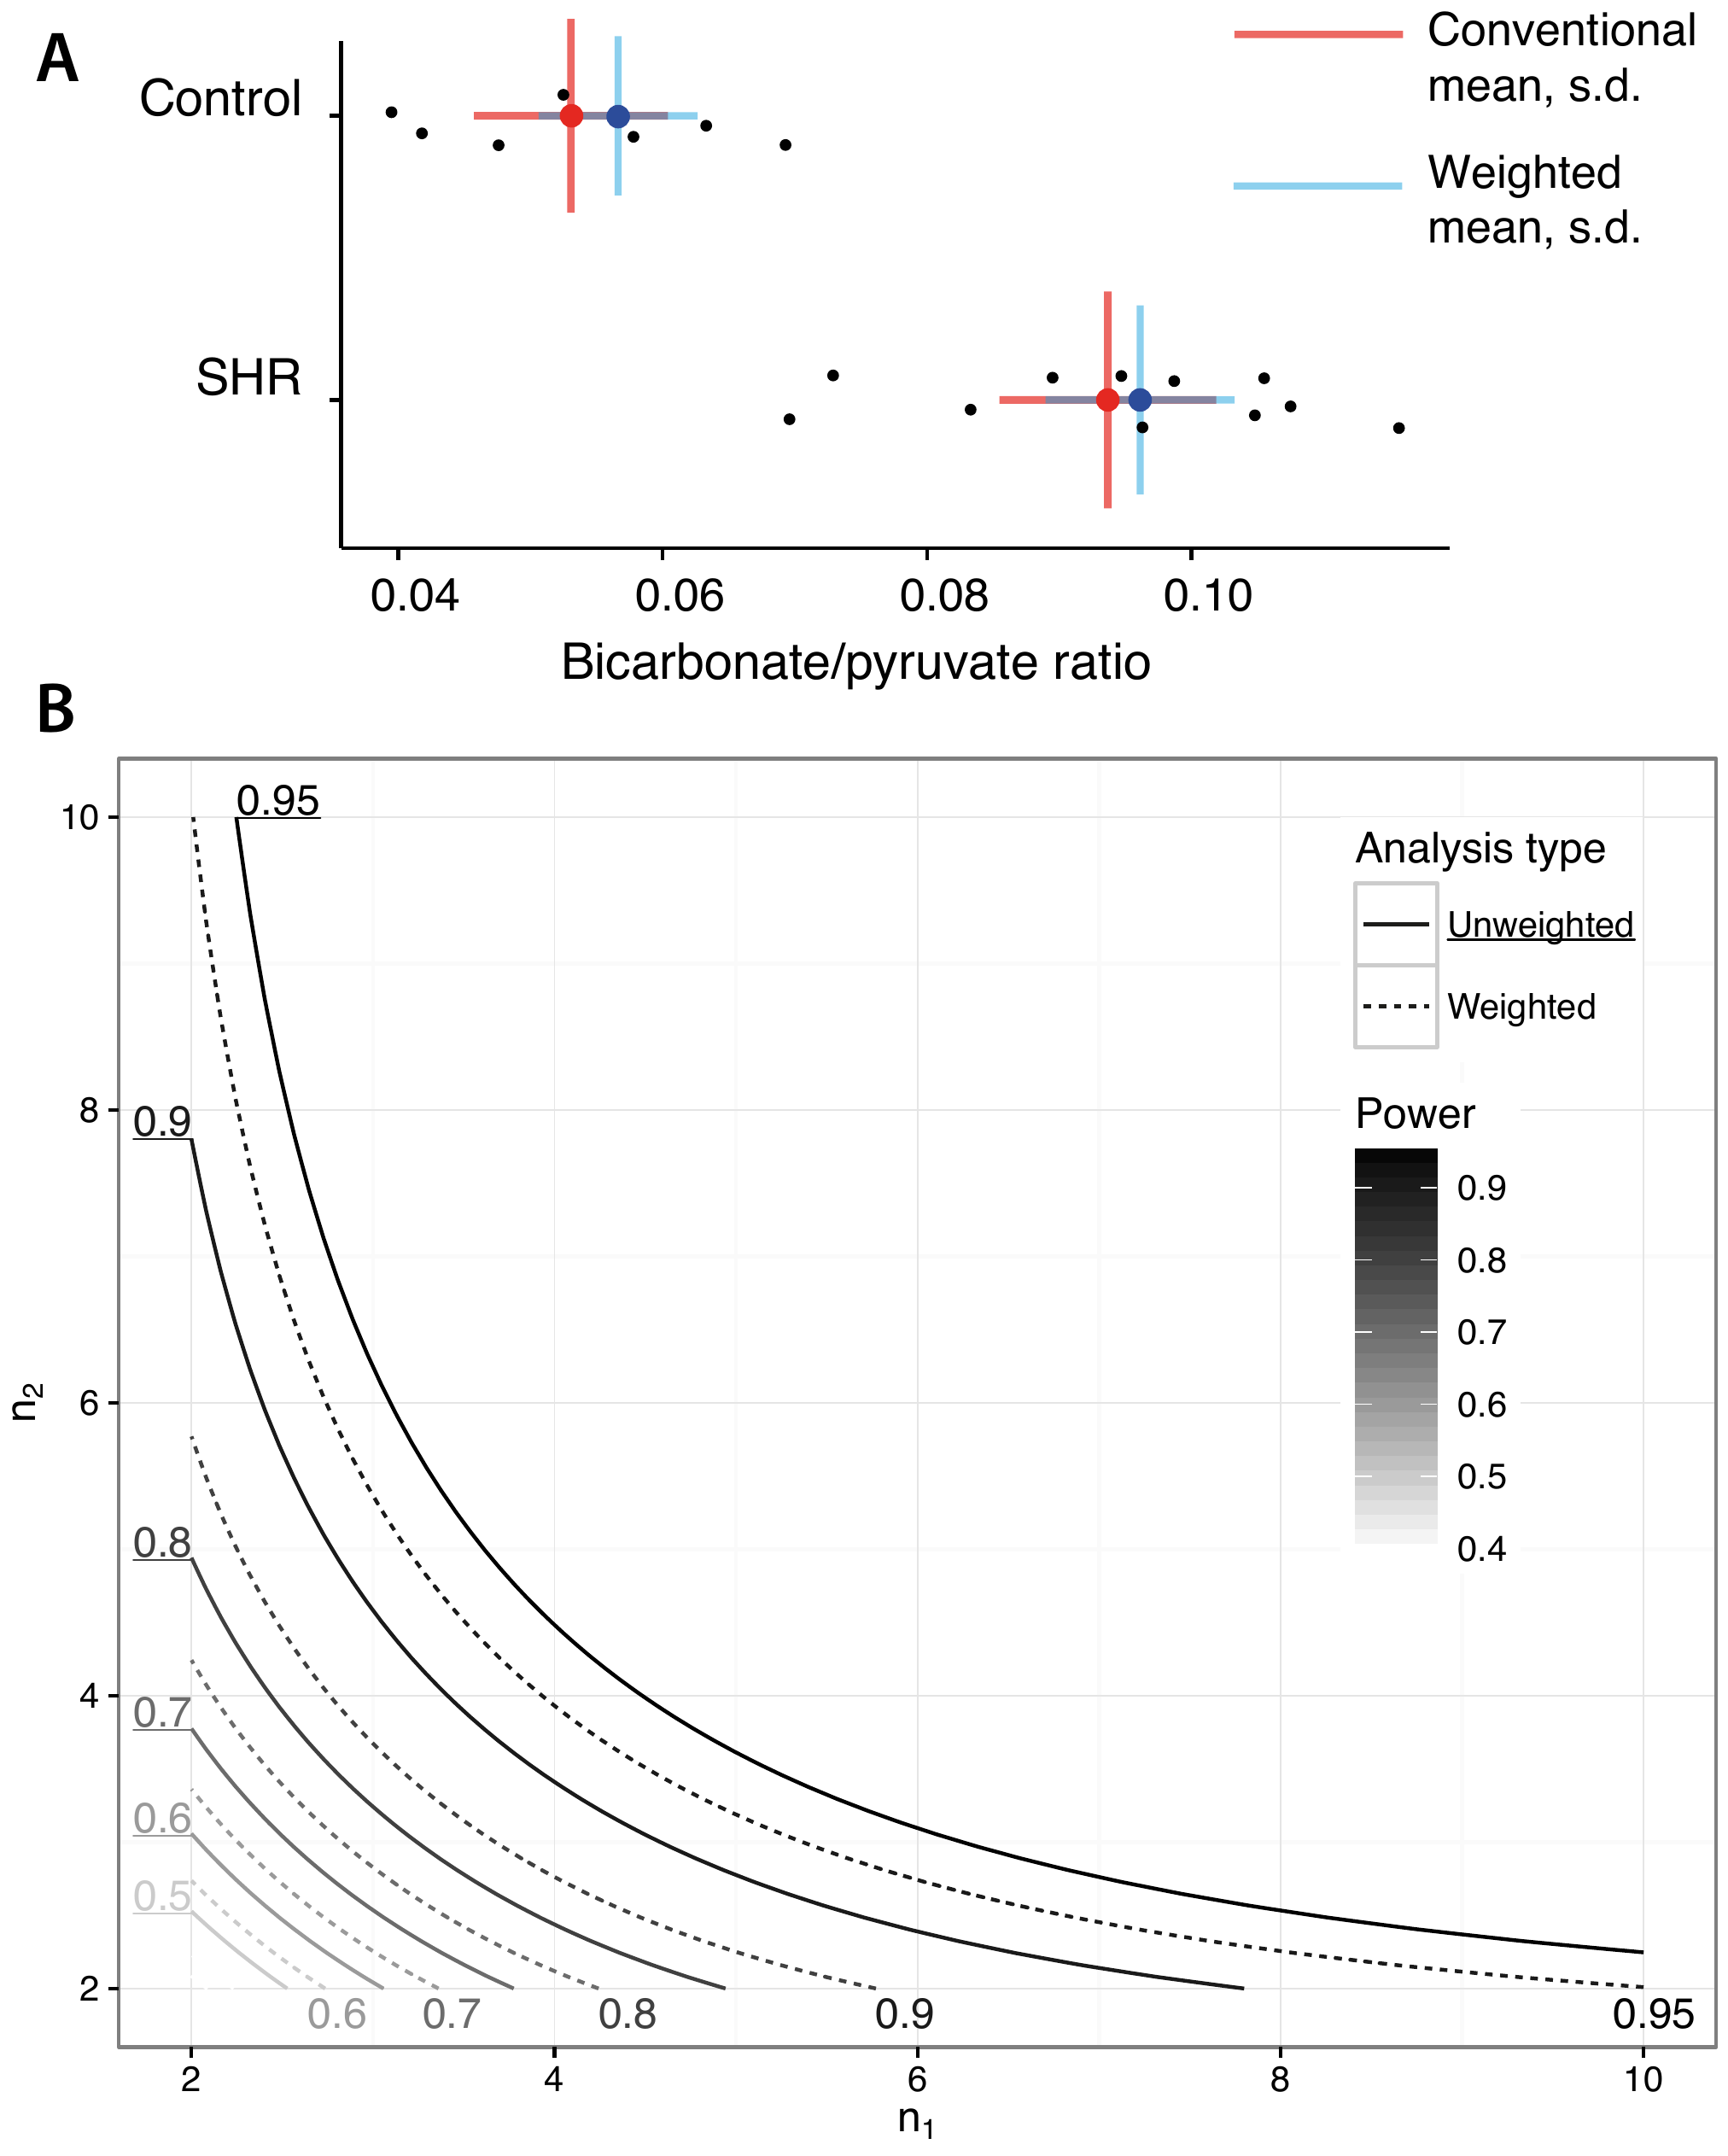
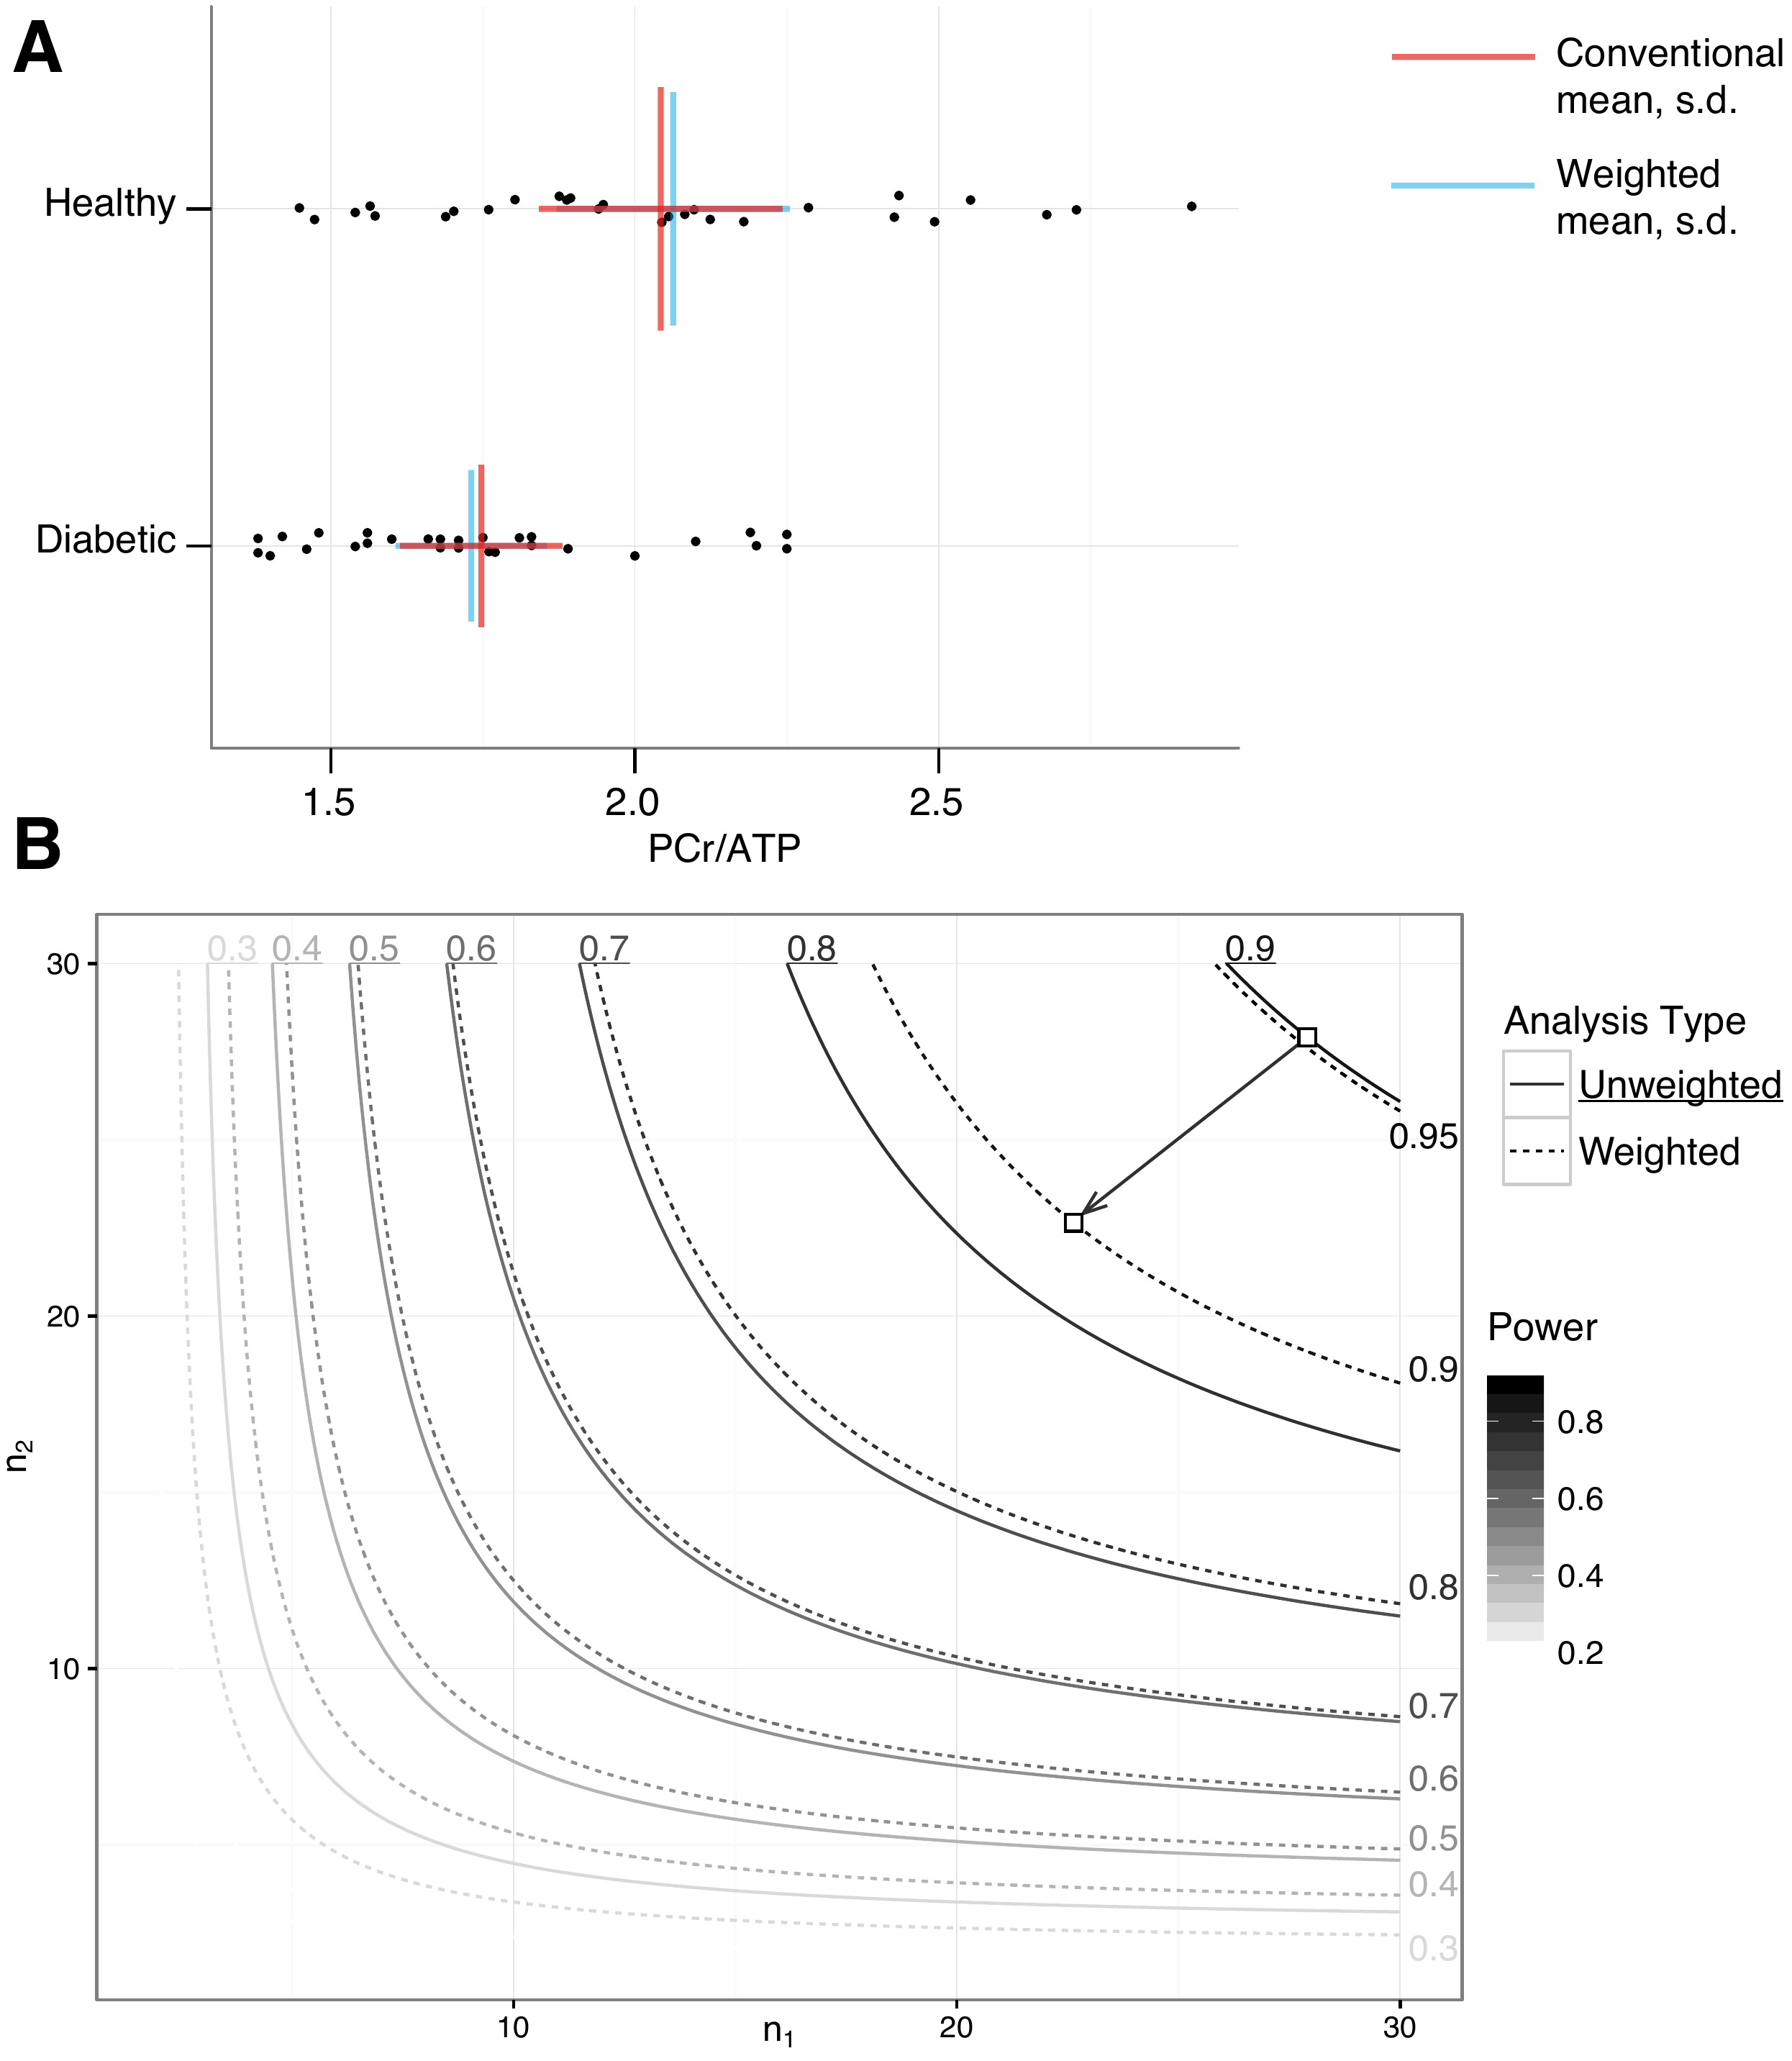
Retrospective analysis: The authors of two previously published spectroscopy studies were contacted and asked to provide data for re-analysis: Dodd et al.[12] in which a study of hyperpolarized pyruvate metabolism was investigated in the SHR rat (and the bicarbonate/pyruvate ratio reported), and Levelt et al.,[13] in which the myocardial PCr/ATP ratio of type-2 diabetics is shown to be distinct from that of controls. Spectra were re-analysed as outlined above.
Results
The correct propagation of uncertainty improved statistical power in all groups considered.
Simulation: The unweighted mean and standard deviation of the 'healthy' and 'diseased' groups were $$$1.80\pm0.21$$$ and $$$1.56\pm0.18$$$ respectively, compared with weighted estimates of $$$1.84\pm0.04$$$ and $$$1.57\pm0.03$$$, which is graphically illustrated in Fig. 1. Accordingly, the estimated $$$g^*$$$ effect size increased from $$$1.519$$$ to $$$1.703$$$, and the $$$p$$$ value returned from a $$$t$$$-test between the two groups was $$$p=0.051$$$ when data were given equal weight, or $$$0.024$$$ if uncertainty propagated as proposed. The estimated mean did not appreciably change.
Retrospective analyses: As illustrated in Fig. 2, weighted averaging reduced the population variance in SHR animals from $$$2.1\times10^{-4}$$$ to $$$2.0\times10^{-4}$$$, and in control animals from $$$1.4\times10^{-4}$$$ to $$$1.2\times10^{-4}$$$. The mean changed slightly, from $$$0.053$$$ to $$$0.057$$$ in control animals, and from $$$0.094$$$ to $$$0.096$$$ in SHR animals, and Student's $$$p$$$ decreased by a factor of 46 by using weighted averaging.
For the diabetic PCr/ATP ratio, the use of weighted averaging reduced $$$\sigma$$$ by $$$\sim7\%$$$, increased the $$$g^*$$$ effect size from $$$0.884$$$ to $$$0.985$$$, and reduced the $$$p$$$ value from $$$0.0031$$$ to $$$0.00058$$$ (Fig. 3).
Discussion
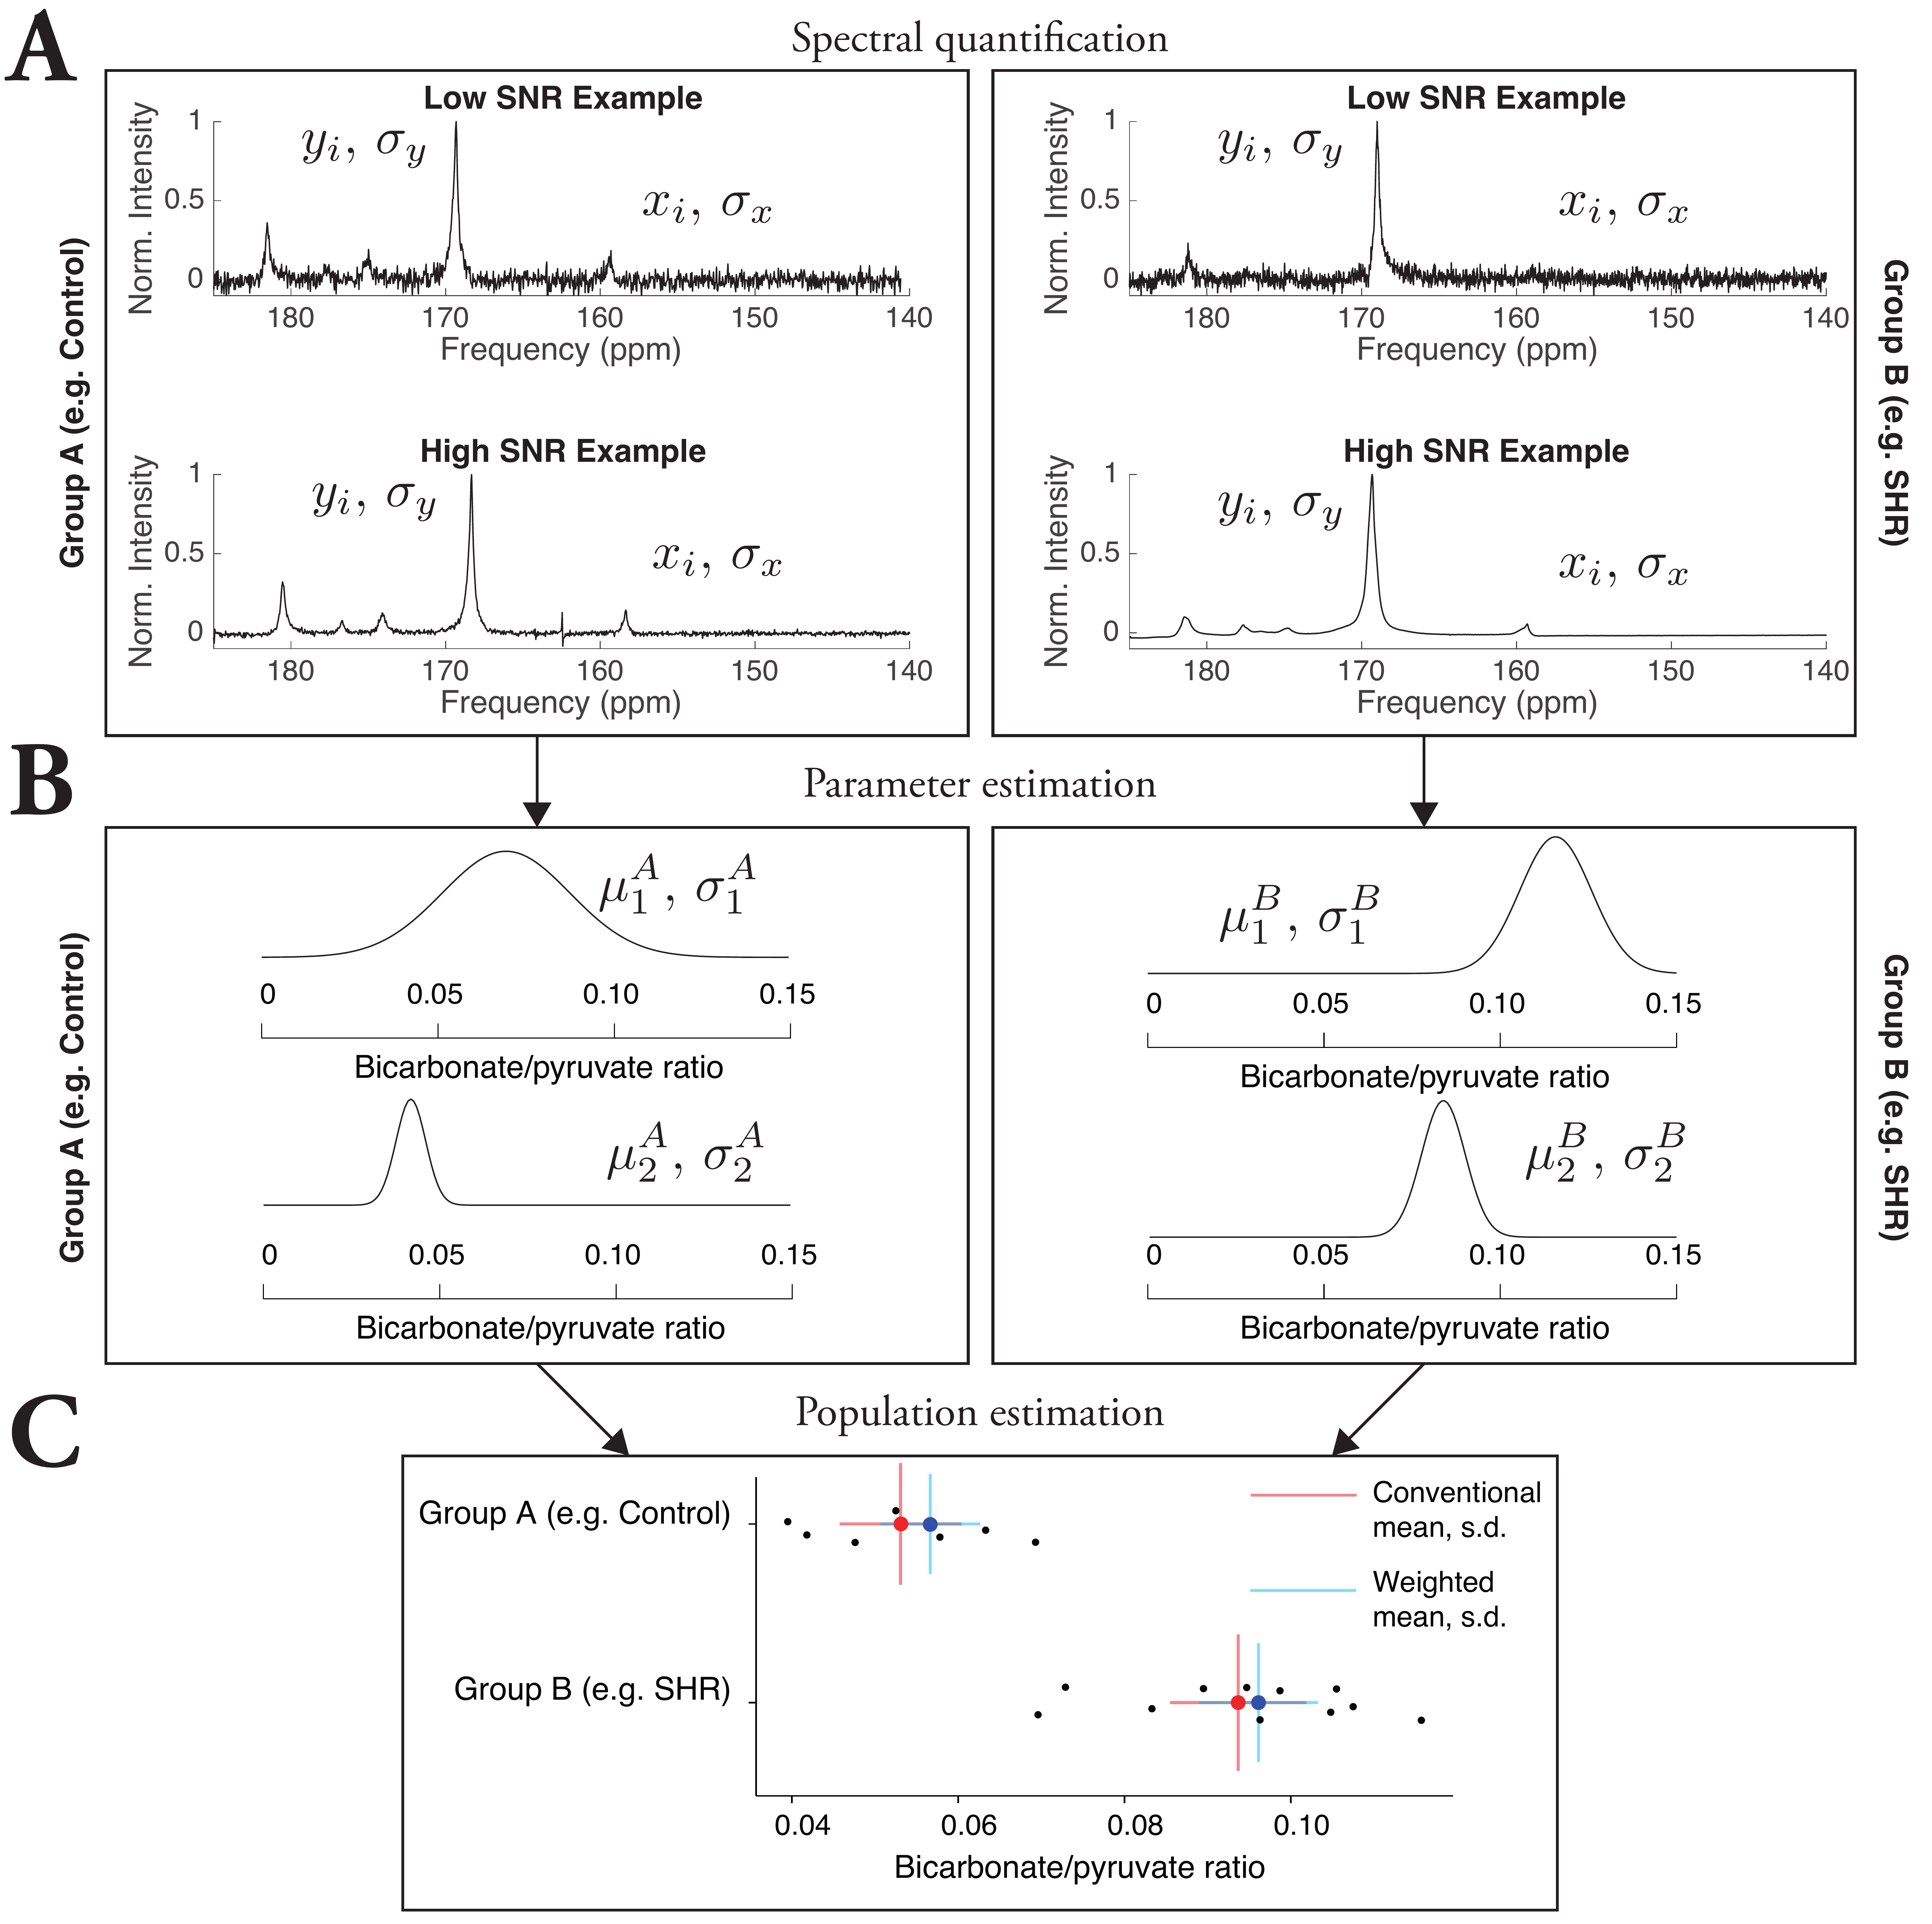
Variation in spectral quality occurs on physical grounds, and therefore variation in the quantification uncertainty of MRS spectra should not be neglected. These short examples have demonstrated the benefits of correctly propagating uncertainty in spectroscopy studies, improving statistical power in a mathematically justified fashion (summarised in Fig. 4). This increase in power implies that $$$n$$$ could be reduced without compromising power, and additionally the ability to use data that may have failed to meet an inclusion threshold could mean a reduction in scan time and/or unused datasets.Conclusion
It is proposed that the study-level adoption of methods that incorporate estimates of uncertainty will allow the maximal use of data that has been acquired with varying precision.Acknowledgements
The authors would like thank their collaborators for providing their original data openly and freely; Prof. Christopher Rodgers for a fruitful discussion on this matter, financial support from St. Hugh's College, Oxford, and an EPSRC Doctoral Training Centre Grant and Doctoral Prize Fellowship (refs. EP/J013250/1 and EP/M508111/1). We also acknowledge financial support from the British Heart Foundation (Fellowships FS/10/002/28078 & FS/11/50/29038, Programme Grant RG/11/9/28921, Programme Grant RG/07/004/22659) and NVidia corporation for the gift of a GPU.References
[1] M. Scheuermann-Freestone, P. L. Madsen, D. Manners, A. M. Blamire, R. E. Buckingham, P. Styles, G. K. Radda, S. Neubauer, K. Clarke, Circulation June 2003, 107, 3040–6.
[2] C. J. Daniels, M. A. McLean, R. F. Schulte, F. J. Robb, A. B. Gill, N. McGlashan, M. J. Graves, M. Schwaiger, D. J. Lomas, K. M. Brindle, F. A. Gallagher, NMR Biomed. Apr. 2016, 29, 387–399.
[3] L. Vanhamme, van den Boogaart A, Van Huffel S, J. Magn. Reson. Nov. 1997, 129, 35–43.
[4] J. W. C. van der Veen, R. de Beer, P. R. Luyten, D. van Ormondt, Magn. Reson. Med. Jan. 1988, 6, 92–98.
[5] J. Kotyk, N. Hoffman, W. Hutton, G. L. Bretthorst, J. J. H. Ackerman, J Magn Reson S A Sept. 1995, 116, 1–9.
[6] J. J. Kotyk, N. G. Hoffman, W. C. Hutton, G. Larry Bretthorst, J. J. H. Ackerman, J. Magn. Reson. July 1992, 98, 483–500.
[7] S. Cavassila, S. Deval, C. Huegen, van Ormondt D, D. Graveron-Demilly, J. Magn. Reson. Apr. 2000, 143, 311–320.
[8] S. Cavassila, S. Deval, C. Huegen, D. van Ormondt, D. Graveron-Demilly, NMR Biomed. June 2001, 14, 278–283.
[9] M. F. Ochs, R. S. Stoyanova, F. Arias-Mendoza, T. R. Brown, J. Magn. Reson. Mar. 1999, 137, 161– 76.
[10] W. T. Clarke, M. D. Robson, C. T. Rodgers, Magn. Reson. Med. Oct. 2015, 00, 1–12.
[11] V. H. Franz, ArXiv arXiv:0710 Oct. 2007, 60.
[12] M. S. Dodd, D. R. Ball, M. A. Schroeder, L. M. Le Page, H. J. Atherton, L. C. Heather, A.-M. Seymour, H. Ashrafian, H. Watkins, K. Clarke, D. J. Tyler, Cardiovasc. Res. July 2012, 95, 69–76.
[13] E. Levelt, C. T. Rodgers, W. T. Clarke, M. Mahmod, R. Ariga, J. M. Francis, A. Liu, R. S. Wijesurendra, S. Dass, N. Sabharwal, M. D. Robson, C. J. Holloway, O. J. Rider, K. Clarke, T. D. Karamitsos, S. Neubauer, Eur. Heart J. Sept. 2015, 23, ehv442.
Figures