3001
Diurnal effects on brain MRI volume and 1D MR neurospectroscopy1Department of Medical Radiation Sciences, Newcastle University, Newcastle, Australia, 2Department of Neurology, John Hunter Hospital, Newcastle, Australia, 3Newcastle University, Newcastle, Australia, 4Hunter Medical Research Institute, Newcastle, Australia
Synopsis
Our major aim of this study was to to evaluate diurnal effects on two key MR metrics; total brain volume and neurometabolite profiles. Repeated 3D-MPRAGE and 1D-MRS were undertaken over a 10-hour period on 10 healthy subjects (aged 36.1±7.7 years). Volumetric analysis, using vendor segmentation software, did not reveal any statistically significant effect of time of day or sex on total brain volume. Spectral data processing and analysis using LCModel showed a mild increase in glycerophosphocholine and total choline levels between 7am and 12pm. Our study suggested a lack of significant diurnal effect on these parameters.
Introduction
The diagnosis and clinical management of neurodegenerative diseases, such as Multiple Sclerosis (MS) and Alzheimer’s disease, rely heavily on the use of high resolution magnetic resonance imaging (MRI). Novel applications of MRI have recently been developed in an attempt to further understand the underlying pathophysiological mechanisms associated with such conditions and to improve medical management and treatment strategies.1H Magnetic Resonance Spectroscopy (1H-MRS) is a non-invasive technique enabling neurometabolite changes to be evaluated 1. MR-based brain volume changes (atrophy) have been associated with disease progression 2. The diagnostic and clinical usefulness of such parameters are dependent on the robustness of the MR techniques applied to derive reliable and reproducible measurements. One possible factor that needs to be considered is the potential impact of diurnal effects on brain volume and neurometabolite levels. Indeed, other studies have suggested that diurnal effects influence brain volume 3 as well as brain metabolites 4.
In the current study, we undertook repeated 3D Magnetization Prepared Gradient Echo (MPRAGE) scans and 1D single voxel spectroscopy (1D-SVS) over a 10-hour period to determine diurnal changes in total brain volume and neurometabolite profiles in the posterior cingulate gyrus (PCG) in healthy people.
Purpose
The main objective of this study was to determine if total brain volume and neurometabolite levels are altered diurnally and whether this needs to be considered in the evaluations of brain atrophy and neurometabolite profiles in neurodegenerative diseases.Material and methods
10 healthy control subjects (HCs), 5 males and 5 females (36.1±7.7 years) signed written consent prior to participating in this study which was approved by the local ethics committee. Participants were scanned at 7am (T1), 12pm (T2) and 5pm (T3) on the same day using a 3 tesla MRI scanner (Prisma, Siemens Healthcare, Germany) equipped with a 64 channel head and neck coil. Isotropic MPRAGE (TR/TE/TI=2000/3.5/1100 ms, FOV: 256x256 mm, voxel size: 1mm3) was undertaken on each participant at each time point. Volumetric analysis was carried out using Siemens auto segmentation software on the scanner console 5.
1D-SVS (point-resolved spectroscopy; PRESS), with water reference, was acquired with TR/TE: 2000/30ms, voxel size of (30x30x30 mm3), 96 averages, vector size: 1024, preparation scans: 4, delta frequency: 3.2ppm, with water suppression. 1D-SVS were processed and analysed by LCModel (v6.2-2B)6. Repeated measures ANOVAs (post-hoc Bonferroni adjustment) were used to evaluate the effect of time on outcomes (IBM SPSS statistics 24). One MRS data point (T3, female) was excluded as an outlier. MRS was also acquired from GE brain phantom 7 daily at three time points to correct for any scanner variations.
Results and Discussion
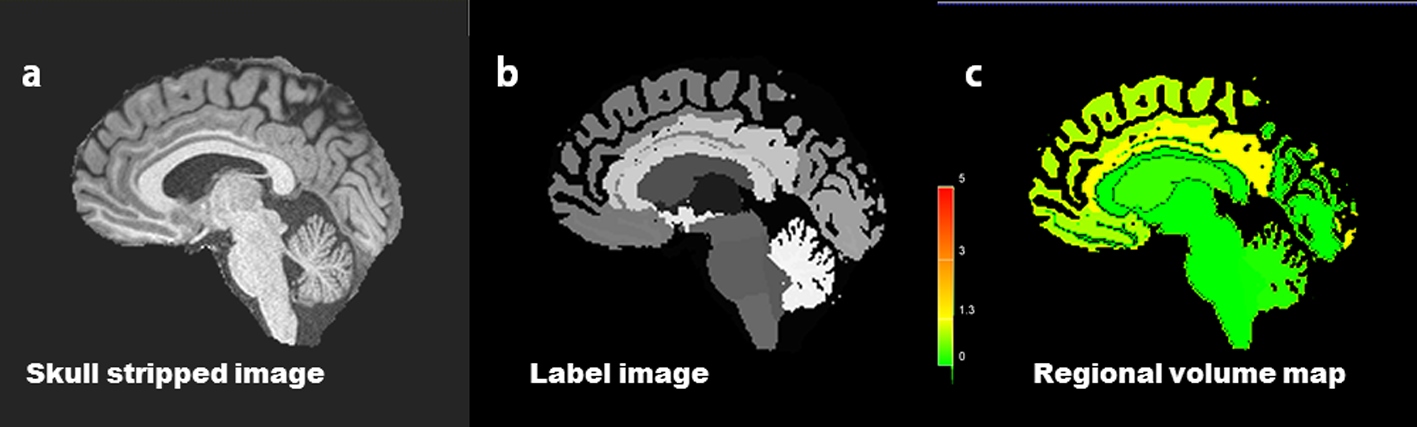
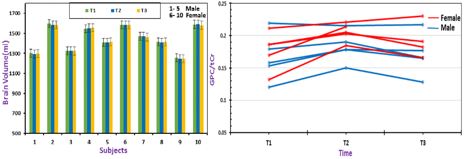
Figure 1 shows segmentation of MPRAGE using automatic segmentation software showing the skull stripped image (a), label image (b) and regional volume map (c). There was no statistically significant effect of time of day or gender (P=0.4, F=2.78) on brain volume. However, the average brain volume across all subjects decreased from T1 to T3 by 3.62 ml which is a variation of 0.25%; in agreement with other studies 3. Figure 2 (left) shows brain volume estimates for each volunteer at each time point.
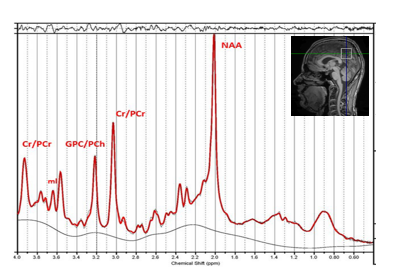
The analysis of a T1 MR spectrum from the PCG voxel is shown in Figure 3. Of all metabolites analyzed, significant diurnal effects were only seen for glycerophosphocholine (GPC, +13%, P=0.007) and total choline levels (tCho=GPC+PCh, +1.4%, P=0.02) both of which increased between time point 2 compared to 1. Sex did not impact on neurometabolite levels. GPC is a known a cerebral osmolyte, where an increase in concentration can be associated with progression throughout the day in response to osmotic regulation 8. Figure 2 (right) shows diurnal variations of GPC to total creatine. In vitro MRS experiments showed no statistically significant changes in metabolite levels at any time points supporting stable inter-scan results.
Conclusion
Our results suggest that there are no statistically significant differences in total brain volume and neurometabolites, except for choline-containing compounds, at different times of the day. Many factors have been reported by others to affect brain volume (i.e. hydration, age and gender) however, our study suggested a lack of a significant diurnal effect.Acknowledgements
Kate Skehan and Shiami Luchow are thanked for assistance in scanning subjects and Rodney A Lea for assistance with statistical analysis.References
1. Evans CJ, McGonigle DJ, and Edden RA. Diurnal stability of gamma-aminobutyric acid concentration in visual and sensorimotor cortex. J Magn Reson Imaging. 2010; 31(1): 204-9.
2. Sormani MP, Arnold DL, and De Stefano N. Treatment effect on brain atrophy correlates with treatment effect on disability in multiple sclerosis. Ann Neurol. 2014; 75(1): 43-9.
3. Nakamura K, Brown RA, Narayanan S, et al. Diurnal fluctuations in brain volume: Statistical analyses of MRI from large populations. Neuroimage. 2015; 118(126-32.
4. Soreni N, Noseworthy MD, Cormier T, et al. Intraindividual variability of striatal (1)H-MRS brain metabolite measurements at 3 T. Magn Reson Imaging. 2006; 24(2): 187-94.
5. Schmitter D, Roche A, Marechal B, et al. An evaluation of volume-based morphometry for prediction of mild cognitive impairment and Alzheimer's disease. Neuroimage Clin. 2015; 7(7-17.
6. Provencher S. LCModel1 & LCMgui User’s Manual. 2012;
7. Schirmer T and Auer DP. On the reliability of quantitative clinical magnetic resonance spectroscopy of the human brain. NMR Biomed. 2000; 13(1): 28-36.
8. Stefan B and Ashok P. MR Spectroscopy of Pediatric Brain Disorders: Springer Science & Business Media; 2012. 402 p
Figures