3000
In vivo quantification of glutathione T2 in the human brain at 7 Tesla using echo time extension with variable refocusing selectivity and symmetry1Biomedical Engineering, Columbia University School of Engineering and Applied Science, New York, NY, United States, 2Radiology and Biomedical Imaging, Yale University School of Medicine, New Haven, CT, United States, 3Biomedical Engineering, Yale University School of Medicine, New Haven, CT, United States, 4Radiology, Columbia University School of Engineering and Applied Science, New York, NY, United States, 5Neurology, Yale University School of Medicine, New Haven, CT, United States
Synopsis
The tripeptide glutathione (L-γ-glutamyl-L-cysteinyl glycine or GSH) is an endogenous antioxidant implicated in many neurological conditions, including multiple sclerosis. Its precise quantification by proton magnetic resonance spectroscopy is, however, hampered by its uncertain T2. Here, we present a method for the quantification of GSH T2 in the human brain at 7 Tesla using optimized echo time extension delays and variable refocusing selectivity and symmetry to maximize the intensity and specificity of J-difference-edited GSH signals predicted by a full density matrix description of signal behavior. Using this method, we measured a GSH T2 of 144.2 ± 5.5 ms that is considerably shorter than that calculated for either of two common reference metabolites NAA (221.9 ± 10.3 ms) or creatine (155.3 ± 5.9 ms), emphasizing the importance of considering T2 relaxation differences in the spectroscopic measurement of these metabolites at long echo times.
Purpose
The tripeptide glutathione (L-γ-glutamyl-L-cysteinyl glycine or GSH) is an endogenous antioxidant implicated in many neurological conditions, including multiple sclerosis.1 Its precise quantification by proton magnetic resonance spectroscopy is currently hampered by its uncertain T2 relative to those of reference signals like N-acetyl aspartate (NAA), creatine, or water. The robust measurement of spectroscopic GSH signal is complicated by a spin system exhibiting both weak and strong J-coupling as well as resonances that overlap those of several other biochemicals.2 Andreychenko et al. recently introduced a method to measure the T2 of GABA that variably extends echo time by refocusing J-modulation.3 The GABA H3,4 can be treated as an A2X2 spin system,4 and integration of the refocused weakly coupled signal directly reflects T2-induced exponential behavior. GSH cysteinyl, however, forms a strongly coupled ABX system,5 leading to complex signal behavior at long echo times even when weak coupling effects are mitigated by refocusing. Here, we present an extension of the method by Andreychenko for the quantification of GSH T2 in the human brain at 7 Tesla using full density matrix description of GSH signal behavior, combination of variable refocusing selectivity and symmetry, and numerical optimization of echo time extension delays to maximize the intensity and specificity of GSH signals isolated from surrounding resonances by J-difference editing (JDE).6Methods
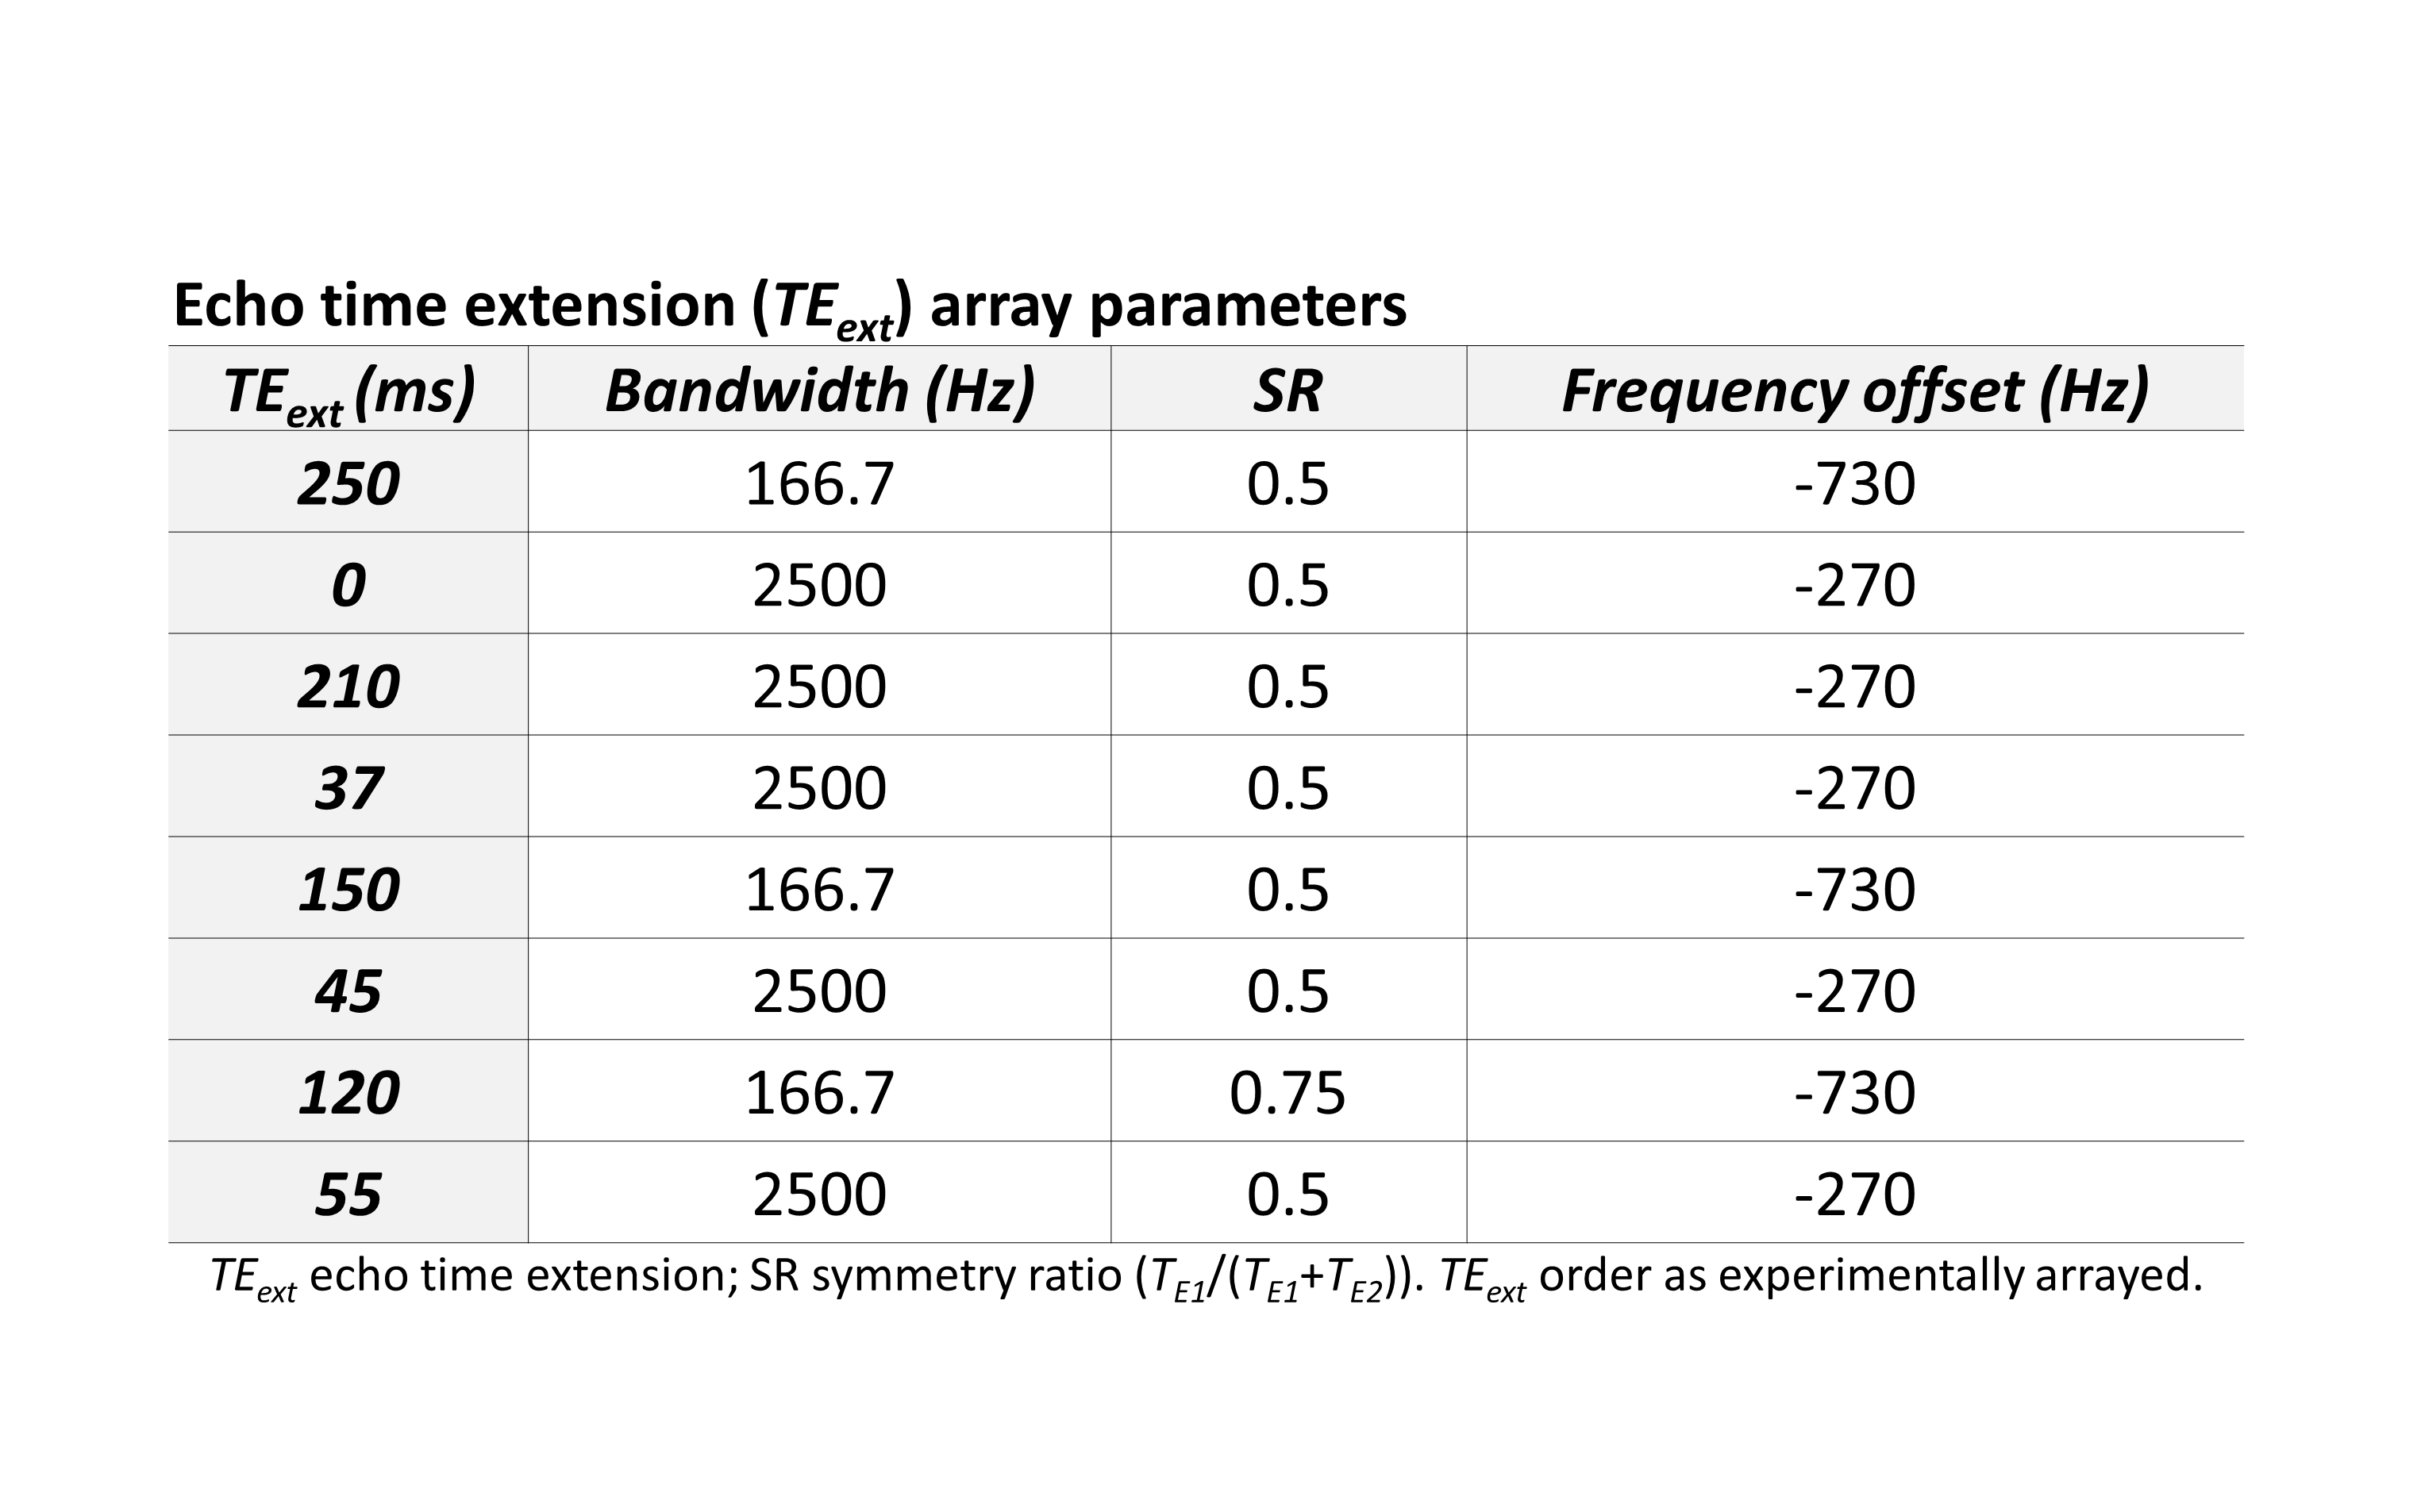
We estimated GSH T2 by appending arrays of variable echo time (TE) extensions to a J-difference-edited semi-LASER sequence (TE 72 ms)7 to quantify GSH signal at eight different echo times (Figure 1), modeling the result with a monoexponential decay curve solved for T2. The echo time was extended using pairs of adiabatic refocusing pulses to enable curve fitting to GSH signal magnitude across the eight TE points. Variable refocusing pulse bandwidth, TE symmetry, and frequency offset (Figure 2) were applied to maximize the specificity and magnitude of the JDE signals from GSH and co-edited NAA at each TE. All experimental spectra were obtained in a 7-Tesla magnetic resonance scanner (Varian Medical Systems Inc., Palo Alto, CA, USA) with an eight-channel transceiving radiofrequency coil. Expected spectral line shapes were confirmed in an aqueous phantom (pH 7.5; heated to body temperature) doped with ~0.2 mM MnCl2 and containing 5 mM each of GSH and NAA. In vivo data were acquired from 11 scans of occipital-lobe mixed-tissue voxels (4 x 3 x 4 cm3) in nine healthy adults (five female; mean age 41 years). Spectral simulations were based on the density matrix formalism8 applied to published chemical shift and scalar coupling parameters.9 Signal quantification used linear combination model fitting of simulated TE-specific basis sets with up to 16 metabolites to J-difference spectra for GSH or unedited spectra for total NAA (NAA + NAAG) and total creatine (creatine + phosphocreatine). T2 was estimated using Levenberg-Marquardt least squares minimization to the monoexponential model $$M_{TE}=M_{0}e^{-\frac{TE}{T2}}$$ where M represents a linear combination model scaling factor, TE is echo time, and T2 is transverse relaxation time. All processing was achieved using customized INSPECTOR software written in MATLAB (MathWorks, Natick, MA, USA).7Results
Our methods yielded consistent spectral shapes across phantom and in vivo measurements that were well fit by simulated basis sets at each of the eight echo times (Figure 3). Basis fits yielded Cramer-Rao Lower Bounds < 10% for total NAA (5.9 ± 20.9%; mean ± S.D.) and total creatine (5.0 ± 18.9%) across 77/88 unedited spectra as well as for GSH (3.7 ± 10.1%) across 83/88 J-difference spectra. In vivo full width at half maximum (FWHM) was 13.5 ± 1.7 Hz at the 3.03-ppm creatine CH3 protons. All data points were used to calculate T2 for GSH (144.2 ± 5.5 ms; mean ± S.E.M.), total NAA (221.9 ± 10.3 ms), and total Cr (155.3 ± 5.9 ms) (Figure 4).Conclusions
We successfully applied J-difference editing along with a variable-parameter echo-time extension pulse array to measure the T2 of glutathione in human occipital cortex at 7 Tesla. Our finding that the measured GSH T2 of 144.2 ± 5.5 ms is considerably shorter than that calculated for either of two common reference metabolites NAA (221.9 ± 10.3 ms) or creatine (155.3 ± 5.9 ms) recapitulates a previously reported trend for occipital cortex metabolite T2 using a LASER sequence at 7 Tesla without J-difference editing for glutathione.10 Moreover, the notable variance of metabolite-specific values further emphasizes the importance of considering T2 relaxation differences in the spectroscopic measurement of these metabolites at long echo times.Acknowledgements
Special thanks are due to Ms. Yvette Strong at the Yale Center for Clinical Investigation (YCCI) for her invaluable help in recruitment. This research has been supported by grants from the National Multiple Sclerosis Society (NMSS RG-4319, NMSS PP-3356), a pilot grant from the Nancy Davis Foundation, and a CTSA Scholar Grant from the Yale Center for Clinical Investigation (YCCI, NIH UL1 TR000142) and falls within the purview of the Yale School of Medicine Human Investigation Committee protocol #1402013431.References
1. Carvalho AN, Lim JL, Nijland PG, Witte ME, Van Horssen J. Glutathione in multiple sclerosis: more than just an antioxidant? Mult Scler 2014 Oct; 20(11): 1425-31.
2. Choi C, Zhao C, Dimitrov I, Douglas D, Coupland NJ, Kalra S, Hawesa H, Davis J. Measurement of glutathione in human brain at 3T using an improved double quantum filter in vivo. J Magn Reson 2009; 198(2): 160-66.
3. Andreychenko A, Klomp DW, de Graaf RA, Luijten PR, Boer VO. In vivo GABA T2 determination with J-refocused echo time extension at 7 T. NMR Biomed 2013; 26(11): 1596-601.
4. de Graaf RA, Rothman DL. Detection of γ-aminobutyric acid (GABA) by longitudinal scalar order difference editing. J Magn Reson 2001; 152(1): 124–31.
5. Trabesinger AH, Weber OM, Duc CO, Boesiger P. Detection of glutathione in the human brain in vivo by means of double quantum coherence filtering. Magn Reson Med 1999; 42(2): 283-289.
6. Terpstra M, Henry PG, Gruetter R. Measurement of reduced glutathione (GSH) in human brain using LCModel analysis of difference-edited spectra. Magn Reson Med 2003; 50(1):19-23.
7. Prinsen H, de Graaf RA, Mason GF, Pelletier D, Juchem C. Reproducibility measurement of glutathione, GABA, and glutamate: Towards in vivo neurochemical profiling of multiple sclerosis with MR spectroscopy at 7T. JMRI 2016; e-publication ahead of print.
8. de Graaf RA, Chowdhury GMI, Behar KL. Quantification of high-resolution 1H NMR spectra from rat brain extracts. Anal Chem 2011; 83(1): 216-24.
9. Govindaraju V, Young K, Maudsley AA. Proton NMR chemical shifts and coupling constants for brain metabolites. NMR Biomed 2000; 13(3):129-53.
10. Marjanska M, Auerbach EJ, Valabregue R, Van de Moortele PF, Adriany G, Garwood M. Localized 1H NMR spectroscopy in different regions of human brain in vivo at 7 T: T2 relaxation times and concentrations of cerebral metabolites. NMR Biomed 2012; 25(2): 332-39.
Figures