2997
Difference optimization: Automatic correction of relative frequency and phase for 1H MEGA-PRESS spectra1Medical Physics Group, Institute of Diagnostic and Interventional Radiology, Jena University Hospital - Friedrich Schiller University Jena, Jena, Germany
Synopsis
We present an automatic routine for alignment of GABA 1H MEGA-PRESS spectra to reduce subtraction artefacts which can compromise reliable GABA quantitation. The algorithm iteratively optimizes relative frequency and phase offsets between the edited and non-edited 1H MEGA-PRESS spectra by minimizing the sum of the magnitude of the difference spectrum. The proposed method was applied to simulated spectra with preset frequency and phase errors and in vivo MEGA-PRESS data and compared to spectral registration, an alignment method implemented in the open source FID-A toolbox1. Difference optimization demonstrated robust performance without requiring limitation of the input data range or user intervention.
Purpose
Drifts and jitters of frequency and phase are a common problem when acquiring in vivo MR spectroscopy (MRS) data, which requires careful correction to enable reliable metabolite quantitation2–4. In particular, the J-difference editing technique 1H MEGA-PRESS, commonly used to detect GABA in the brain5, is prone to misalignment of the non-edited (NED) and edited (ED) spectrum. To reduce possible subtraction artefacts, mainly resulting from the large resonances of creatine and choline, we introduce a simple and reliable method to align the NED and ED spectra for fast and user-independent processing of MEGA-PRESS brain spectra.Materials and Methods
The presented difference optimization method automatically aligns NED and ED mean spectra using an iterative Nelder-Mead Simplex method6 and minimizes the sum of the magnitude of the DIFF spectrum in the frequency domain for the relative frequency Δf and phase ΔΦ offsets:
$$sum_{DIFF}(\Delta f,\Delta\phi)=\sum|ED-NED(\Delta f,\Delta\phi)|$$
$$sum_{DIFF,opt}=min(sum_{DIFF}(\Delta f, \Delta\phi))$$
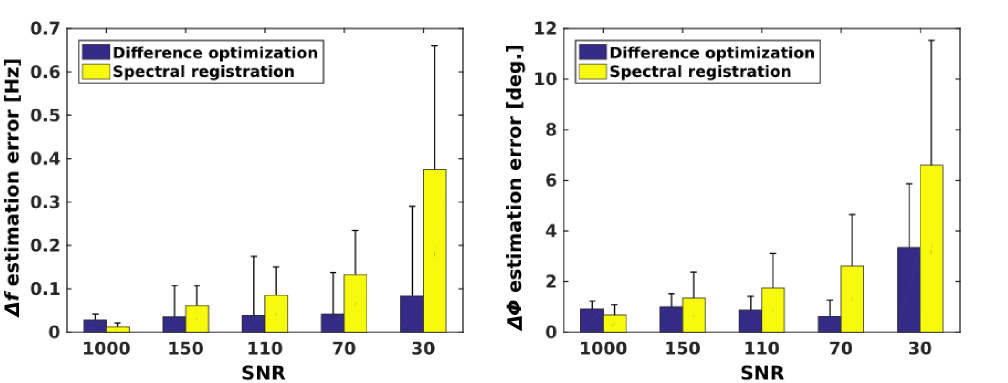
MEGA-PRESS brain spectra (TE = 68 ms, 2k points, BW = 2000 Hz, B0 = 3 T, LW = 6 Hz) were simulated using the FID-A toolbox1. Different noise levels were added to both NED and ED spectra (SNR = [30, 70, 110, 150, 1000], signal-to-noise-ratio with respect to the NAA peak) before introducing errors of Δf (0-6 Hz in 1 Hz steps) and ΔΦ (0-6 degrees in 0.75 degree steps) to the NED spectrum. Each simulation was repeated 20 times and Δf and ΔΦ drifts were corrected using, first, difference optimization, and second, for comparison, spectral registration4. Estimation error terms for Δf and ΔΦ were extracted by determining the absolute difference between the measured drift and the actual drift depending on SNR. Additionally, in vivo MEGA-PRESS data (TR/TE: 1800/68 ms, NAS = 192, 4k points, BW = 2800 Hz) were acquired from the posterior cortex (V = 13.1 ml) of 47 volunteers (54.8 ± 6.4 years) by using a clinical 3 T MR scanner (Magnetom TIM Trio, Siemens, Erlangen, Germany) and a 12-channel head matrix coil. For processing, all spectra of a single dataset were first zero-filled to 8k and subsequently processed separately for NED and ED spectra. Processing steps included frequency alignment, extraction of the reduced suppressed water signal, zero order phase correction and calculation of mean NED and ED spectra. The final processing step of correcting relative Δf and ΔΦ between NED and ED was conducted in three different manners: (a) no correction, (b) difference optimization and (c) manual correction (visual assessment). To investigate the performance of method (b) the correlation coefficients were calculated between the mean DIFF spectrum obtained from method (a) and (c), and between methods (b) and (c) in the range between 2.5 and 4.4 ppm.
Results
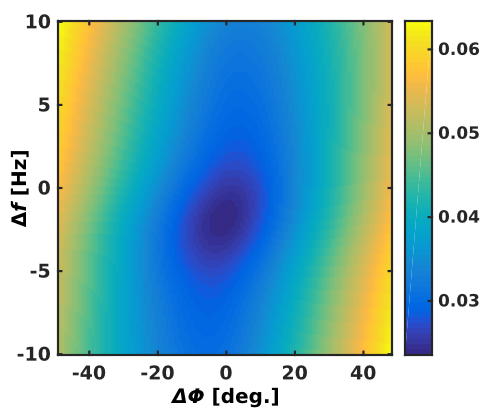
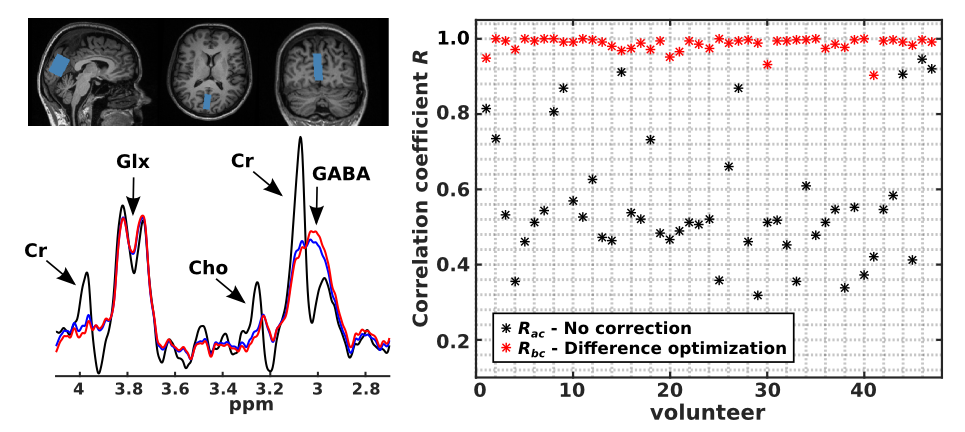
Figure 1 shows Δf and ΔΦ estimation error terms averaged over all repetitions and preset Δf and ΔΦ values at different SNR levels that were obtained from the difference optimization and the spectral registration method applied to the simulated data. For both Δf and ΔΦ errors spectral registration demonstrates better performance than difference optimization for the best SNR of 1000. However, with decreasing SNR towards realistic in vivo ratios between 150 and 70 the estimation errors increase for spectral registration but remain nearly constant for difference optimization. The sum of the magnitude of the difference spectrum for a range of discrete Δf and ΔΦ shifts is shown in Fig. 2 to illustrate the 2D minimization problem. An example in vivo difference spectrum is shown in Fig. 3. The subtraction artefacts of creatine and choline can be clearly seen in the uncorrected difference spectrum. Applying the automatic correction to in vivo data (method (b)) showed distinct improvement of spectra quality comparable to the manual correction (c), which can also be seen from the increased mean correlation coefficient over all datasets of Rbc = 0.99 ± 0.02 by using method (b) compared to Rac = 0.57 ± 0.17 without relative Δf and ΔΦ correction (method (a), see Fig. 3).Discussion and Conclusion
We have demonstrated a robust and fast method for spectral alignment of simulated and in vivo NED and ED GABA 1H MEGA-PRESS spectra, which is important for reliable GABA quantitation. The main advantage of the presented routine is that the correction can be performed based on the whole spectrum without limitation on the range of the input data. Our method is simple and easy to implement and the accurate frequency and phase alignment results in a difference spectrum with eliminated or only small residual subtraction artifacts. This allows very fast processing without user-dependent interaction and a more accurate determination of the metabolite of interest.Acknowledgements
M.C. was supported by a graduate scholarship of the Martin Luther University of Halle-Wittenberg. A.G. acknowledges funding from the German Research Foundation (DFG, GU 1108/3-1).References
1. Simpson R, Devenyi GA, Jezzard P, Hennessy TJ, Near J. Advanced processing and simulation of MRS data using the FID appliance (FID-A)-An open source, MATLAB-based toolkit. Magn Reson Med. 2015;00(October):n/a-n/a.
2. Waddell KW, Avison MJ, Joers JM, Gore JC. A practical guide to robust detection of GABA in human brain by J-difference spectroscopy at 3 T using a standard volume coil. Magn Reson Imaging. 2007;25(7):1032-8.
3. Evans CJ, Puts N a J, Robson SE, et al. Subtraction artifacts and frequency (Mis-)alignment in J-difference GABA editing. J Magn Reson Imaging. 2013;38(4):970-975.
4. Near J, Edden R, Evans CJ, Paquin R, Harris A, Jezzard P. Frequency and phase drift correction of magnetic resonance spectroscopy data by spectral registration in the time domain. Magn Reson Med. 2015;73(1):44-50.
5. Mullins PG, McGonigle DJ, O’Gorman RL, et al. Current practice in the use of MEGA-PRESS spectroscopy for the detection of GABA. Neuroimage. 2014;86:43-52.
6. Lagarias JC, Reeds JA, Wright MH, Wright PE. Convergence
Properties of the Nelder--Mead Simplex Method in Low Dimensions. SIAM J
Optim. 1998;9(1):112-147.
Figures