2996
Tissue-type dependence of in vivo chemical shifts of metabolites ?Jan Willem van der Veen1, Stefano Marenco2, Karen Berman3, and Jun Shen1
1Magnetic Resonance Spectroscopy Core, NIH, NIMH, Bethesda, MD, United States, 2NIMH-IRP, 3Clinical & Translational Neuroscience Branch, NIH, NIMH
Synopsis
Recent high field susceptibility imaging experiments have revealed significant differences in water frequency in different tissue types. We studied the frequency distribution of choline, creatine, NAA, myo-inositol, glutamate, glutamine and GABA from gray matter- and white matter-dominant voxels. Based on data acquired from 135 normal subjects it was found that the best fit frequency of at least several metabolites are significantly dependent on tissue type composition.
Introduction
Recent high field susceptibility imaging experiments have revealed significant differences in water frequency in different tissue types (1). This raises the question whether in vivo chemical shifts of metabolites may also depend on tissue type. Metabolites are known to be unevenly distributed both macroscopically and microscopically across the brain. In particular, intracellular distribution of metabolites as well as distribution of metabolites among different tissue types are known to be highly heterogeneous (2). Therefore, it is possible small differences in resonance frequency for the same metabolite peak may become detectable when a very large number of data sets are analyzed. To investigate this possibility, we analyzed the best fit frequencies of choline, creatine, NAA, myo-inositol, glutamate, glutamine, and GABA as a function of gray matter fraction using data collected from 135 healthy volunteers.Methods
135 healthy volunteers were scanned on a 3 Tesla whole body scanner (GE, Milwaukee, WI, 14M4 platform) for GABA editing. Two spectroscopy voxels (2 cm x 2 cm x 4.5 cm A/P) were scanned, one placed immediately superior to the ventricles for the mostly gray matter voxel (Medial PreFrontal Cortex; MPFC) and one immediately to the right of the first in mostly white matter (Frontal White Matter; FWM). NS=768, TR/TE=1500/68 ms, NEX=2. A total of 384 edited and non-edited (3) FID pairs were acquired in 20 minutes. The non-edited, edited and the difference spectra were fitted simultaneously in the time domain using a Levenberg-Marquardt non-linear fitting program written in IDL (ITTVIS). The fit was performed using simulated reference signals of NAA, NAAG, creatine (CRE) (4), choline (4), myo-inositol (MIO), glutamate (GLU), glutamine (GLN), scyllo-inositol (SCI), glutathione (GSH), and GABA. (5). An updated GAMMA library (6) from Duke university (7) was used. The effects of RF shapes, crusher gradients and various coherence pathways were fully simulated (8,9). A single shared Voigt type lineshape was used but the frequencies of the metabolite reference signals were allowed to vary freely. The tissue composition of the spectroscopy voxels was determined from the segmented SPGR anatomical scan using SPM5 (10). With an IDL in-house developed program the fractions of gray matter (GM), white matter (WM), and cerebrospinal fluid (CSF) were determined.Results and Discussion
The best fit frequencies of the most metabolite signals were found to differ slightly but significantly from the literature values (11) and to depend on gray matter fraction. Figure 2 shows the best fit chemical shift difference between choline and creatine (left panel), between NAA and creatine (middle panel) and between choline and NAA (right panel). Although the chemical shift difference between NAA and creatine only shows a weak dependence on gray matter fraction, their frequencies with respect to choline are found to be small but highly dependent on gray matter fraction. For example, the extrapolated frequency difference in figure 2 left panel between pure gray matter and pure white matter is only ~0.6 Hz. The best fit chemical shifts relative to choline for GABA, glutamate, glutamine, and myo-inositol are shown in figure 3. Despite the small difference in the best fit frequencies between the two voxels, the overall fitting error was found to be highly sensitive to these small frequency variations (figure 4). The best fit frequency differences between metabolite pairs also exhibit small deviations from literature values (11; see Table 1). Although our data indicate a significant dependence of the absolute frequencies on tissue composition, interpretation of the results requires caution as the in vivo frequencies of metabolites are possibly influenced by many factors. For example, it would be interesting to see if there is any correlation between metabolite resonance frequency and white matter fiber orientation. Heterogeneous tissue structure may also cause lineshape differences between metabolites within a spectroscopy voxel, especially at higher field strengths (12). Another possibility is potential macromolecule baseline differences between different tissue types although parametrization of baseline is independent of tissue type. Regardless of the underlying causes of the dependence of best fit frequencies on tissue type, our results indicate that in spectral fitting frequencies should not be fixed to a given value from the literature. The residue of the fit changes significantly if frequencies are fixed to a specific value, as shown by figure 4.Acknowledgements
No acknowledgement found.References
1. Duyn JH et al, Proc Natl Acad Sci U S A. 2007 Jul 10;104(28):11796-801.2. G. Shepherd, Neurobiology, 3rd ed, Oxford Press, 1994.3. Sailasuta P. et al, Proc ISMRM 9:1011 (2001).4. R.A. de Graaf, in vivo NMR Spectroscopy,2nd ed. 5. van der Veen, JW et al, Proc ISMRM 22:2889 (2014) 6. Smith SA et al, J. Magn. Reson. 106a, 75-105, (1994). 7. http://scion.duhs.duke.edu/vespa/gamma 8. de Beer R et al, Meas. Sci. Technol. 22 (2011) 114022 (9pp). 9. van der Veen, JW et al, Proc ISMRM 21:2032 (2013) . 10. Ashburner J, Friston KJ. Multimodal image coregistration and partitioning - a unified framework. Neuroimage, 1997;6:209–217. 11. Govindaraju, V et al, NMR in Biomed 13, 129-153 (2000). 12. van Ormondt D. et al, Proc ISMRM Benelux 2015 P049.Figures
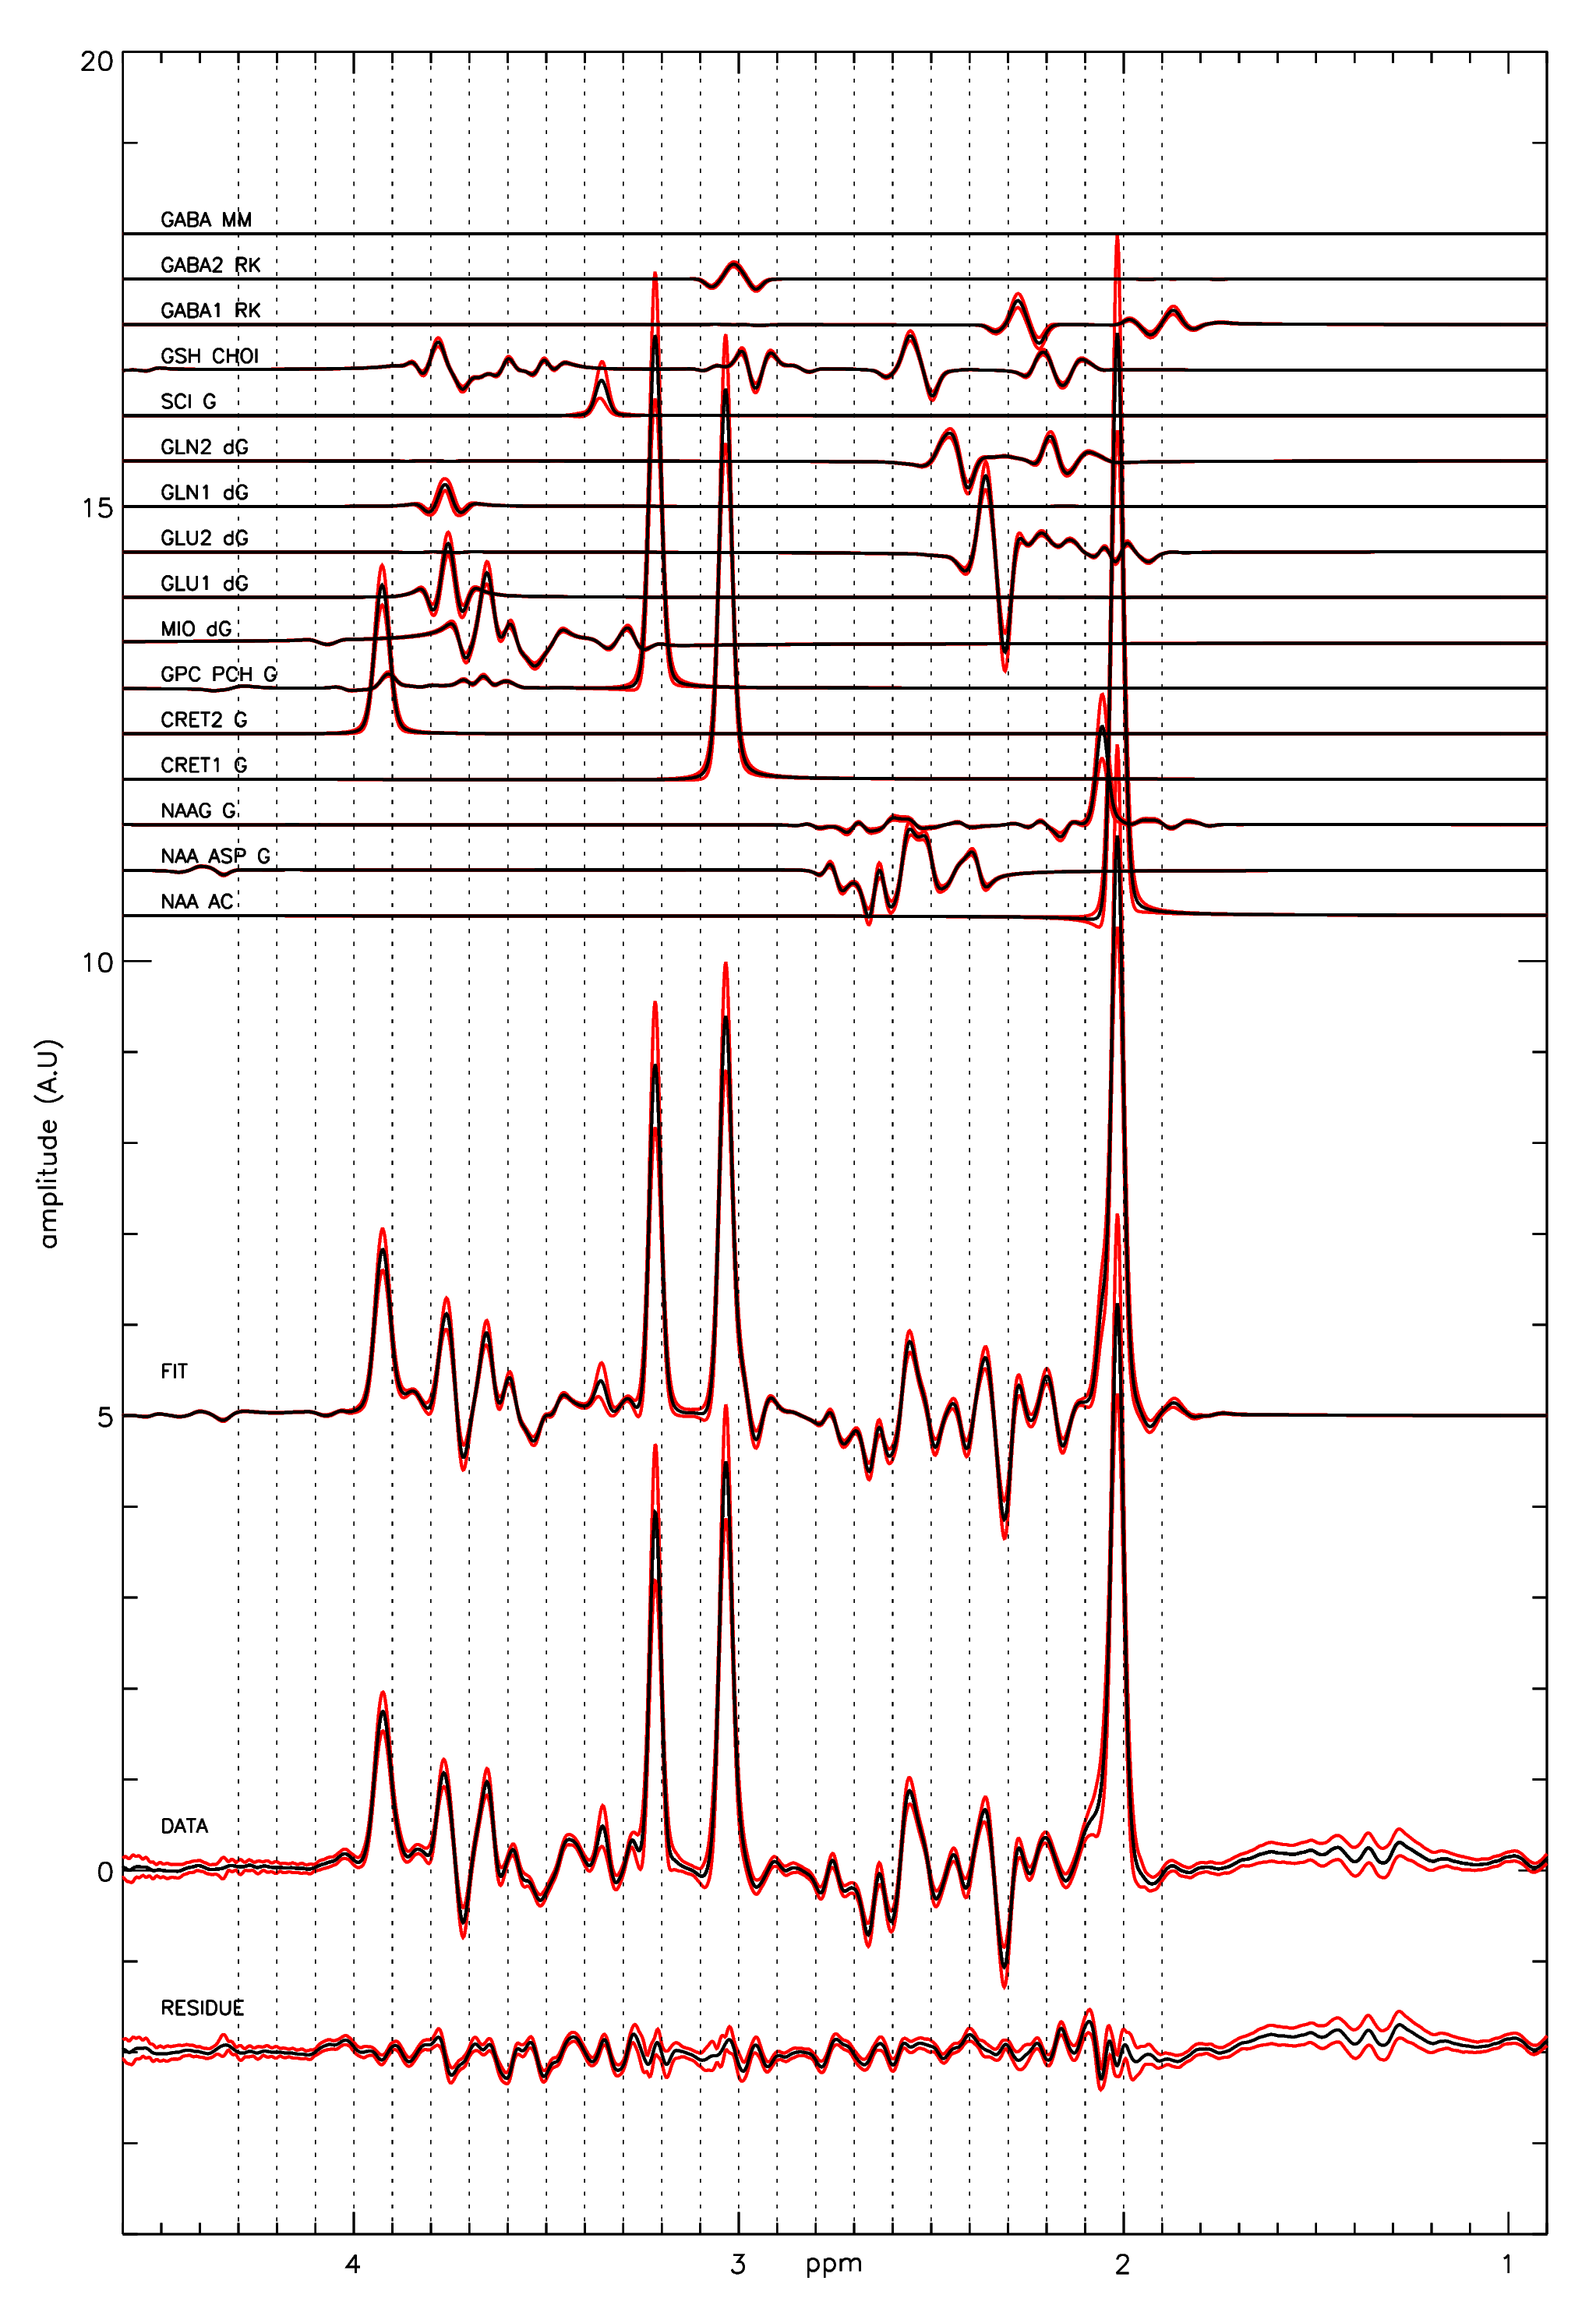
Figure 1.
Average of 135 fits to the
unedited data. Black lines are the average, red line the standard
deviation. The same Voigt lineshape was used for all metabolites.
Each metabolite reference signal has an individual frequency
parameter in the fit.
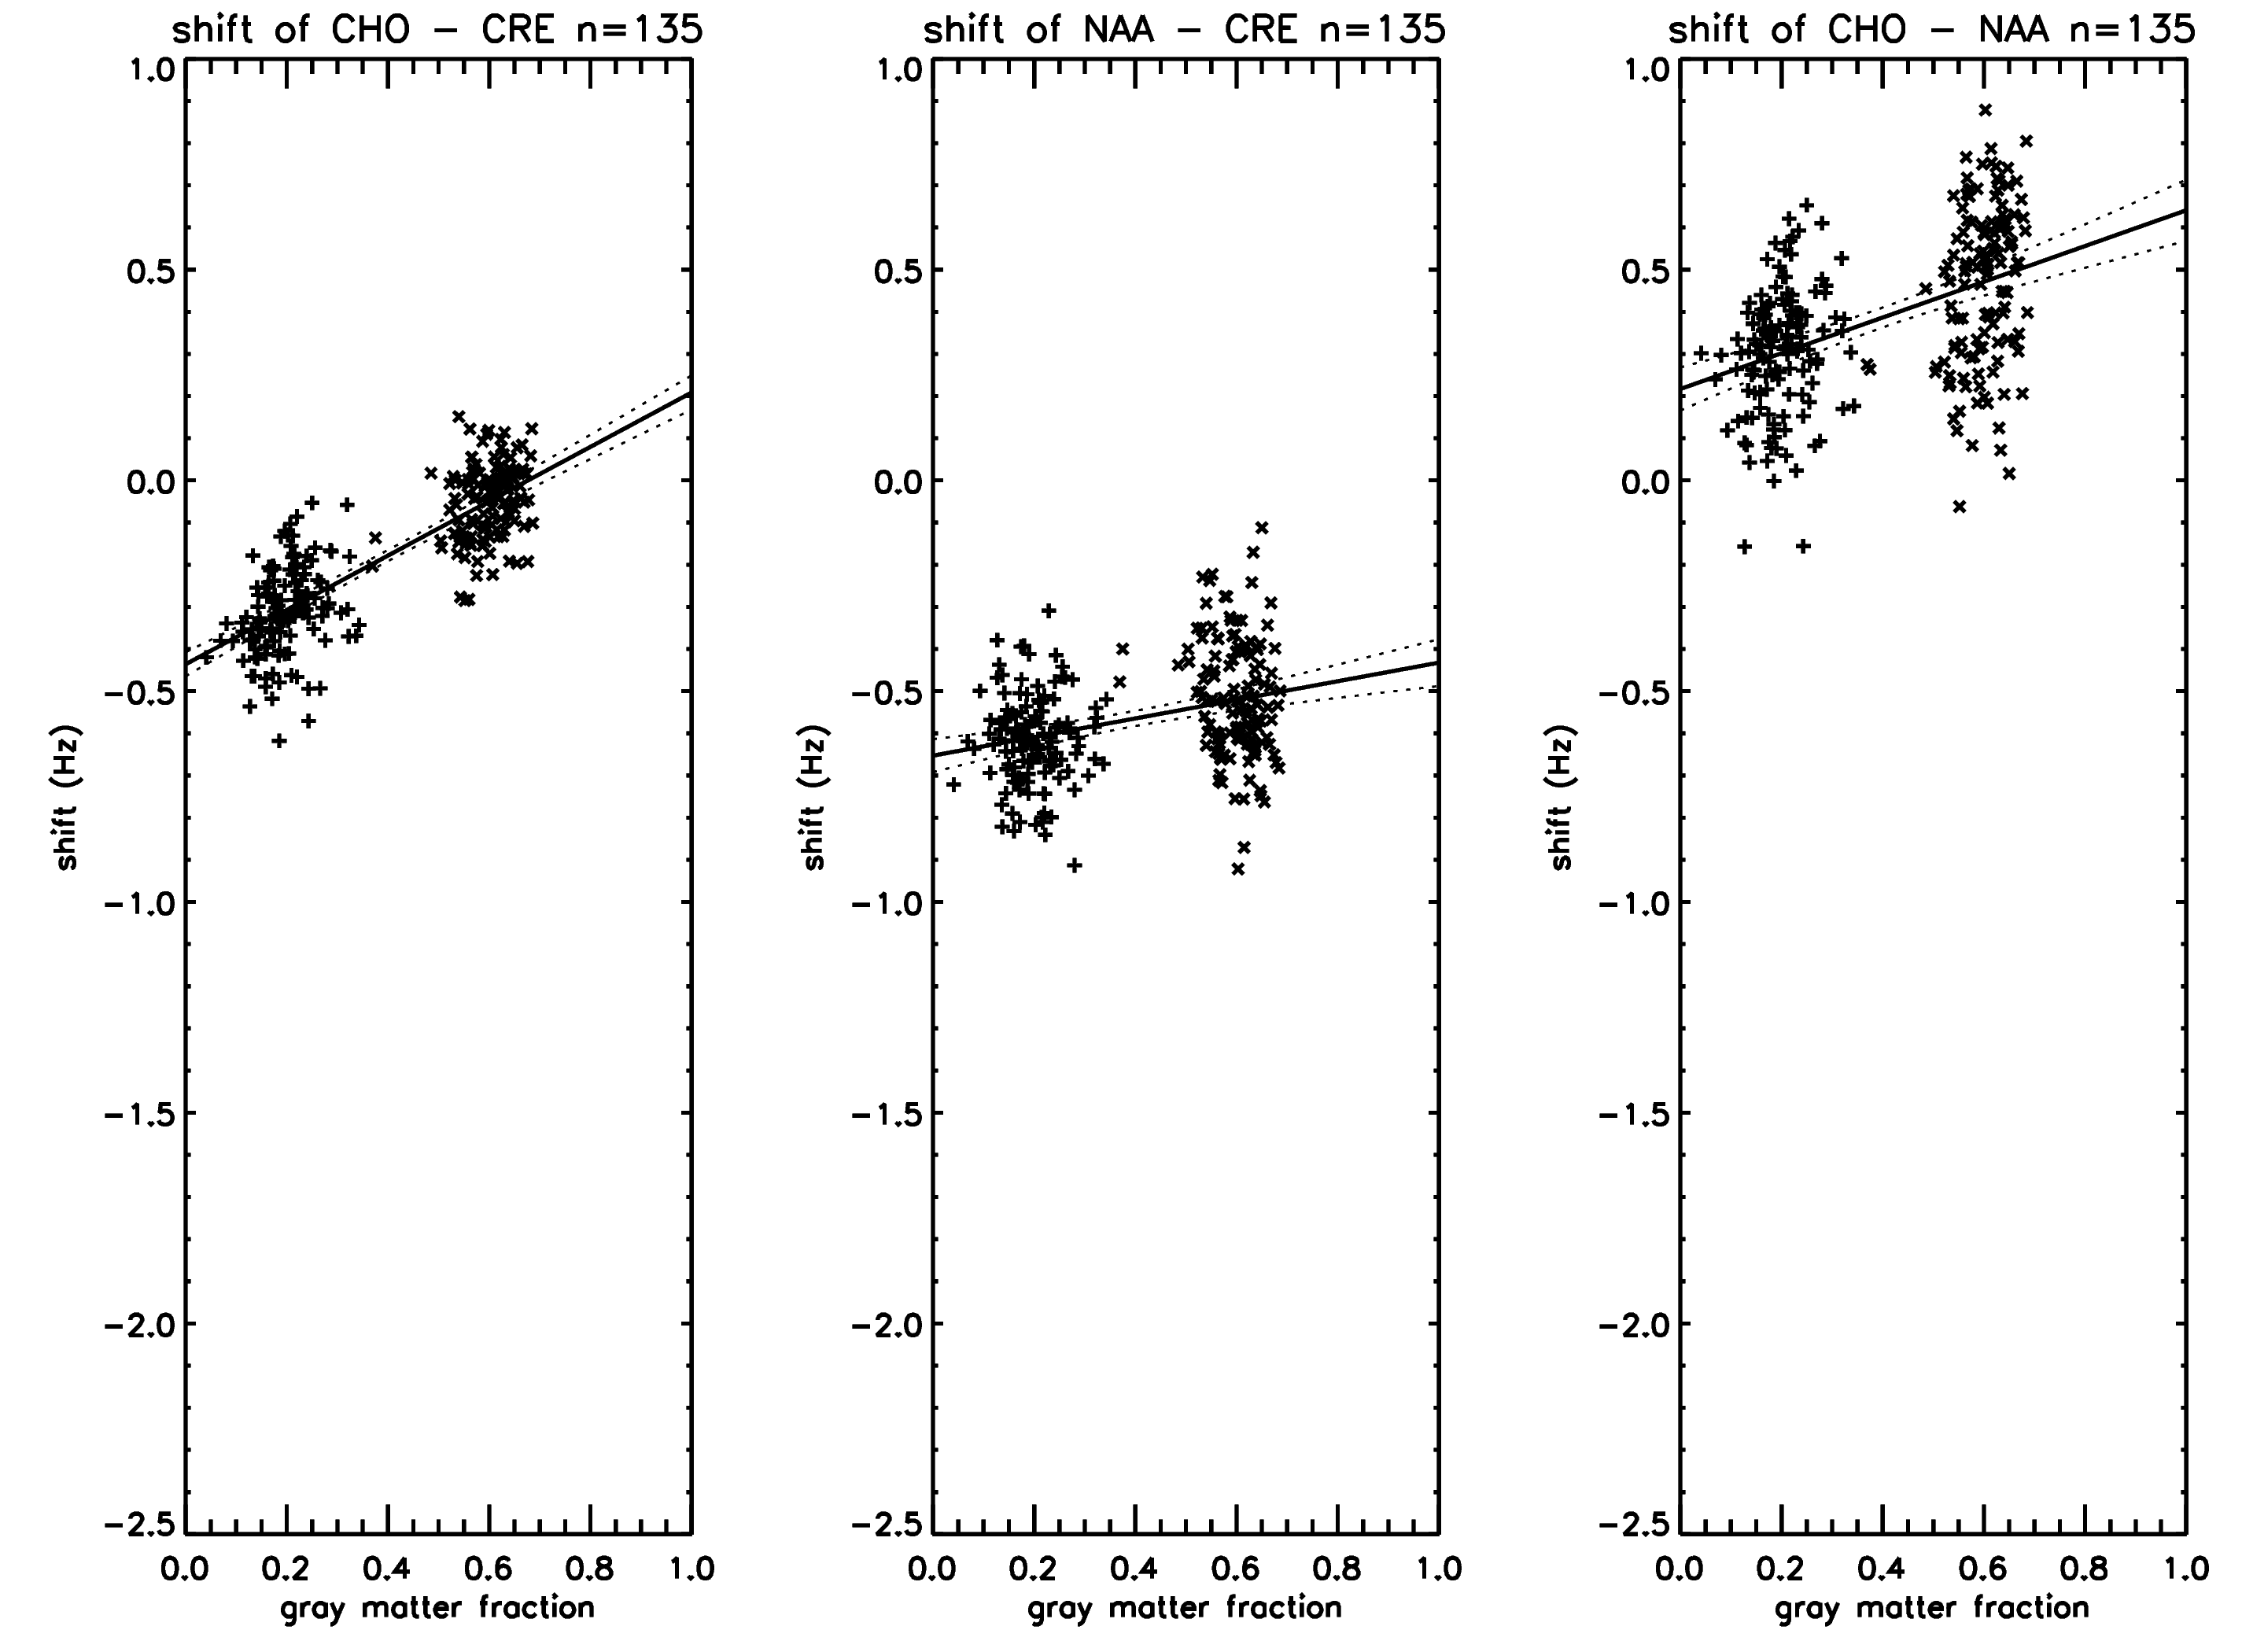
Figure 2.
Frequency difference in
Hz between metabolite pairs (choline-creatine, NAA-creatine, and
choline-NAA) as a function of gray matter fraction.
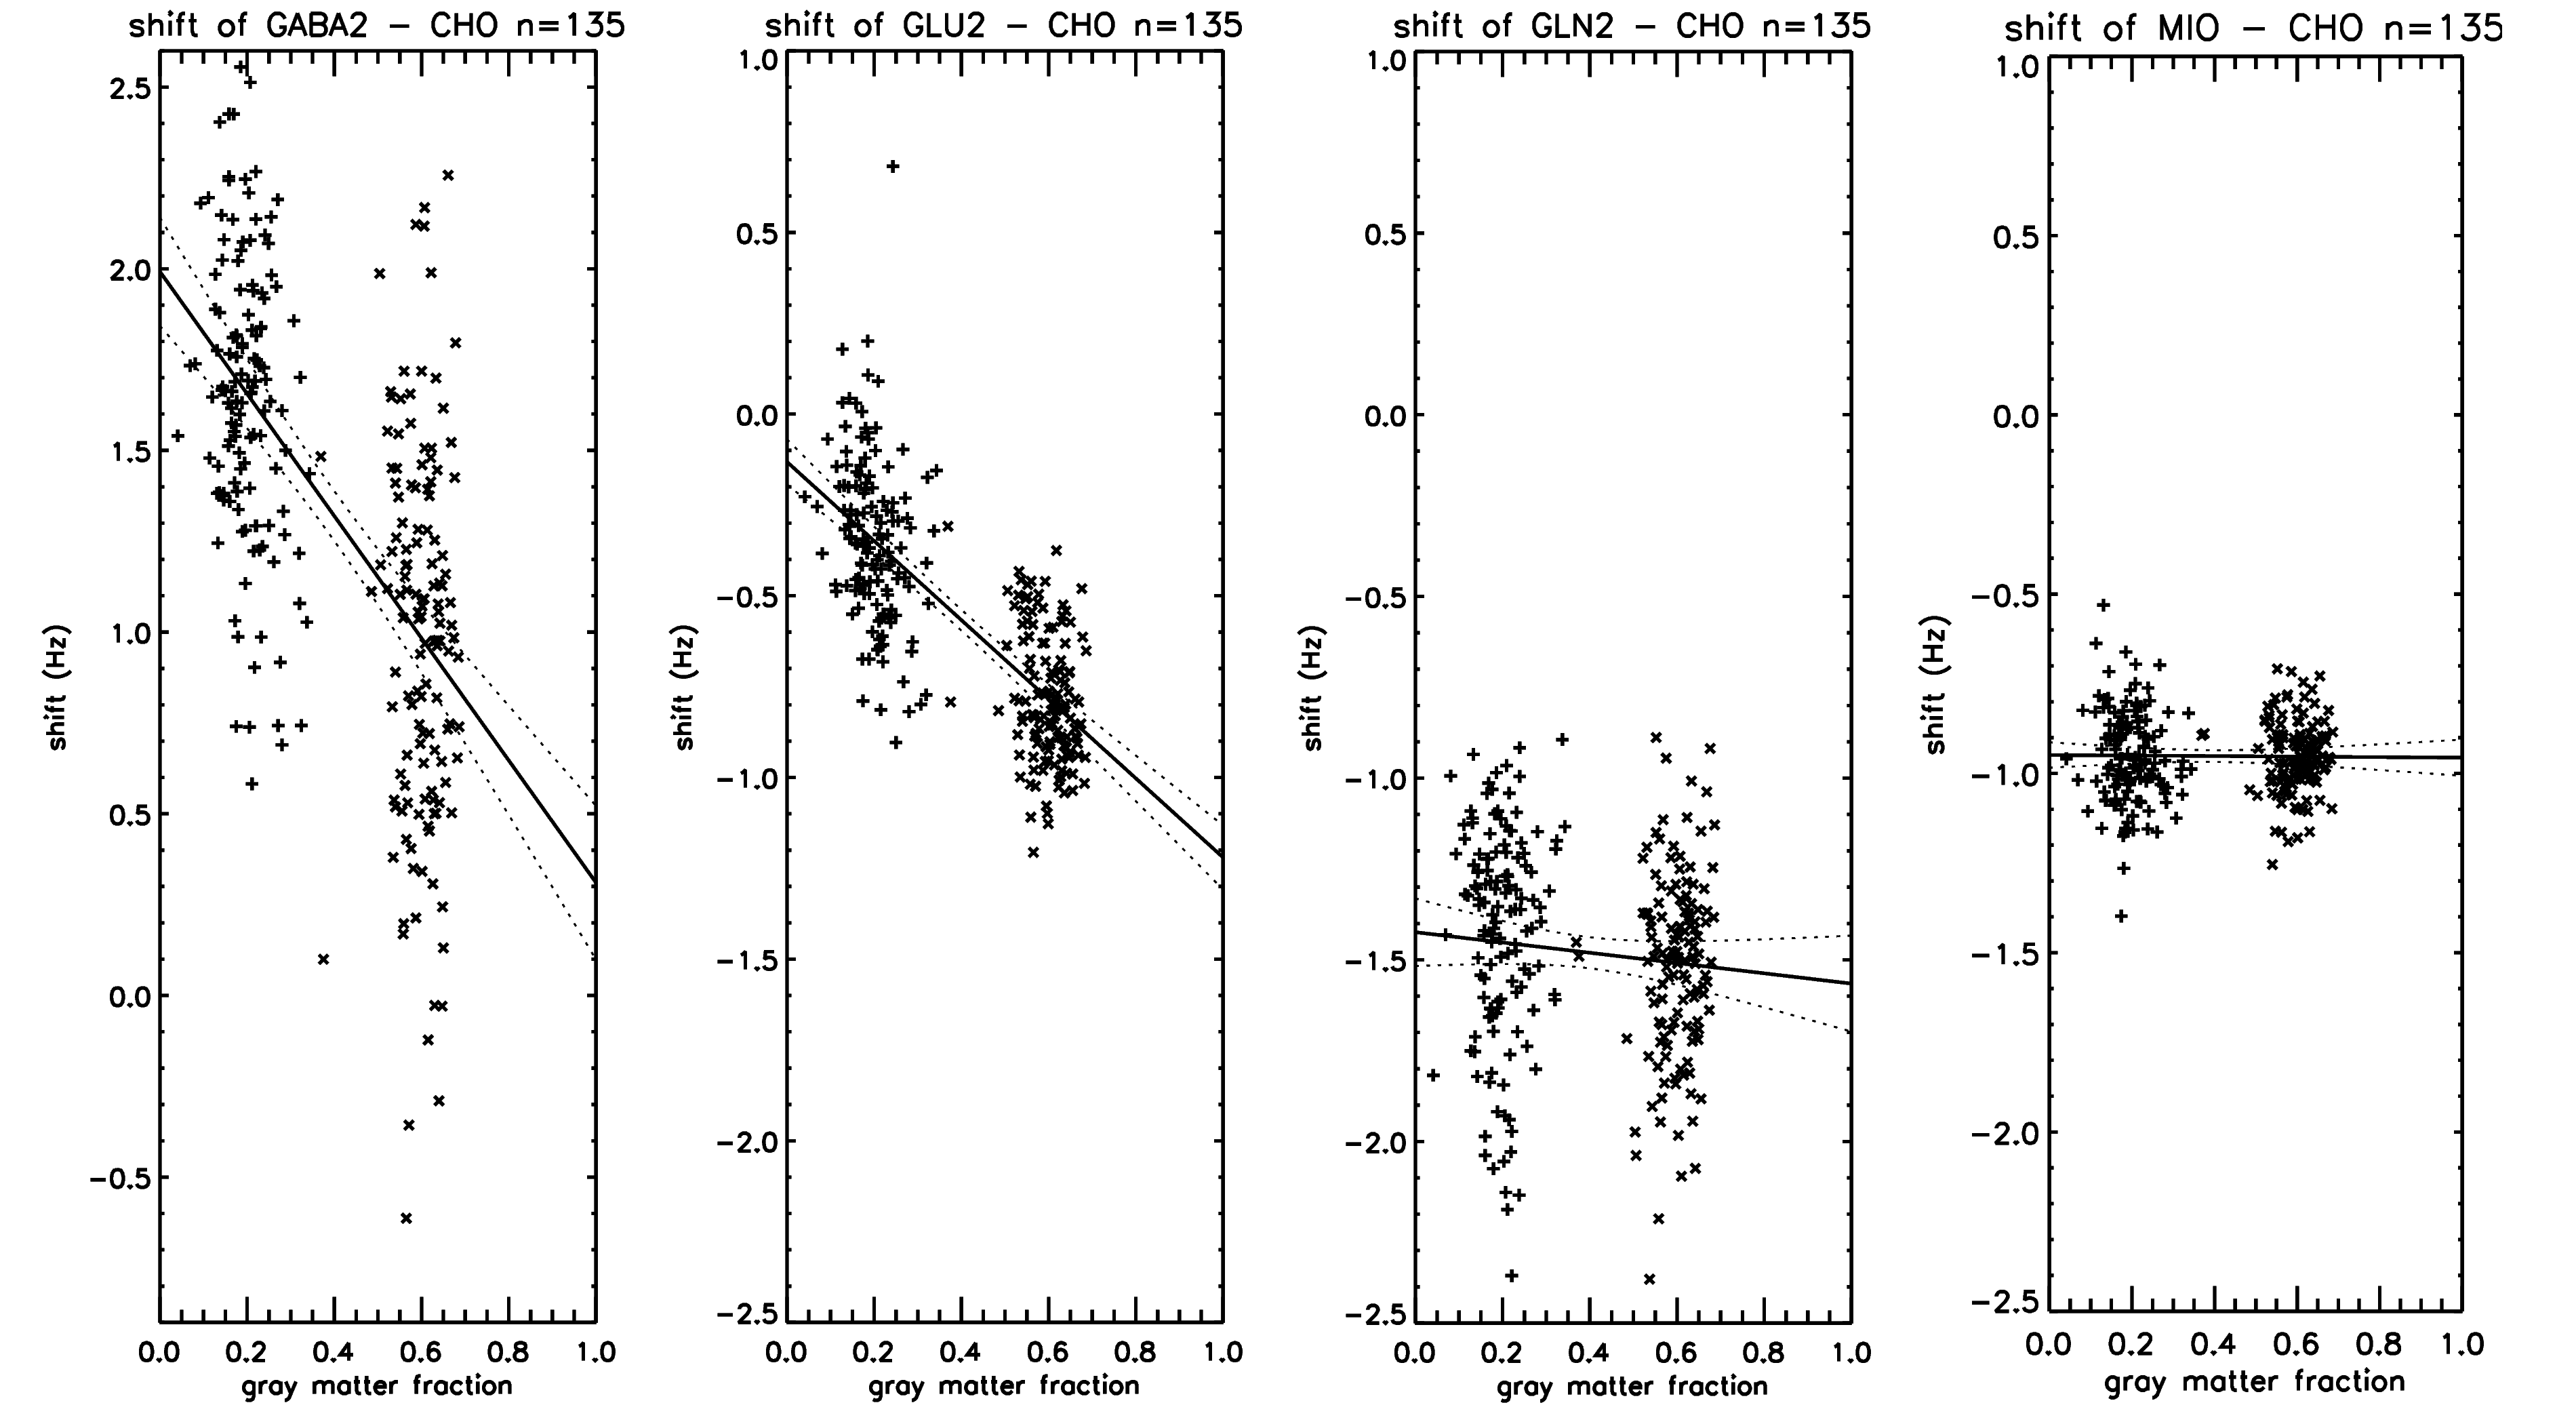
Figure 3. Relative shifts
between choline and GABA (GABA2 moiety at 3.01ppm), glutamate (GLU2
moiety between 1.9 and 2.5 ppm), glutamine (GLN2 moiety between 2.1
and 2.6 ppm), and myo-inositol.
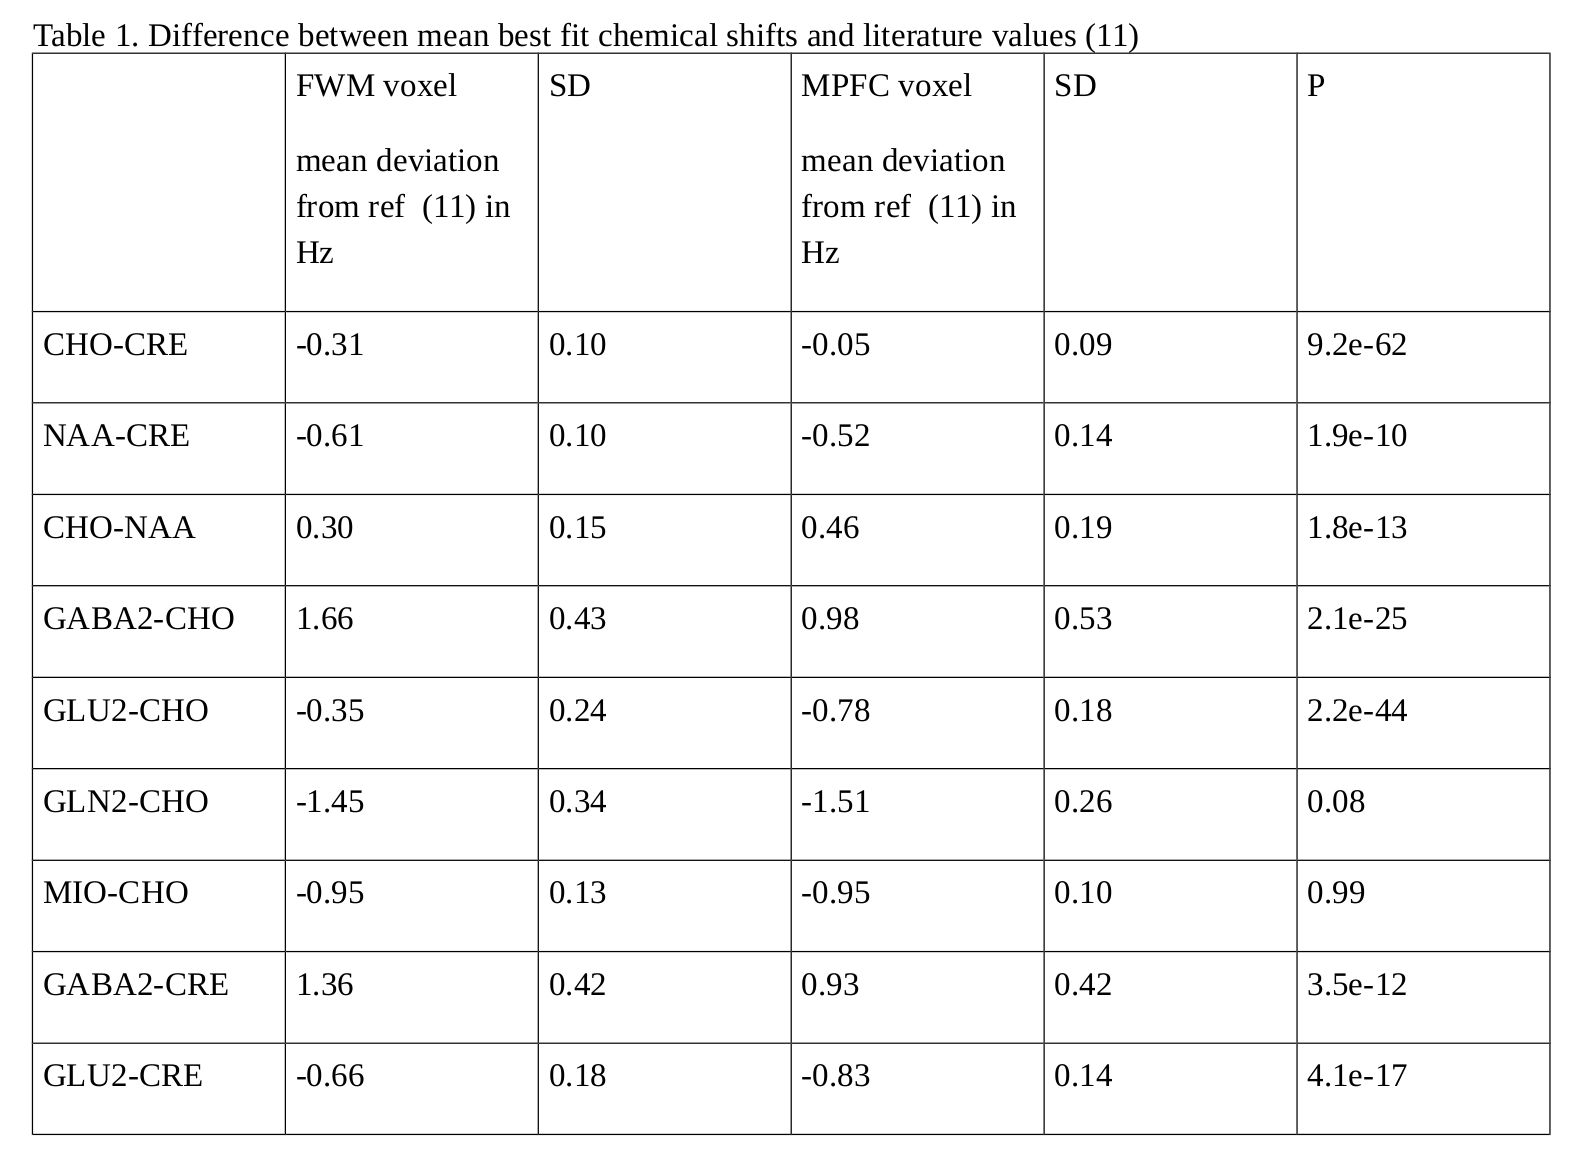
Table 1. Difference between
mean best fit chemical shifts and literature values (11)
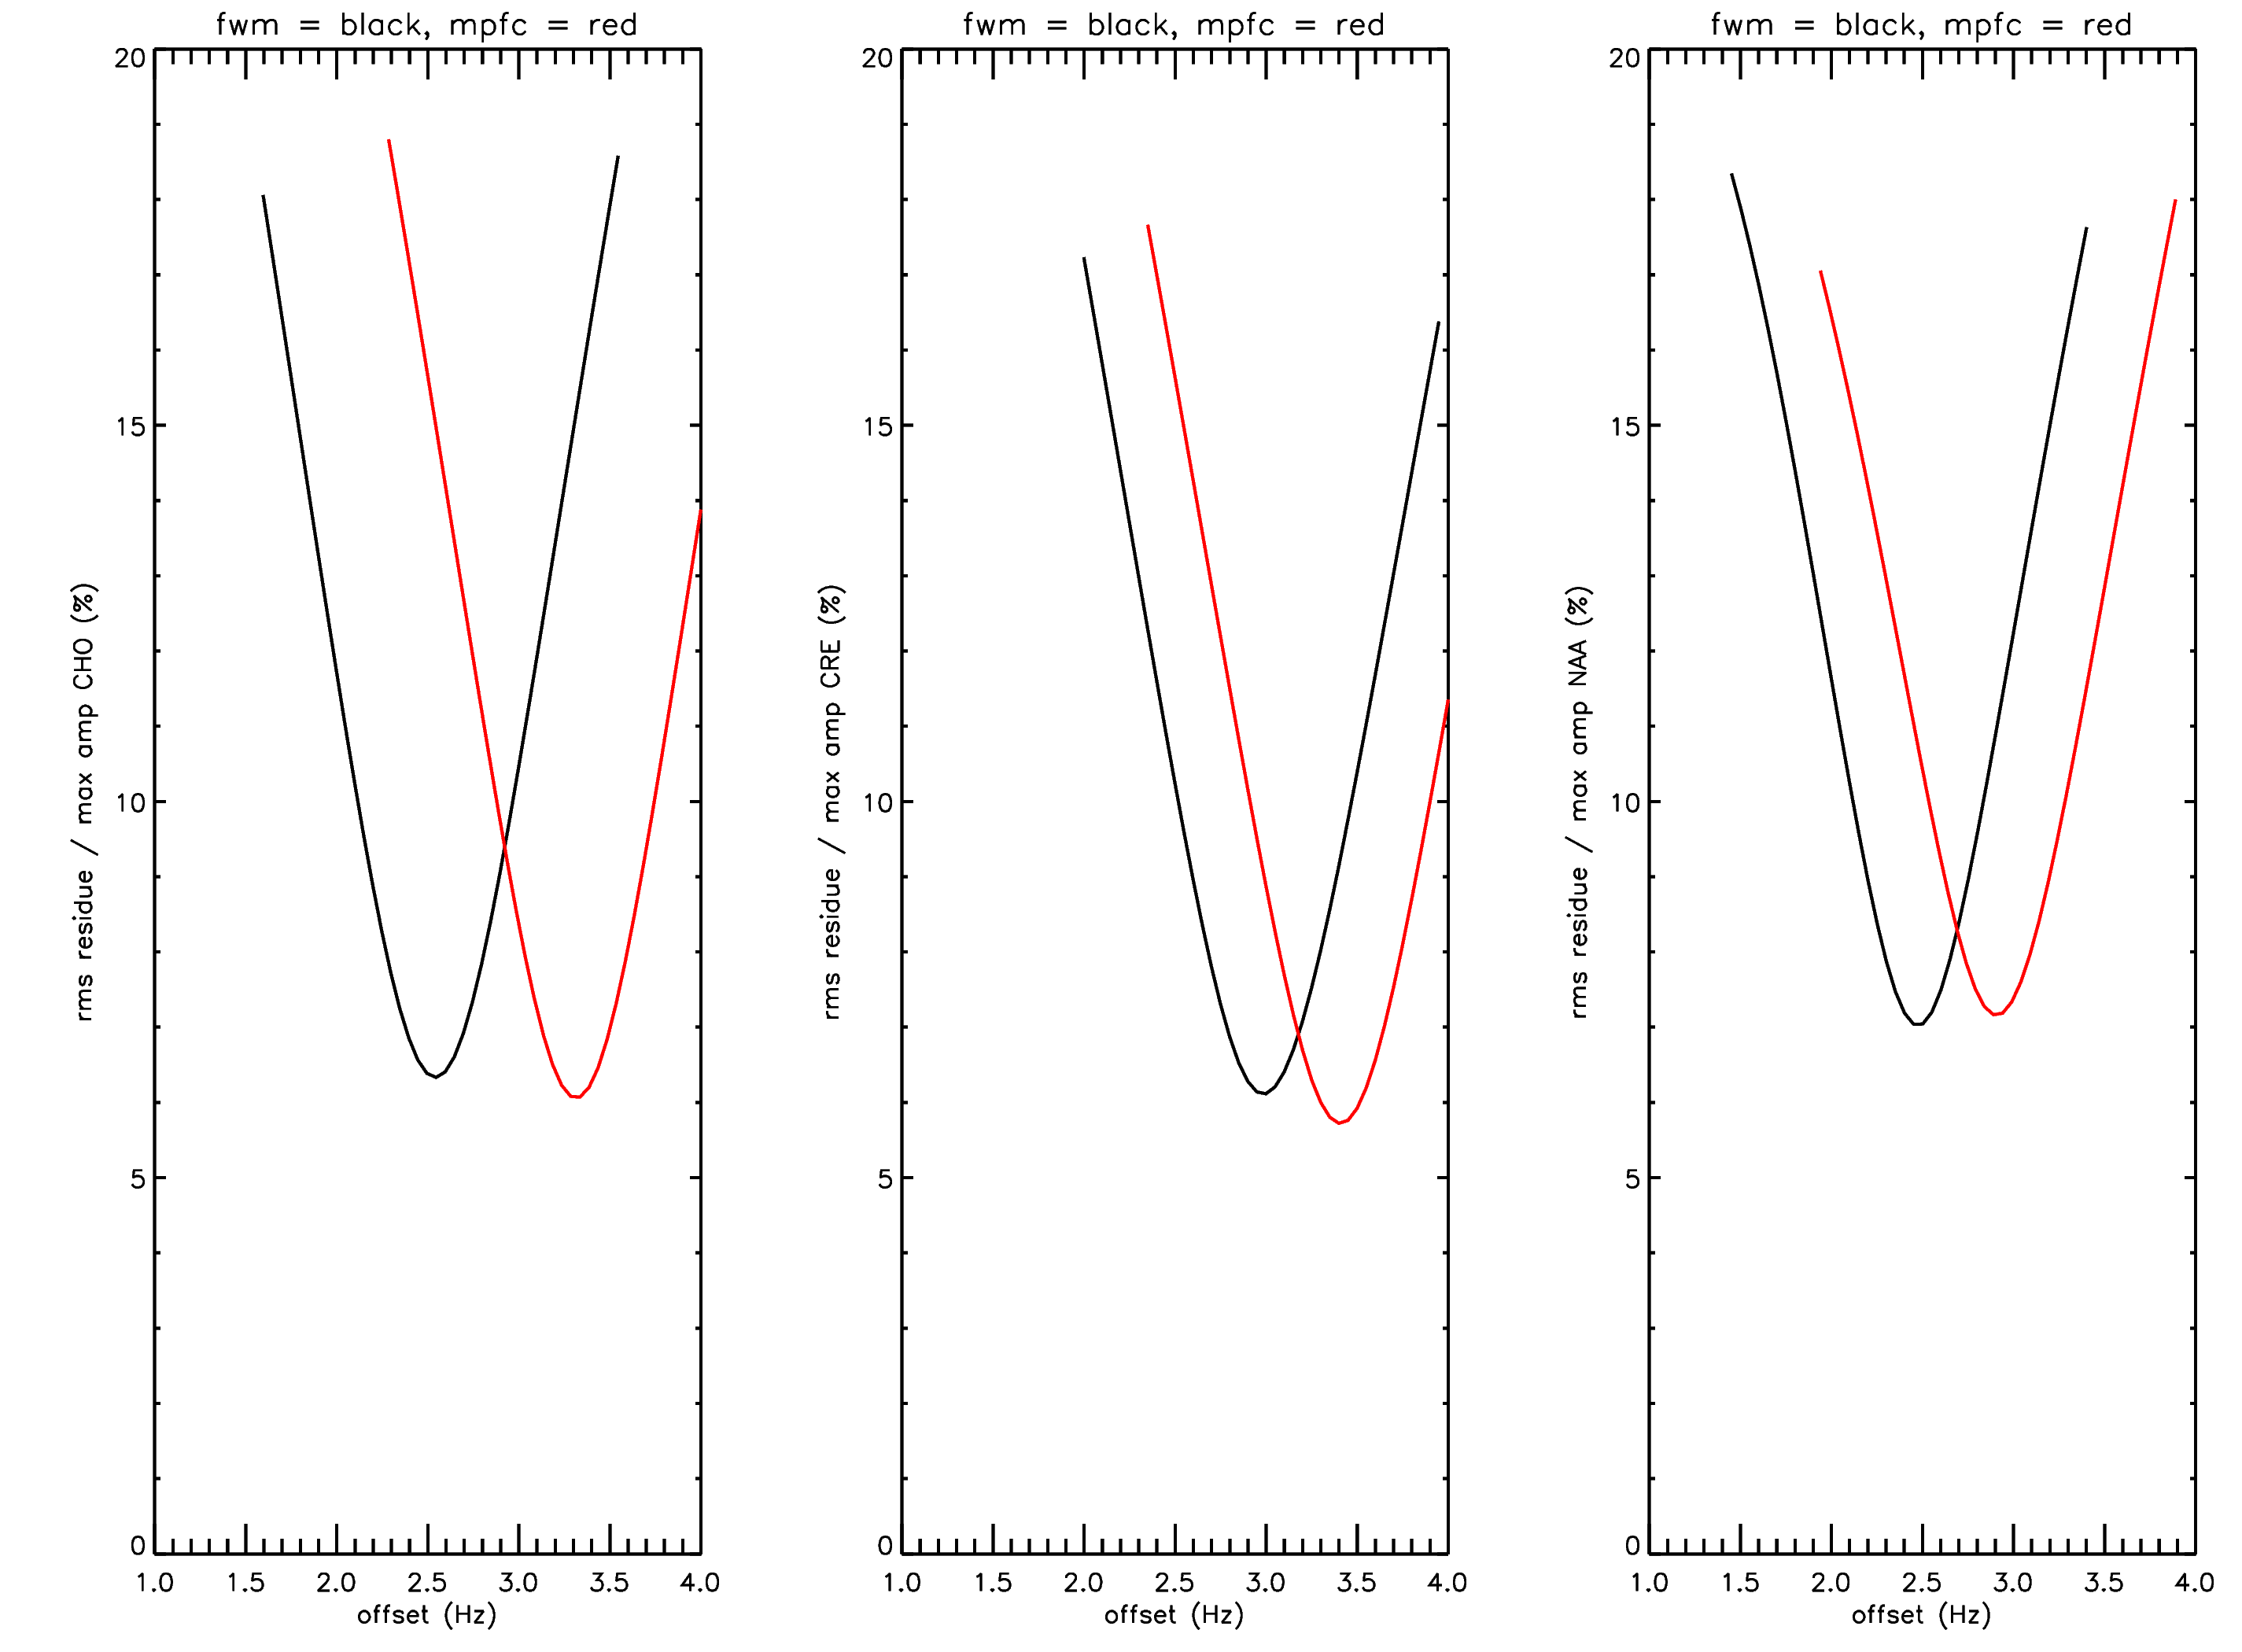
Figure 4. The root-mean-square
of the residue as a function of the offset from the water frequency
at 4.65 ppm. The curves are averaged from 135 normal volunteer scans.