2995
Fitting comparison for 9.4T 1D semi-LASER and 2D-J-resolved semi-LASER data1High-Field Magnetic Resonance, Max Plack Institute for Biological Cybernetics, Tübingen, Germany, 2Institute of Physics, Ernst-Moritz-Arndt University Greifswald, Greifswald, Germany
Synopsis
In this abstract, we present an adapted version of the ProFit-V2 fitting software to fit J-resolved semi-LASER data at 9.4T. Simulated basis sets with ideal pulses show the need to reduce the echo time to account for the spin locking effect of the adiabatic pulses. Further, a comparison of the fitting error estimations using correlation matrices and Cramer-Rao Lower Bounds with a metabolite cycled semi-LASER fitted with LCModel is done.
Purpose
There is a need for development of quantification approaches for adiabatic localization methods that are subject to spin-locking effect during the adiabatic pulse duration1,2 as well as the Carr-Purcell behavior due to the presence of multiple refocusing pulses with short inter-pulse intervals3. In addition, there is sustained research in acquisition of two-dimensional spectra4-6, which benefit from adiabatic localization with broadband pulses due to avoidance of J-refocused peaks7-10. Hence, this work shows a first extension of the ProFit-V2 software11 to fit 2D-J-resolved semi-LASER(J-sLASER) data and optimization of a related 2D basis set. Cramer-Rao Lower bound(CRLB) estimates and fit covariance matrices are compared against those from 1D-metabolite cycled semi-LASER(1D-MC-sLASER)12 fitted with LCModel13.Methods
2D-J-sLASER and 1D-MC-sLASER measurements were acquired on a Siemens Magnetom 9.4T(Erlangen, Germany) whole-body MRI scanner. The study was performed on 5 and 9 healthy volunteers for the 2D-J-sLaser and the 1D-MC-sLaser, respectively(3 females and 2 males, respectively 3 females and 6 males). All of them gave informed signed consent as approved by the local ethics board. Spectroscopy voxels(2x2x2cm3) were positioned in the occipital lobe having a mixed content of grey and white matter. The 1D-MC-sLASER data were acquired with an echo time of 24ms, 96 averages(16phase cycling steps), while the 2D-J-sLASER data were acquired with echo times ranging from 24 to 124ms(ΔTE=2ms time increments between the last two adiabatic-full-passage pulses) and 8 averages. The 2D-J-sLASER sequence was used with SODA14 water suppression and maximum echo sampling, while the 1D-MC-sLASER data has been acquired without water suppression using the metabolite cycling scheme and was half echo sampled. Adiabatic refocusing pulses had a duration of 3.5ms(0.2ms ramp up and ramp down times).
Basis sets were simulated using the GAMMA library15 with 19 metabolites using experimentally measured J-coupling coefficients16-18. 2D-J-sLASER was simulated as a J-resolved PRESS(JPRESS) sequence5 and a single spin-echo sequence was used as model for the 1D-MC-sLASER data. Simulations have been done for several echo times assuming ideal pulses.
All free induction decays were frequency aligned, eddy current corrected, HSVD water suppressed and truncated uniformly at 250ms, at a time where all metabolite signals have fully decayed at 9.4T19.
The J-sLASER 2D-spectra were fitted with an adapted version of ProFit-V2, while the MC-sLASER 1D spectra were fitted with LCModel V6.3-1L using also a measured macromolecular baseline20. The 2D-J-sLASER data was phase corrected, fitted applying a Voigt line shape model and numerical optimization algorithms in three fitting iterations.
Noise variance for the 2D-J-sLASER data was measured in a window from 2-4ppm and 6-10ppm in indirect and direct dimension respectively. No baseline correction, zerofilling or apodization were used for calculating the noise variance, Cramer-Rao Lower Bounds(CRLBs) and correlation matrices. The correlation matrices21 were calculated from the Fisher information matrix created using the fitted metabolite data(only real part for LCModel fit results).
Results
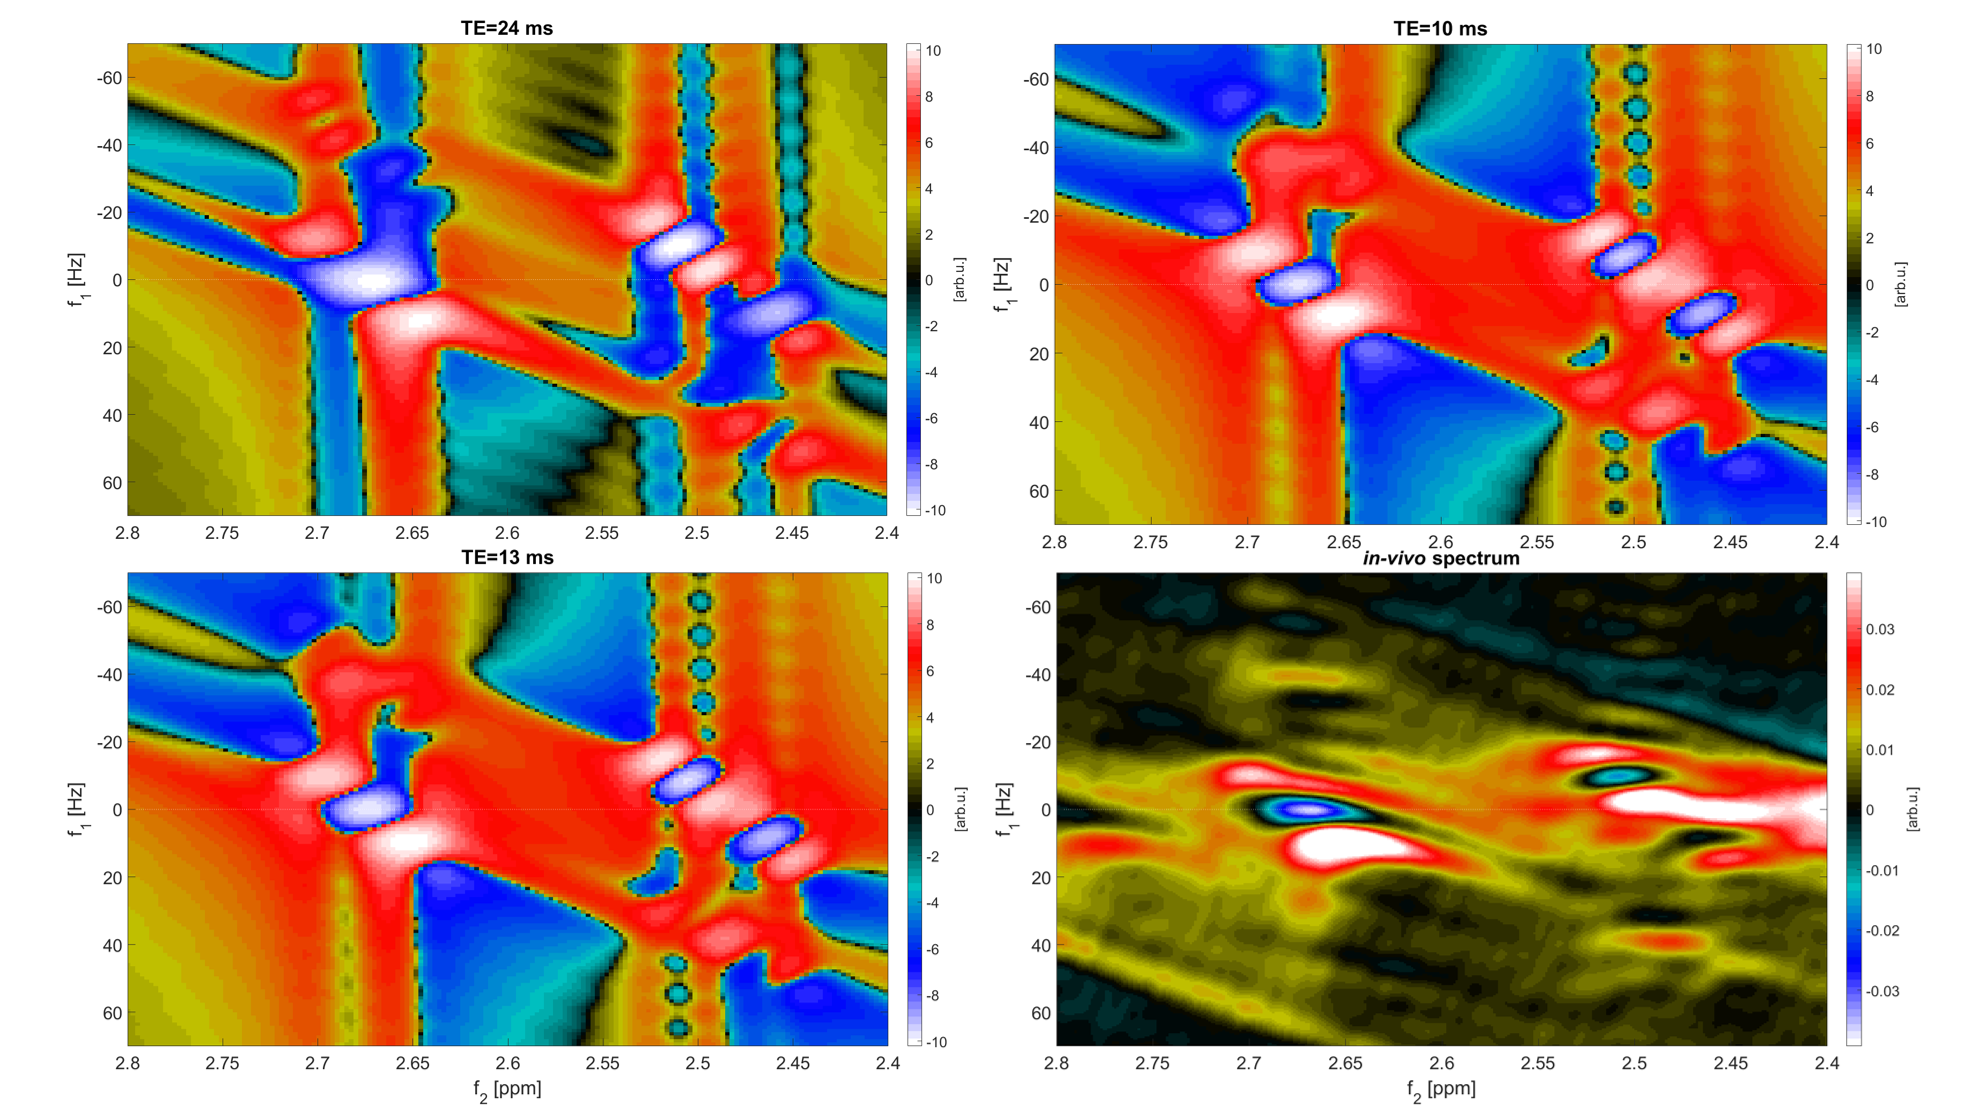
The simulated NAA-aspartate moiety spectral pattern showed that a starting echo time of 13ms of the JPRESS sequence model closely matched the absorption and dispersion lines and the peak splitting of the experimentally measured in vivo 2D-J-sLASER data(Fig. 1).
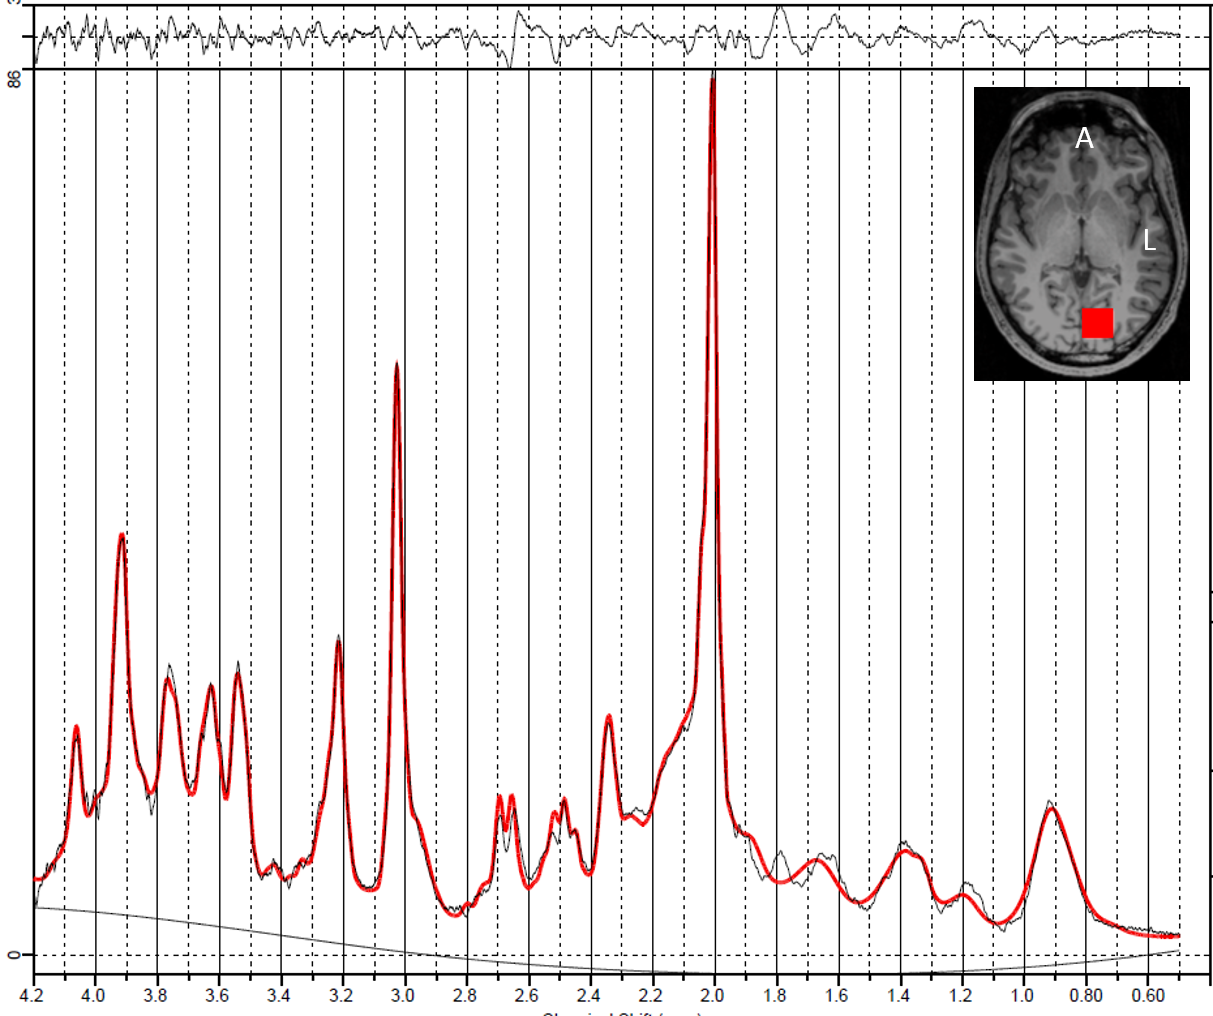
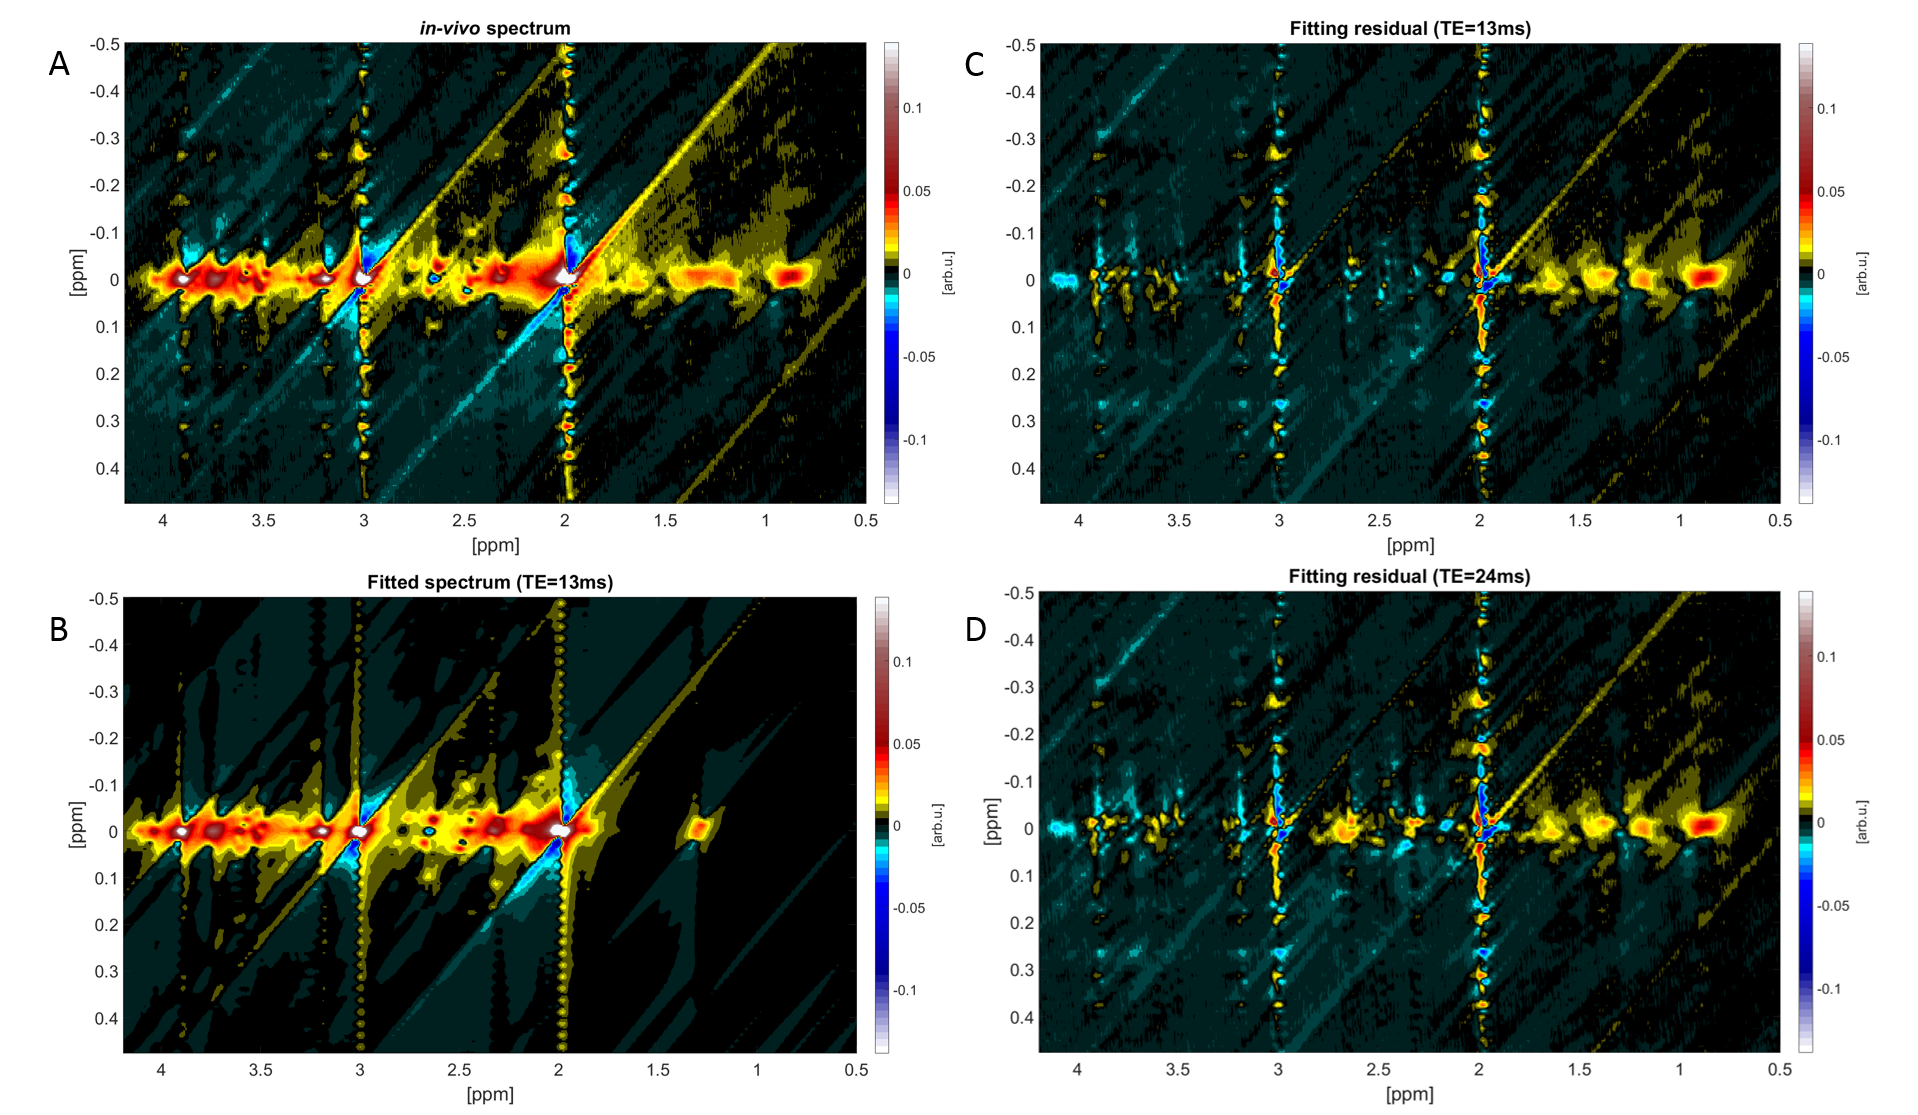
A representative 1D-MC-sLASER (Fig. 2) and a 2D-J-sLASER (Fig. 3) fit for the in vivo spectra is presented. The 2D-J-sLASER residues in Fig. 3 showed the absence of the macromolecular baseline in the basis set. A better match of the 13ms versus the 24ms TE fit residue was also demonstrated.
All further results are presented with basis sets simulated with a TE=6.5ms spin-echo sequence for the 1D-MC-sLASER data, and with a TE=13ms starting echo time JPRESS sequence for the 2D-J-sLASER data.
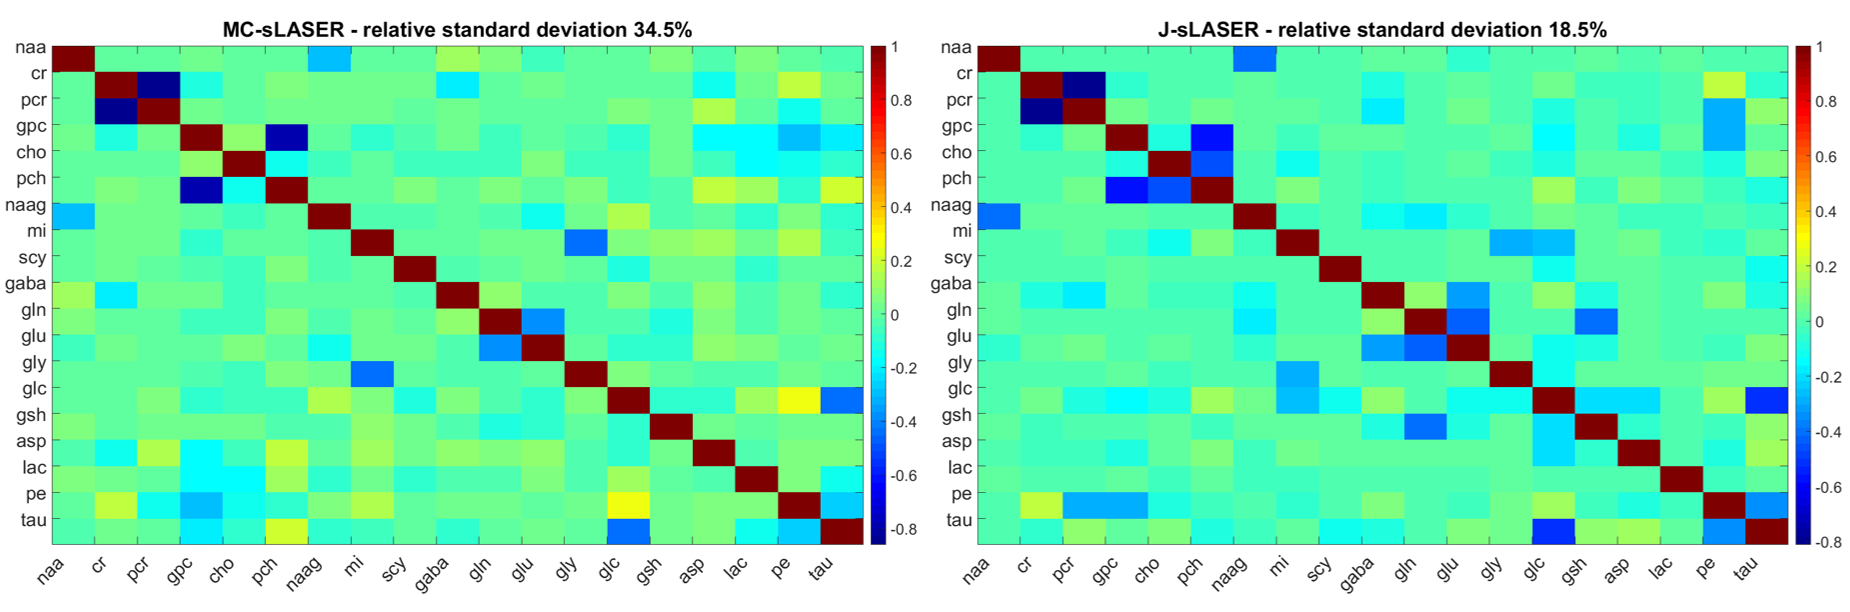
The correlation matrices presented slightly less correlated spectra for the 1D-MC-sLASER than the 2D-J-sLASER data fitted with the adapted ProFit-V2 software(Fig. 4).
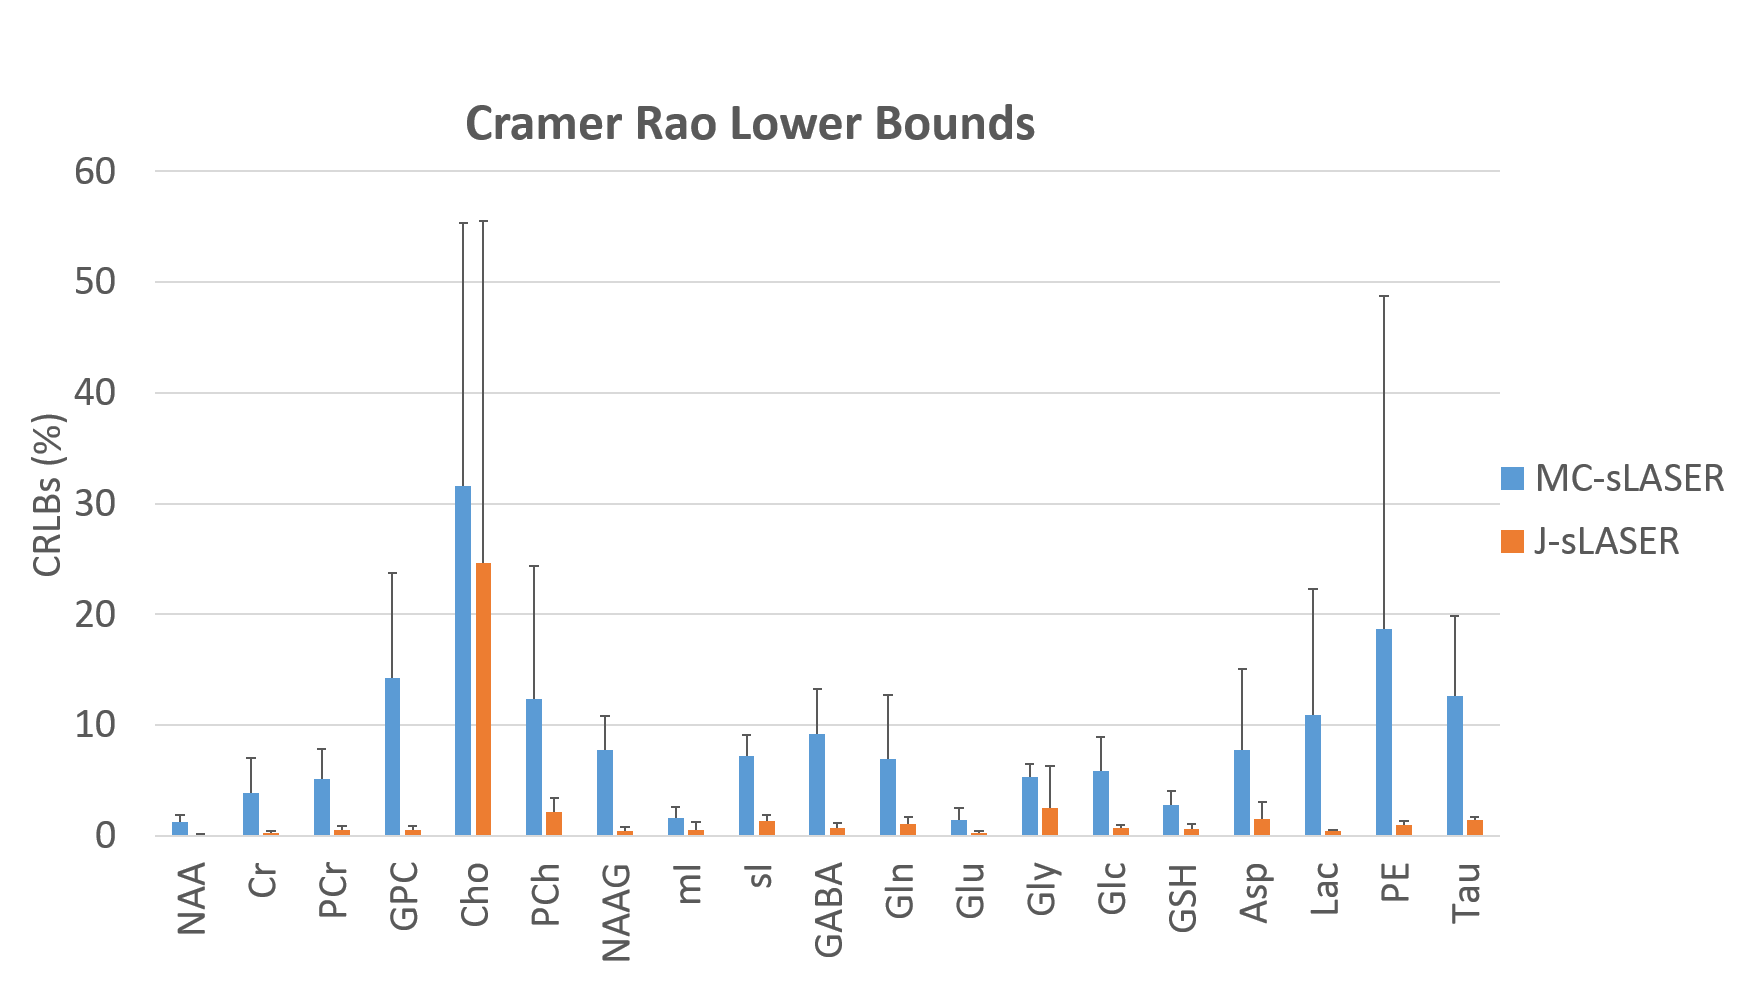
Finally, the calculated CRLBs were considerably smaller for the 2D-J-sLASER spectra, attributable also to the noise window free of metabolite signals and artifacts.
Discussion
Both the visual comparison of the NAA-aspartate moiety spectral pattern between simulated and real spectra and the fit results show that shorter echo times have to be considered and empirically optimized, when simulating basis sets for adiabatic sequences modeled with simplified sequences based on ideal pulses. The first preliminary results based on this fitting model for 2D-J-sLASER show good agreement, but will be further improved using an acquired macromolecular baseline and by applying spline line shape models in a 4th fit iteration.
The correlation matrices indicate the need to optimize acquisition parameters for the 2D-J-sLASER sequence as well as the fit model.
The low CRLBs of the fit of the 2D-J-sLASER data are in concordance with the field strength scaled values showed for the JPRESS data11.
Acknowledgements
The authors would like to acknowledge Alexander Fuchs for providing the original source code of ProFit-V2 fitting tool. This work was supported by the Horizon 2020 CDS-QUAMRI grant.References
1. Tannús A, Garwood M. Adiabatic pulses. NMR in Biomedicine. 1997;10(8):423-34.
2. Mangia S, Liimatainen T, Garwood M, Michaeli S. Rotating frame relaxation during adiabatic pulses vs. conventional spin lock: simulations and experimental results at 4 T. Magnetic resonance imaging. 2009;27(8):1074-87.
3. Deelchand DK, Henry PG, Marjanska M. Effect of carr-purcell refocusing pulse trains on transverse relaxation times of metabolites in rat brain at 9.4 Tesla. Magnetic resonance in medicine. 2015;73(1):13-20.
4. Thomas MA, Yue K, Binesh N, Davanzo P, Kumar A, Siegel B, et al. Localized two-dimensional shift correlated MR spectroscopy of human brain. Magnetic resonance in medicine. 2001;46(1):58-67.
5. Schulte RF, Lange T, Beck J, Meier D, Boesiger P. Improved two-dimensional J-resolved spectroscopy. NMR in Biomedicine. 2006;19(2):264-70.
6. Lange T, Trabesinger AH, Schulte RF, Dydak U, Boesiger P. Prostate spectroscopy at 3 Tesla using two-dimensional S-PRESS. Magnetic resonance in medicine. 2006;56(6):1220-8.
7. Lin M, Kumar A, Yang S. Two-dimensional J-resolved LASER and semi-LASER spectroscopy of human brain. Magnetic resonance in medicine. 2014;71(3):911-20.
8. Andronesi OC, Ramadan S, Mountford CE, Sorensen AG. Low-power adiabatic sequences for in vivo localized two-dimensional chemical shift correlated MR spectroscopy. Magnetic resonance in medicine. 2010;64(6):1542-56.
9. Ramadan S, Mountford CE. Adiabatic localized correlation spectroscopy (AL-COSY): Application in muscle and brain. Journal of Magnetic Resonance Imaging. 2011;33(6):1447-55.
10. Edden RA, Barker PB. If J doesn't evolve, it won't J-resolve: J-PRESS with bandwidth-limited refocusing pulses. Magnetic resonance in medicine. 2011;65(6):1509-14.
11. Fuchs A, Boesiger P, Schulte RF, Henning A. ProFit revisited. Magnetic Resonance in Medicine. 2014;71(2):458-68.
12. Giapitzakis IA, Shao T, Avdievich N, Kreis R, Henning A. Metabolite cycled semi-LASER in human at 9.4T: In-vivo results. ISMRM Workshop on MR Spectroscopy Lake Constance 2016.
13. Provencher SW. Estimation of metabolite concentrations from localized in vivo proton NMR spectra. Magnetic resonance in medicine. 1993;30(6):672-9.
14. Giapitzakis IA, Nassirpour S, Henning A. Short duration water suppresion using optimised ?ip angles (SODA) at ultra high ?elds. Conf Proc ESMRMB 2015; 519: S401-02.
15. Smith S, Levante T, Meier BH, Ernst RR. Computer simulations in magnetic resonance. An object-oriented programming approach. Journal of Magnetic Resonance, Series A. 1994;106(1):75-105.
16. Govindaraju V, Young K, Maudsley AA. Proton NMR chemical shifts and coupling constants for brain metabolites. NMR in Biomedicine. 2000;13(3):129-53.
17. Govind V, Young K, Maudsley AA. Corrigendum: Proton NMR chemical shifts and coupling constants for brain metabolites. Govindaraju V, Young K, Maudsley AA, NMR Biomed. 2000; 13: 129–153. NMR in Biomedicine. 2015;28(7):923-4.
18. Kaiser L, Young K, Meyerhoff D, Mueller S, Matson G. A detailed analysis of localized J-difference GABA editing: theoretical and experimental study at 4 T. NMR in Biomedicine. 2008;21(1):22-32.
19. Deelchand DK, Van de Moortele P-F, Adriany G, Iltis I, Andersen P, Strupp JP, et al. In vivo 1 H NMR spectroscopy of the human brain at 9.4 T: initial results. Journal of Magnetic Resonance. 2010;206(1):74-80.
20. Giapitzakis IA, Kreis R, Henning A. Characterization of the macromolecular baseline with a metabolite-cycled double-inversion recovery sequence in the human brain at 9.4T. 23rd Annual Meeting and Exhibition of ISMRM 2016; 0016
21. de Graaf RA. Spectral Quantification. In Vivo NMR Spectroscopy: John Wiley & Sons, Ltd; 2007. p. 464-466.
Figures