2994
Influence of broader spectral linewidths generated in vivo on metabolite quantification1Center for Magnetic Resonance Research and Department of Radiology, University of Minnesota, Minneapolis, MN, United States
Synopsis
To understand how linewidth impacts the current best practice of quantification, the novel approach was used to measure spectra of several linewidths from each subject in contrast to the traditional approach of mathematically broadening one reference spectrum. Mathematical broadening of an in vivo spectrum reproduced the lowering of tCr concentration reported in the past. In contrast, tCr concentrations measured from broader spectra obtained using suboptimal shims tended to be higher than those measured using ideal shims. Further inquiry into the exact source of these artifacts is likely to lead to corrective approaches.
Purpose
To understand how linewidth impacts the current best practice of quantification and motivate expansion of this frontier. The novel approach was to measure spectra of several linewidths from each subject in contrast to the traditional approach of mathematically broadening one reference spectrum1,2.Methods
Spectra of several linewidths were induced by increasing z2 B0 shims iteratively (steps of ~ 50 µT/m2). All 1H spectra were measured from the human brain on a 7-T Siemens system using: a 16-channel head RF coil, B1+ shimming3, and STEAM (TR = 5 s, TE = 8 ms, TM = 32 ms, VOI = 8 mL, 64 averages for occipital cortex (OCC), 128 averages for posterior cingulate cortex (PCC)4). A non-water suppressed spectrum was measured to accompany every metabolite spectrum for normalization of concentrations. Individually saved spectra were eddy current-, frequency- and phase- corrected before summing. B0 shimming of first- and second- order terms was initially optimized using FAST(EST)MAP5. A pair of metabolite and water spectra with several linewidths was measured from the OCC of 6 people (with several z2 shims). One spectrum from the PCC was mathematically line-broadened (steps of 2 Hz) and RMS noise was matched to the original spectrum. Spectra were analyzed using LCModel6 between 0.5 and 4.1 ppm with 17 metabolites (simulated) plus measured macromolecules (MM) in the basis set using spine baseline knot spacing (DKNTMN) of 57. Total creatine (tCr) linewidth was measured as FWHM at 3.03 ppm.Results
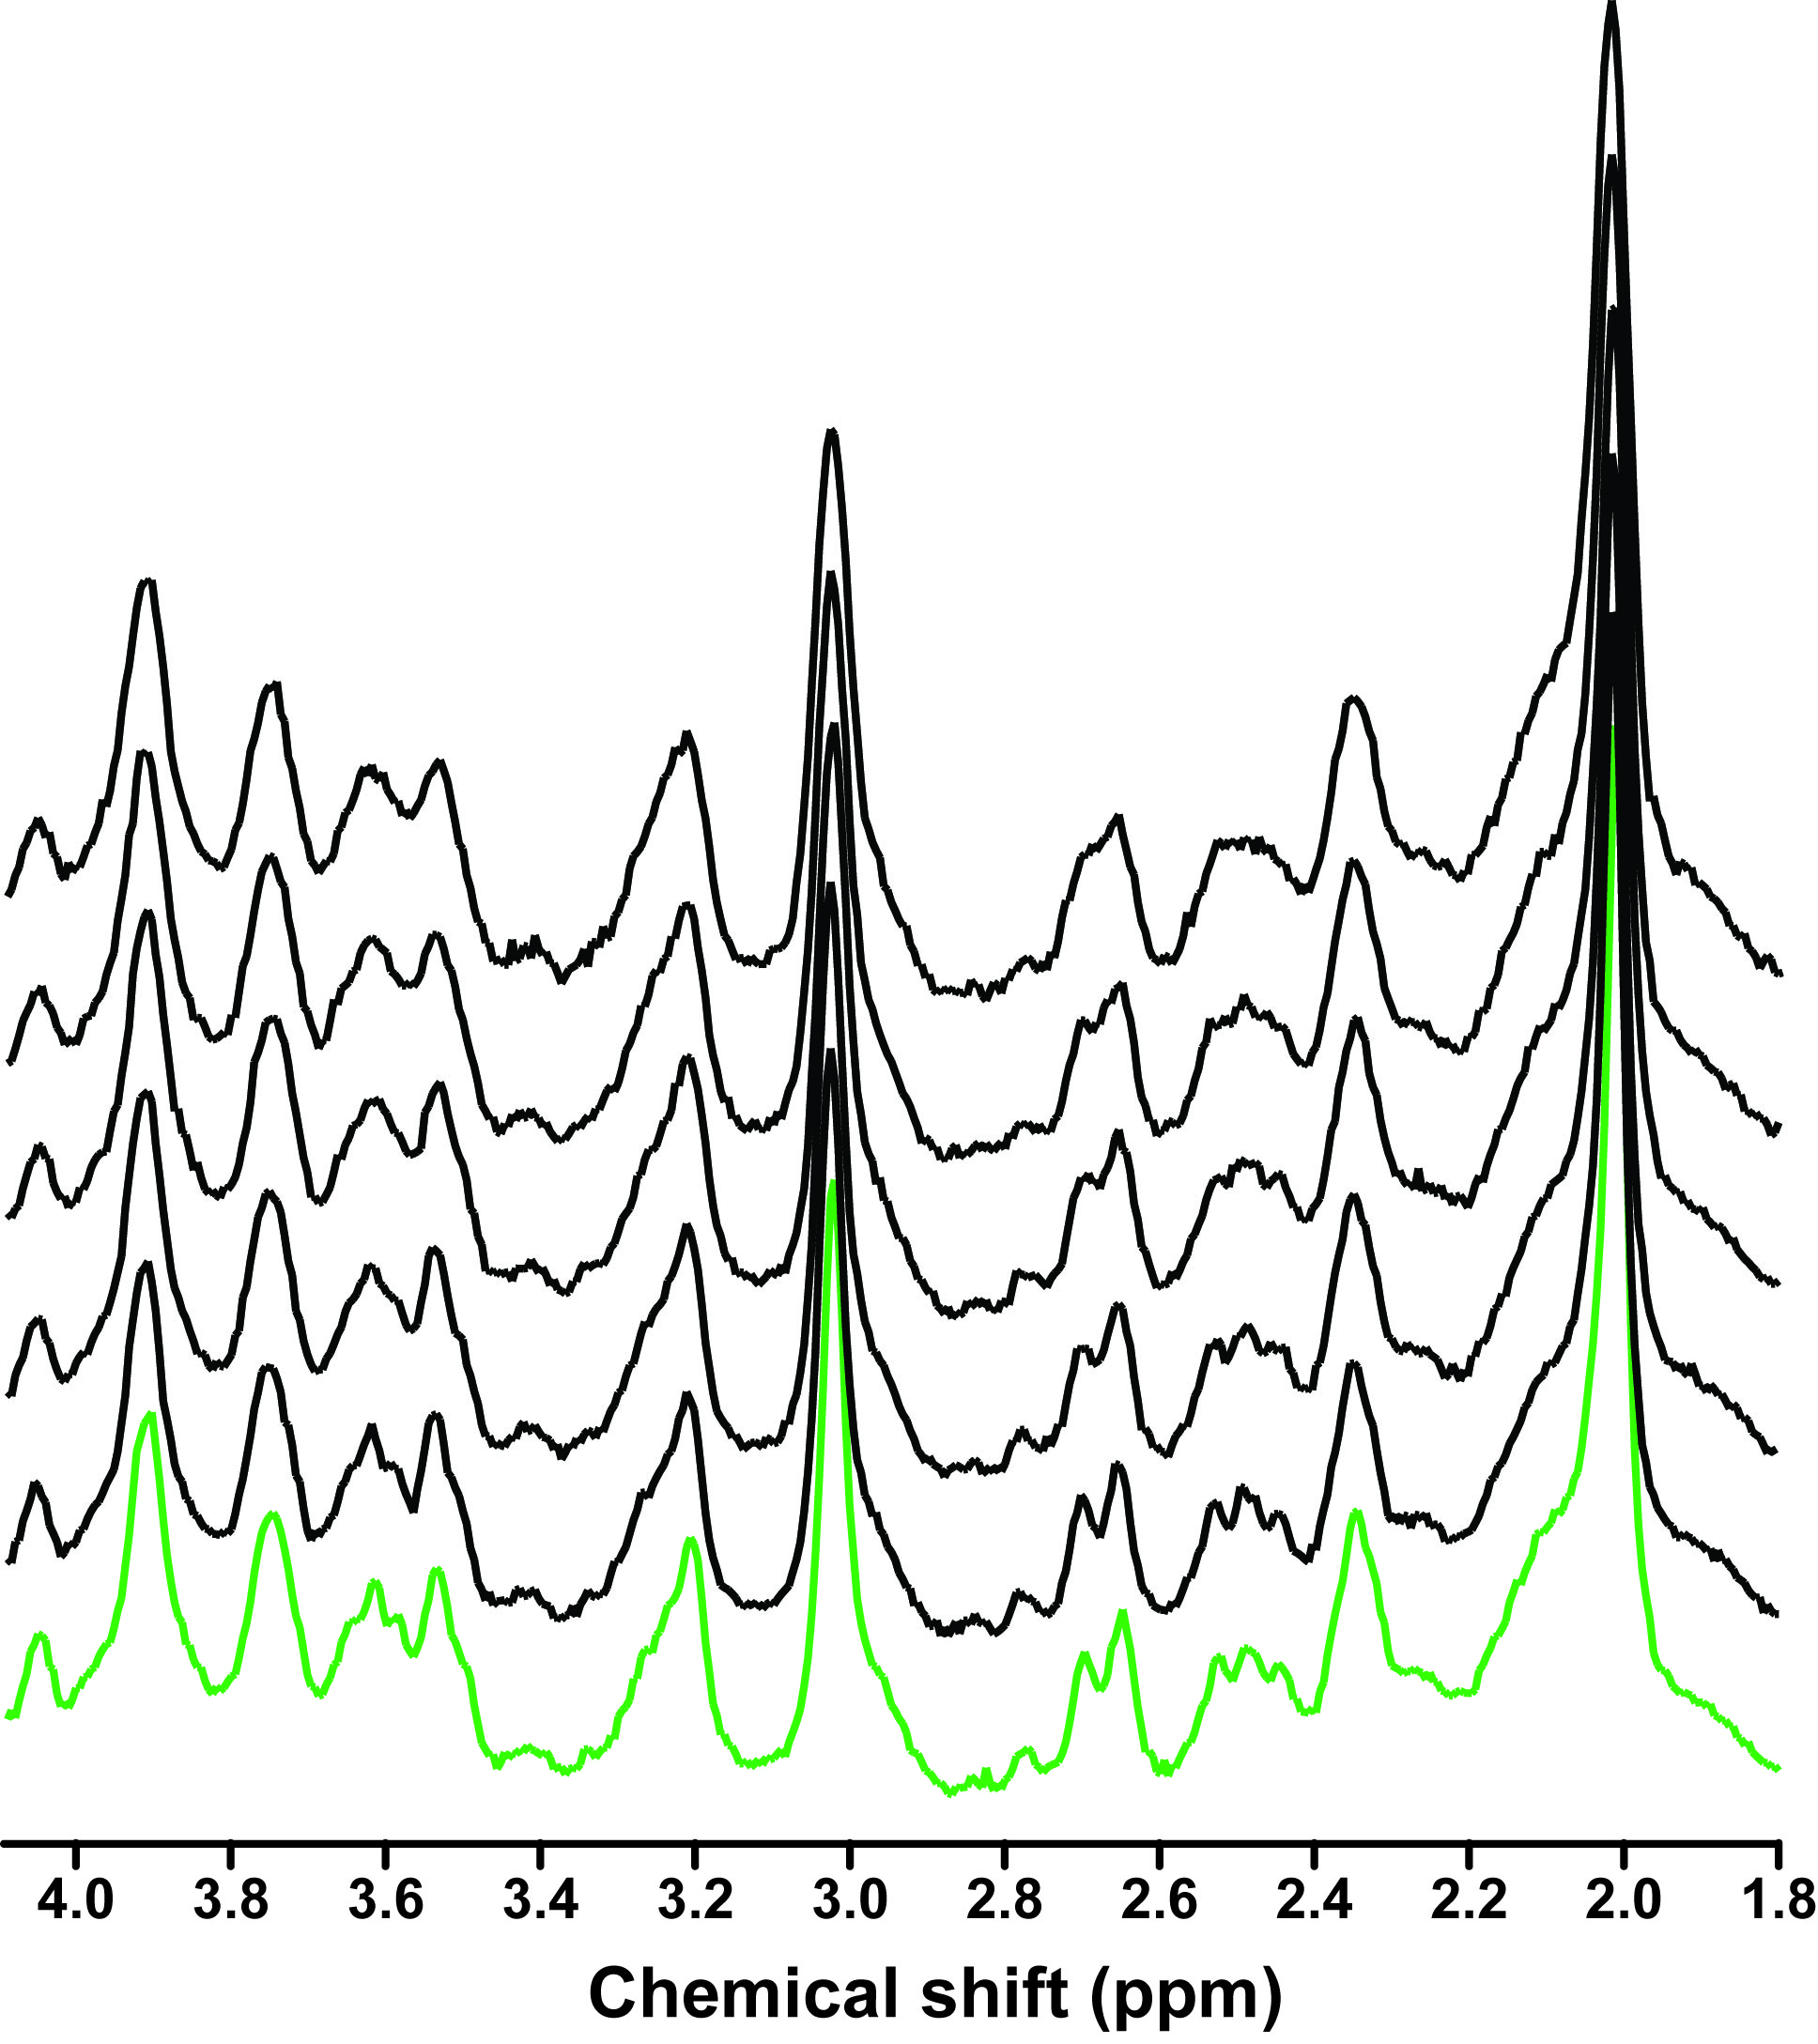
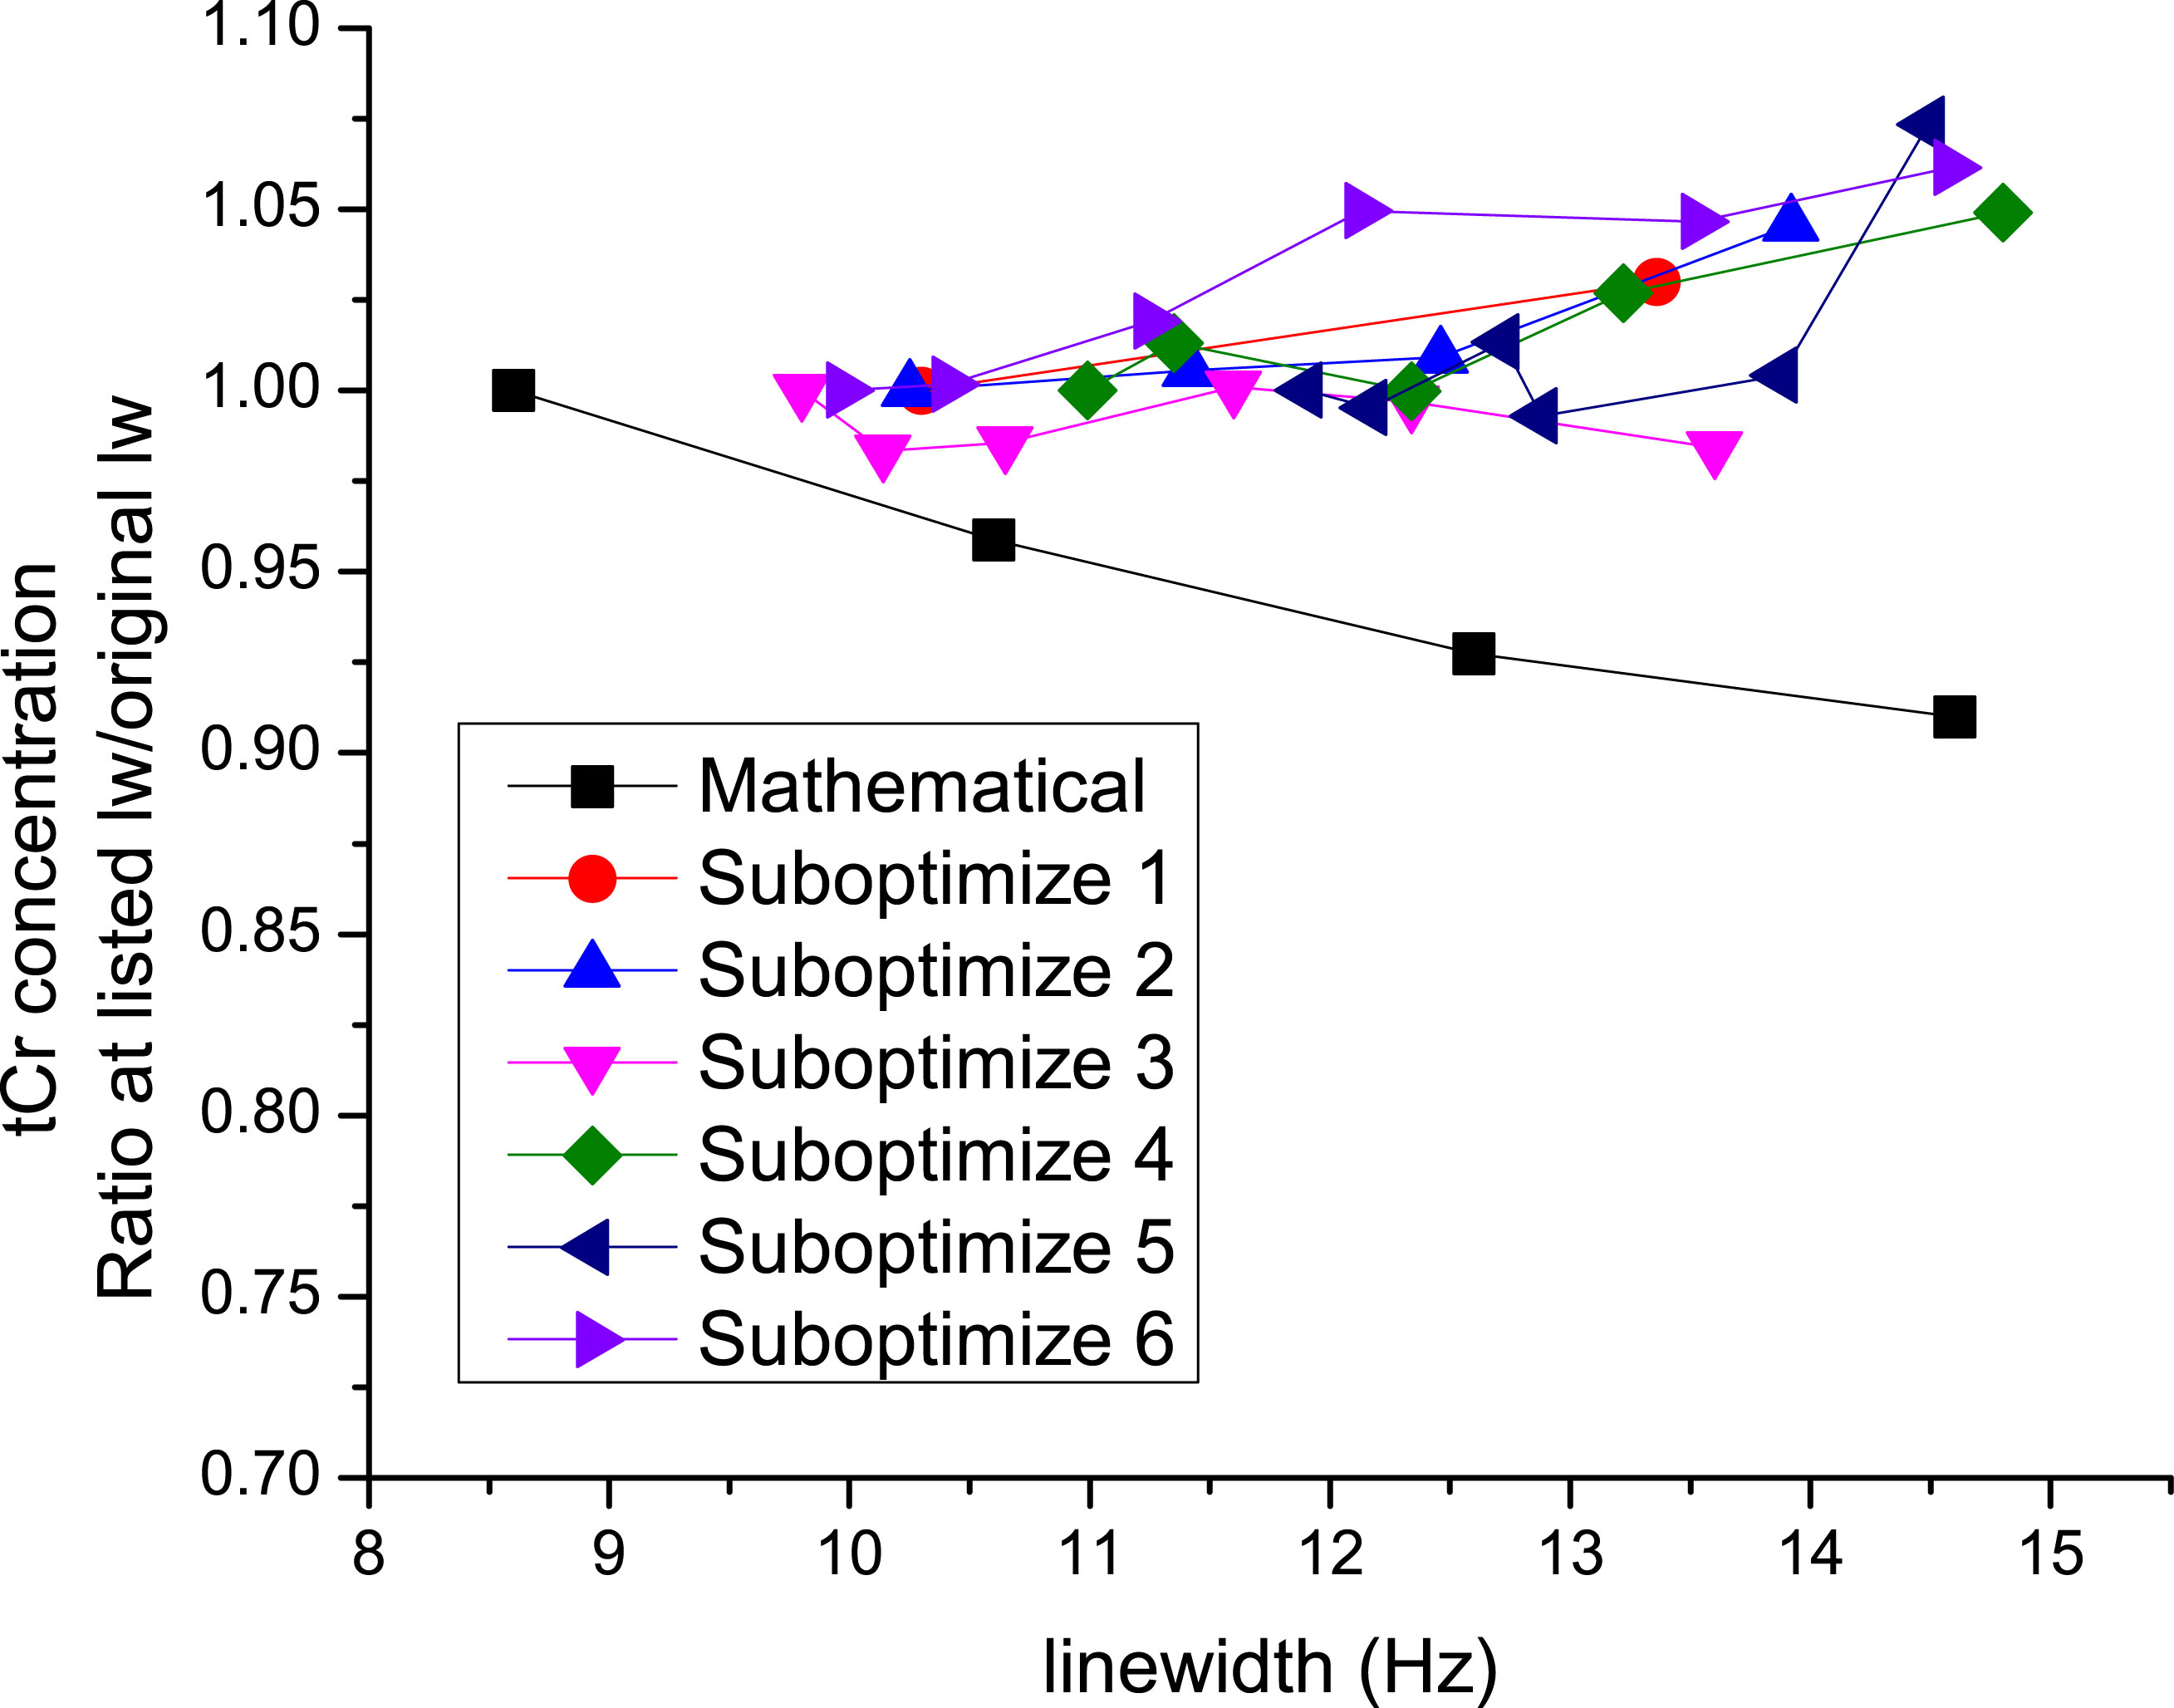
The in vivo spectra that were measured with sub-optimized shims were broader but retained typical line shape (Fig. 1). Mathematical broadening of an in vivo spectrum reproduced the lowering of tCr concentration that has been reported in the past (Fig. 2). In contrast, tCr concentrations measured from broader spectra obtained using suboptimal shims tended to be higher than those measured using ideal shims, the effect increasing as lines became broader (Fig. 2). For the other metabolites that have shown decreasing concentration with mathematically induced increasing linewidth in the past (when MM are included in the basis set), i.e., tNAA, tCho, and Glx, only tCho concentration in this study tended to change, increasing ~5% with an increase of 5 Hz linewidth induced by suboptimal shimming . Of all metabolites included in the basis set, PE and NAAG clearly realized a lowering of concentration on the order of 15% as suboptimal shimming caused 5 Hz broader lines. There were no additional metabolites that realized higher concentrations under suboptimal shims.Discussion
The range of linewidths studied is larger than the broadening from 10 to 11 Hz that we recently observed between the young and elderly. Several aspects of both line-broadening approaches warrant further consideration. While the mathematically broadened experiments matched SNR, this factor was allowed to vary naturally in the suboptimal shim experiments. Mathematically altered SNR have been shown to impact quantification1, 2. The mathematically broadened experiments (past and present) used a single water spectrum for normalization, whereas the suboptimal shim experiments used a naturally matched water spectrum to accompany the metabolite spectrum for each shim set. LCModel adjusts internally for linewidth. Finally, freedom in the spline baseline function of LCModel is an intervolved matter.Conclusion
The effect that inherent broadening of lines via suboptimal shimming had on measured concentration was opposite to that of mathematical broadening of lines. Further inquiry into the exact source of these artifacts is likely to lead to corrective approaches, such as adjusting the basis set for inherent linewidth8. This line of inquiry is likely to reveal that there is substantial room for improvement in the current best practice of spectral analysis. Analytical approaches will need to keep pace with the higher levels of spectral quality that are being attained as well as with efforts to achieve consensus and standardization.Acknowledgements
This project was supported by the NIH grants: NIA R01AG039396, P41 EB015894, and P30 NS076408.References
1. Marci et al. Magn Reson Imaging (2004) 22:1385
2. Kanowski et al. Magn Reson Med (MRM) (2004) 51:904
3. Metzger et al. MRM (2008) 59:396
4. Tkac et al. MRM (2001) 46:451
5. Gruetter et al. MRM (2000) 43:319
6. Provencher NMR Biomed (2001) 14:260
7. Deelchand et al. NMR Biomed (2016) 29:600
8. Deelchand et al. NMR Biomed (2015) 28:633
Figures