2993
Influence of age-specific macromolecular pattern on MRS quantification1Center for Magnetic Resonance Research and Department of Radiology, University of Minnesota, Minneapolis, MN, United States, 2Geriatric Research Education and Clinical Center, Minneapolis VA Medical Center, MN, United States
Synopsis
The resonances originating from high-molecular weight macromolecules (MM) underlie those of metabolites in brain 1H NMR spectra. In humans, MM content and MM pattern have been shown to depend on age of the subject. In this project, the influence of age-specific MM pattern on MR quantification was investigated. The age-associated differences in the MM pattern have a major influence on the quantification of metabolite concentrations in the aging brain which might lead to different interpretation of the data. This important finding suggests that the age-specific MM spectrum should be used in the basis set to obtain accurate concentrations of metabolites.
Purpose
The resonances originating from high-molecular weight macromolecules (MM) underlie those of metabolites in brain 1H NMR spectra. These resonances have different physical properties from those of metabolites such as shorter T1 and T2. It has been shown in humans that MM content1 and MM pattern2 can depend on age of the subject. The purpose of this study was to investigate influence of age-specific MM pattern on MRS quantification.Methods
Healthy volunteers (Montreal Cognitive Assessment scores ≥ 25), 17 young (age 19-22 years, 5 subjects scanned 3 times) and 16 elderly (age 70-88 years, 6 subjects scanned 3 times), were studied using a 7-T, 90-cm horizontal bore magnet equipped with a Siemens console and body gradients. A home-built 16-element transmit-receive transmission line head array3 was used and transmit phase of each channel was optimized via individual 1 kW CPC-amplifiers4. In vivo 1H NMR spectra were acquired from the 8 mL volume of interest placed in the occipital cortex (OCC) using a STEAM sequence with VAPOR water and outer volume suppression5 (TR = 5 s, TE = 8 ms, NA = 64). The macromolecule spectra were acquired using the inversion-recovery technique (TR = 2 s, TE = 8 ms, TI = 680 ms) in the OCC of 4 young (NA = 1532) and 3 elderly (NA = 960) participants. Metabolite concentrations were quantified using LCModel6 with a simulated basis set (18 metabolites and experimental age-specific macromolecule spectra) and water corrected for tissue content as the internal reference. Age groups were compared using a 2-tailed t-test. To control for multiple testing (14 neurochemicals), the threshold of significance was 0.00357 = 0.05/14.Results
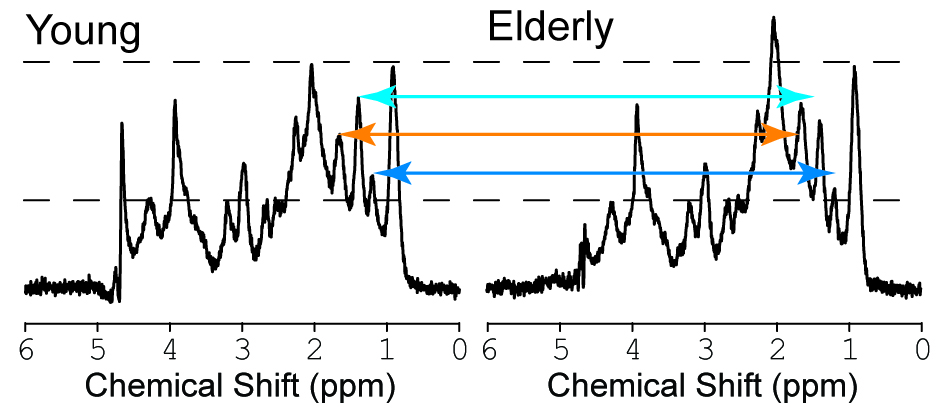
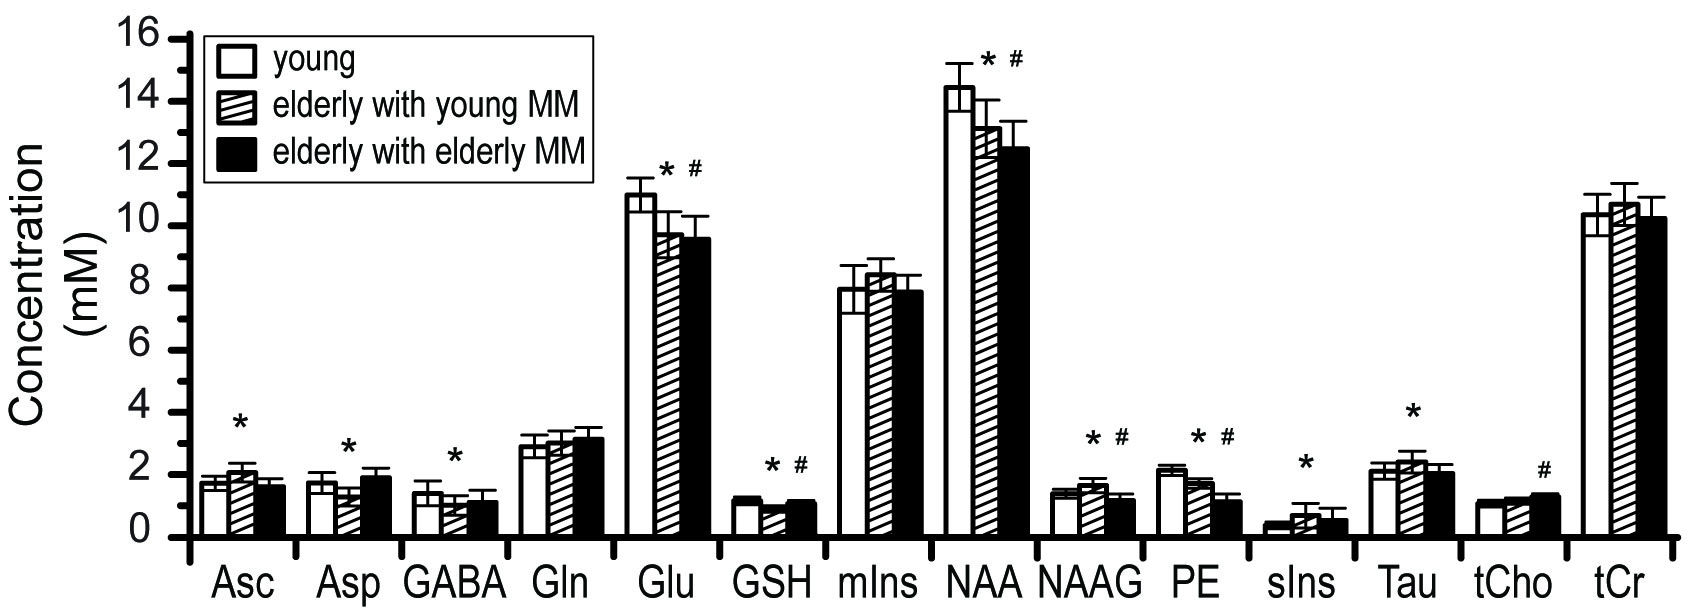
Figure 1 shows MM spectra underlying the entire ppm range and illustrates age-associated differences in the MM pattern. Figure 2 shows the concentrations of the 14 metabolites that were quantified reliably for both young and elderly subjects. When young MM were used to fit elderly data, significant differences in concentrations were observed for 10 out of 14 metabolites between young and elderly with some metabolites being significantly lower (Asp, GABA, Glu, GSH, NAA, PE) and some higher (Asc, NAAG, sIns, Tau). When elderly MM were used to fit elderly data, significant differences in concentrations were observed for 6 out of 14 metabolites between young and elderly with some metabolites being significantly lower (Glu, GSH, NAA, NAAG, PE) and tCho higher.Discussion
Age-associated differences in the MM pattern resulted in quantification differences for the elderly data. The number of metabolites for which significant findings were obtained reduced when age-appropriate MM were used for the fitting of the data. For some metabolites such as Glu, GSH, NAA, and PE the findings were the same while for NAAG, the findings were dramatically different.Conclusions
The age-associated differences in the MM pattern have a major influence on the quantification of metabolite concentrations in the aging brain which might lead to different interpretation of the data. This important finding suggests that the age-specific MM spectrum should be used in the basis set to obtain accurate concentrations of metabolites.Acknowledgements
This project was supported by the NIH grants: NIA R01AG039396, P41 EB015894, and P30 NS076408.References
1. Hofmann L, Slotboom J, Boesch C, Kreis R. Characterization of the macromolecule baseline in localized 1H-MR spectra of human brain. Magn Reson Med 2001;46(5):855-863.
2. Marjanska M, McCarten JR, Hemmy LS, Terpstra M. Altered macromolecular pattern in aging brain. 2015; Toronto. International Society of Magnetic Resonance in Medicine. p 4658.
3. Adriany G, De Moortele PFV, Ritter J, Moeller S, Auerbach EJ, Akgun C, Snyder CJ, Vaughan T, Ugurbill K. A geometrically adjustable 16-channel transmit/receive transmission line array for improved RF efficiency and parallel imaging performance at 7 Tesla. Magn Reson Med 2008;59(3):590-597.
4. Metzger GJ, Snyder C, Akgun C, Vaughan T, Ugurbil K, Van de Moortele PF. Local B1+ shimming for prostate imaging with transceiver arrays at 7T based on subject-dependent transmit phase measurements. Magn Reson Med 2008;59(2):396-409.
5. Tkac I, Andersen P, Adriany G, Merkle H, Ugurbil K, Gruetter R. In vivo 1H NMR spectroscopy of the human brain at 7 T. Magn Reson Med 2001;46(3):451-456.
6. Provencher SW. Estimation of metabolite concentrations from localized in vivo proton NMR spectra. Magn Reson Med 1993;30(6):672-679.
Figures