2992
Basis set optimization for quantification of semi-LASER at 9.4T under consideration of CP effect and relaxation1High Field Magnetic Resonance, Max Planck Institute for Biological Cybernetics, Tuebingen, Germany, 2Graduate School of Neural and Behavioural Sciences, Tuebingen, Germany, 3Institute of Physics, Ernst-Moritz-Arndt University Greifswald, Greifswald, Germany
Synopsis
In this abstract, we evaluated the Carr-Purcell behavior of semi-LASER sequence at 9.4T and we studied the influence of different relaxation times between the different moieties of NAA and NAAG using in-vivo acquired from occipital lobe and simulated spectra. The results indicate that differences in the relaxation time between different moieties can affect the fitting results and the metabolites levels. Moreover, an estimated value for the relaxation time of NAA-aspartate moiety is given. This work indicates that more measurements and investigation should be done, studying more metabolites and brain regions.
Purpose
Semi-LASER seems an excellent candidate for magnetic resonance spectroscopy (MRS) applications at ultra high fields (UHF) due to its advantages such as localization efficiency, reduced chemical-shift-displacement and B1+ insensitivity1. One interesting characteristic is the reduction of scalar evolution between coupled metabolites since semi-LASER behaves as a Carr-Purcell sequence2 (CP) simplifying the resulting spectral profile. Studies have reported differences in the measurement of T2 relaxation times of several metabolites and even among different moieties of the same metabolite when they are measured with CP techniques due to diffusion and chemical exchange refocusing3 and also when adiabatic pulses are used4 due to its spin-lock effect. The purpose of this study was the investigation of the J-coupling evolution and relaxation in semi-LASER spectra at 9.4T due to its CP behavior using experiments and simulations and to derive an optimized basis set for spectral fitting.Methods
All the measurements were performed on a 9.4T whole-body MRI scanner (Siemens Healthcare, Erlangen, Germany) using a home-built proton coil with 8-transmit and 16-receive channels. Nine healthy volunteers participated in this study. A spectroscopy voxel (2x2x2 cm2) was chosen in a mixed gray matter and white matter area in the occipital lobe. Bo shimming was performed using FASTE(ST)MAP5 and voxel-based power calibration6 was executed. MRS data were acquired using Metabolite cycled (MC) semi-LASER7 (TE/TR: 24/6000 ms) and were analyzed with LCModel V6.3-1L8 with a simulated basis set consisting of 19 metabolites using PyGAMMA9 and experimentally measured chemical shifts and J-coupling values10-12. MC semi-LASER basis sets were simulated using a simple two-pulse spin echo sequence with ideal pulses for different TE. For the assessment of potential differences in relaxation times between the aspartate and acetate moieties of NAA and NAAG, different ratios of the aspartate moiety over the acetate moiety (from 0.7 to 1 with steps of 0.05) were assumed in the final simulated NAA and NAAG basis sets. Measured macromolecular templates were also included in the fitting model7.Results
Simulated NAA-aspartate moiety spectra demonstrate that spin echo sequence with TE of 6.5 ms matches better in-vivo NAA-aspartate data compared to 24 ms because of the inhibition of J-coupling evolution of MC semi-LASER sequence due to its CP behavior. Fig. 2 shows the reduction of the residuals in the range of 2.4 to 2.7ppm when smaller ratios of aspartate moiety are used. The improvement of the residuals in case of the ratios of 0.75 is consistent among different volunteers and significant differences were found (Fig. 3; P < 0.002). Moreover, LCModel results illustrate the improvement of the overall fitting when a ratio of 0.75 is assumed (Fig. 4).
Despite the improvement of the residuals when relaxation is included, it appears the requirement of further optimization (e.g. J-coupling values) since the basis set does not fit perfectly to the NAA-aspartate.
Finally, metabolite concentrations (mM) and Cramer-Raw low bounds (CRLBs) demonstrate potential differences in the result quantifications (Fig. 5), however, without significant statistical difference due to multiple comparisons correction. An estimation of the relaxation time of NAAasp can be exported using the following equations:
$$S_{NAA_{asp}}\propto[NAA_{asp}]\cdot e^{-\frac{TE}{t_{NAA_{asp}}}} [Eq. 1]$$
$$S_{NAA_{ace}}\propto[NAA_{ace}]\cdot e^{-\frac{TE}{t_{NAA_{ace}}}} [Eq. 2]$$
where $$$S_{NAA_{asp}}, S_{NAA_{ace}}$$$ are the acquired signals; $$$[NAA_{asp}], [NAA_{ace}]$$$ the concentrations and $$$ t_{NAA_{asp}}, t_{NAA_{ace}} $$$ the relaxation times of NAA aspartate and acetyl moieties respectively
From Eq. 1 over Eq.2 and $$$[NAA_{asp}] = [NAA_{ace}]$$$ we get
$$\frac{S_{NAA_{asp}}}{S_{NAA_{ace}}}=e^{\frac{TE\cdot t_{NAA_{ace}}-TE\cdot t_{NAA_{asp}}}{t_{NAA_{ace}}\cdot t_{NAA_{asp}}}}\Rightarrow ln(\frac{S_{NAA_{asp}}}{S_{NAA_{ace}}})={\frac{TE\cdot t_{NAA_{ace}}-TE\cdot t_{NAA_{asp}}}{t_{NAA_{ace}}\cdot t_{NAA_{asp}}}} [Eq. 3]$$
Setting $$$ R=\frac{S_{NAA_{asp}}}{S_{NAA_{ace}}} $$$ from Eq. 3 we get:
$$t_{NAA_{asp}} ={\frac{TE\cdot t_{NAA_{ace}}}{1-t_{NAA_{ace}}\cdot lnR}} [Eq. 4]$$
In this work TE = 24 ms, $$$R\sim0.75$$$ and $$$t_{NAA_{ace}}=98$$$ ms13. Thus $$$\bf t_{NAA_{asp}}\sim80.6$$$ ms
Discussion
The results of this UHF study verify previous studies regarding the CP behavior and J-evolution inhibition of the semi-LASER sequence3,14,15. In this abstract, the influence of different relaxation times between acetate and aspartate moieties in NAA and NAAG metabolites onto fitting results was evaluated. The results highlight the need of careful creation of the basis sets including optimized TEs and relaxation times between different moieties inside metabolites. Despite the improvement of the residuals when relaxation is included, it appears the requirement of further optimization since the basis set does not fit perfectly to the NAA-aspartate.
The reported $$$t_{NAA_{asp}}$$$ is an estimation since it is known that CP-like sequences exhibit longer relaxation times16 and the published-used NAA-acetate relaxation time was measured with a STEAM sequence13.
Finally, more studies have to be performed in order to investigate potential differences between different moieties of other metabolites that may affect the quantification results, as well as,in different brain regions.
Acknowledgements
No acknowledgement found.References
1. Scheenen TW, Klomp DW, Wijnen JP, Heerschap A. Short echo time 1H-MRSI of the human brain at 3T with minimal chemical shift displacement errors using adiabatic refocusing pulses. Magn Reson Med 2008;59:1-6.
2. Allerhand A, Thiele E. Analysis of Carr—Purcell Spin-Echo NMR Experiments on Multiple-Spin Systems. II. The Effect of Chemical Exchange. The Journal of Chemical Physics 1966;45:902-916. 3. Deelchand DK, Henry PG, Marjanska M. Effect of Carr-Purcell refocusing pulse trains on transverse relaxation times of metabolites in rat brain at 9.4 Tesla. Magn Reson Med 2015;73:13-20. 4. Garwood M, DelaBarre L. The Return of the Frequency Sweep: Designing Adiabatic Pulses for Contemporary NMR. Journal of Magnetic Resonance 2001;153:155-177.
5. Gruetter R, Tkac I. Field mapping without reference scan using asymmetric echo-planar techniques. Magn Reson Med 2000;43:319-23.
6. Versluis MJ, Kan HE, van Buchem MA, Webb AG. Improved signal to noise in proton spectroscopy of the human calf muscle at 7 T using localized B1 calibration. Magnetic Resonance in Medicine 2010;63:207-211.
7. Giapitzakis IA, Kreis R, Henning A. Characterization of the macromolecular baseline with a metabolite-cycled double-inversion recovery sequence in the human brain at 9.4T. 2016; Singapore. 8. Provencher SW. Automatic quantitation of localized in vivo 1H spectra with LCModel. NMR Biomed 2001;14:260-4.
9. Smith SA, Levante TO, Meier BH, Ernst RR. Computer Simulations in Magnetic Resonance. An Object-Oriented Programming Approach. Journal of Magnetic Resonance, Series A 1994;106:75-105. 10. Govind V, Young K, Maudsley AA. Corrigendum: proton NMR chemical shifts and coupling constants for brain metabolites. Govindaraju V, Young K, Maudsley AA, NMR Biomed. 2000; 13: 129-153. NMR Biomed 2015;28:923-4.
11. Govindaraju V, Young K, Maudsley AA. Proton NMR chemical shifts and coupling constants for brain metabolites. NMR Biomed 2000;13:129-53.
12. Kreis R, Bolliger CS. The need for updates of spin system parameters, illustrated for the case of gamma-aminobutyric acid. NMR Biomed 2012;25:1401-3.
13. Deelchand DK, Van de Moortele PF, Adriany G, Iltis I, Andersen P, Strupp JP, Vaughan JT, Ugurbil K, Henry PG. In vivo 1H NMR spectroscopy of the human brain at 9.4 T: initial results. J Magn Reson 2010;206:74-80.
14. Boer VO, van Lier AL, Hoogduin JM, Wijnen JP, Luijten PR, Klomp DW. 7-T (1) H MRS with adiabatic refocusing at short TE using radiofrequency focusing with a dual-channel volume transmit coil. NMR Biomed 2011;24:1038-46.
15. Oz G, Tkac I. Short-echo, single-shot, full-intensity proton magnetic resonance spectroscopy for neurochemical profiling at 4 T: validation in the cerebellum and brainstem. Magn Reson Med 2011;65:901-10.
16. Bartha R, Michaeli S, Merkle H, Adriany G, Andersen P, Chen W, Ugurbil K, Garwood M. In vivo 1H2O T2+ measurement in the human occipital lobe at 4T and 7T by Carr-Purcell MRI: detection of microscopic susceptibility contrast. Magn Reson Med 2002;47:742-50.
Figures
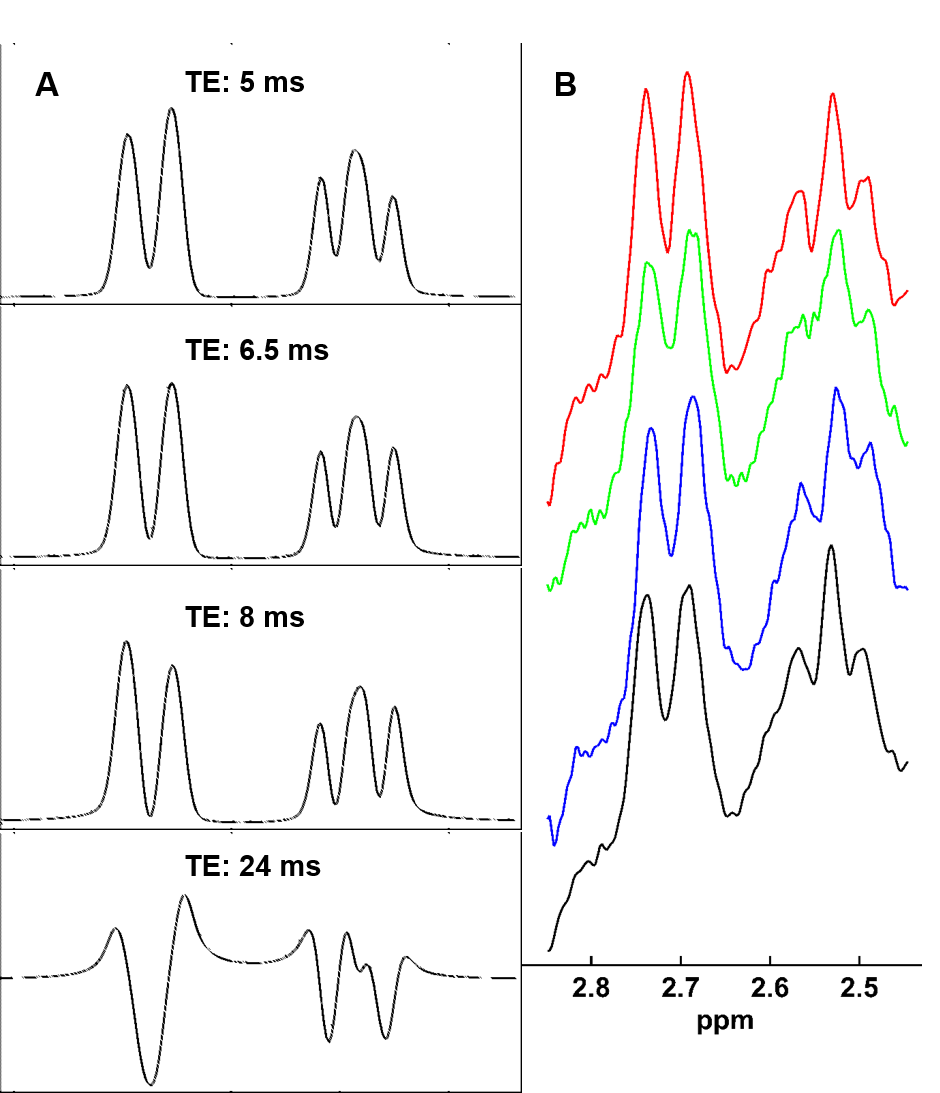
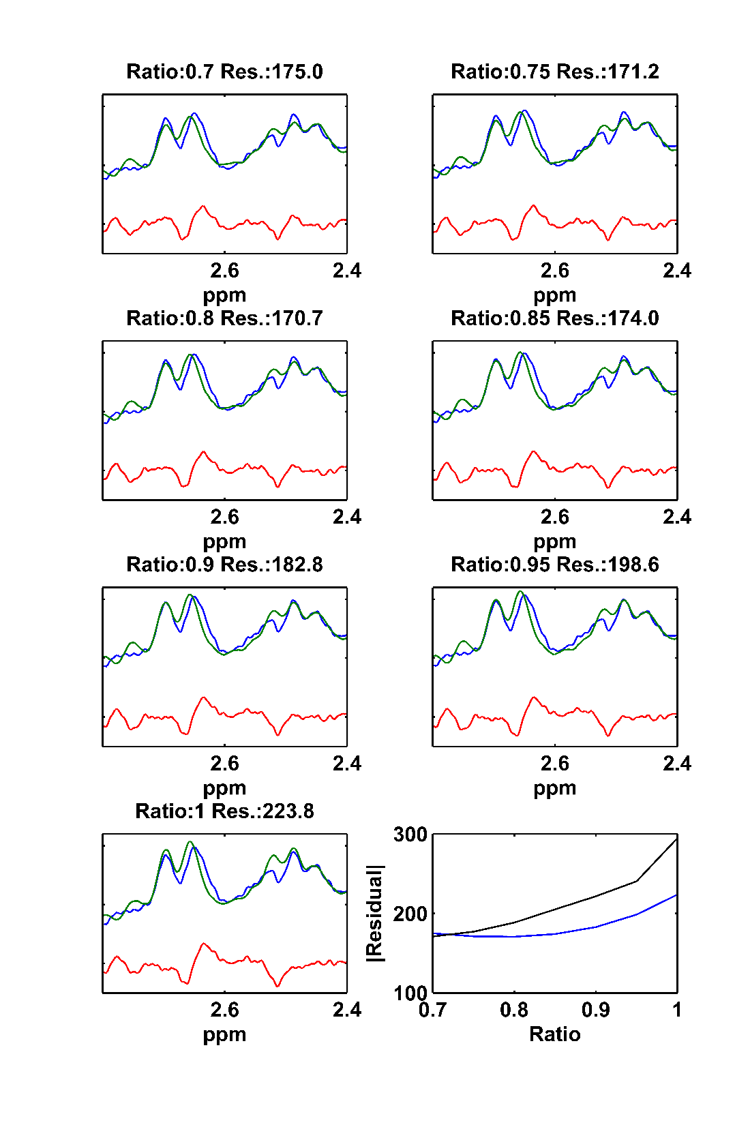
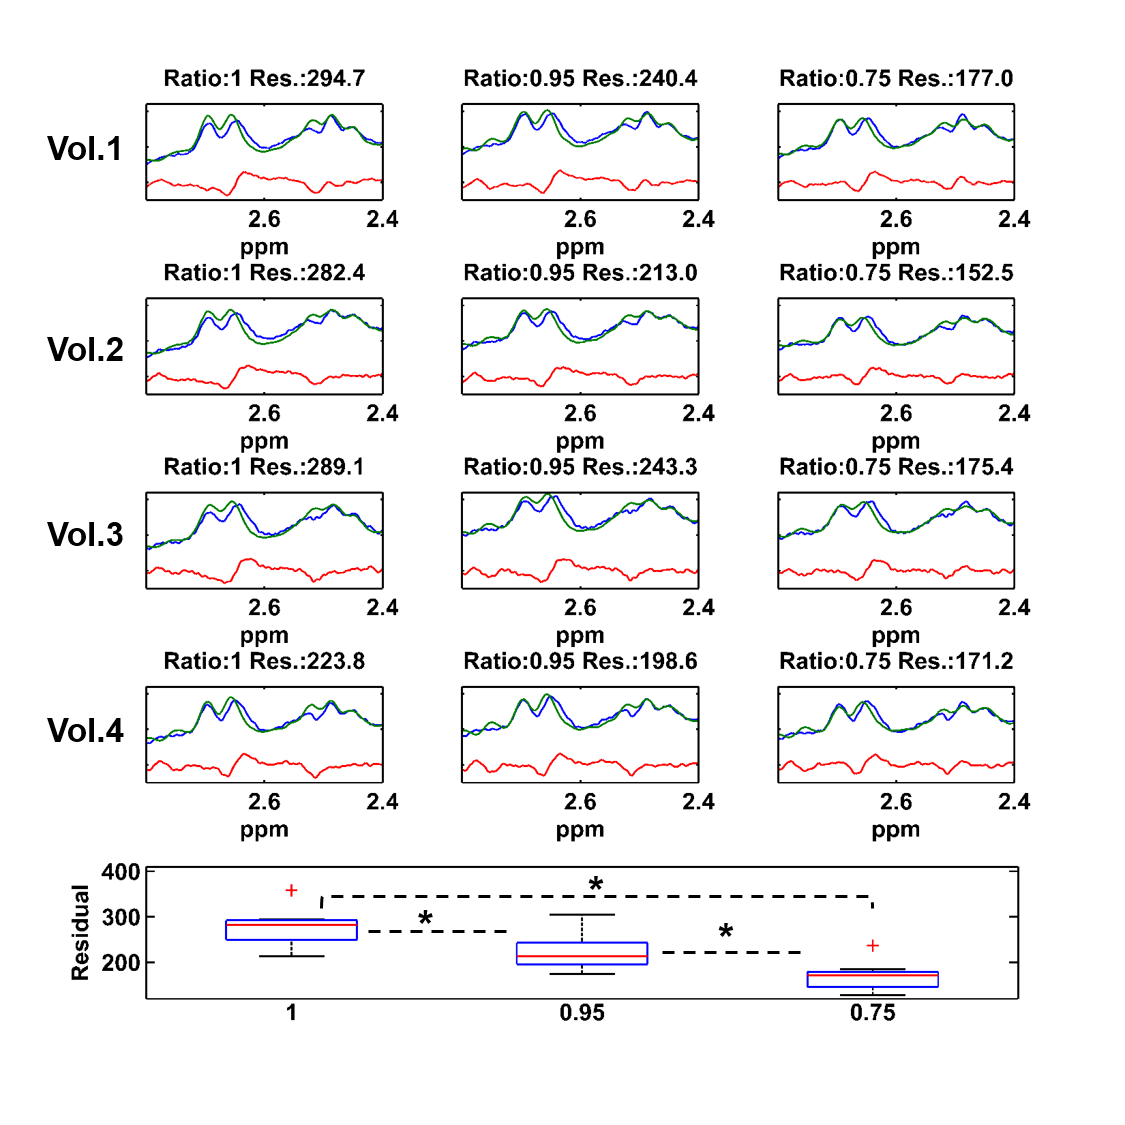

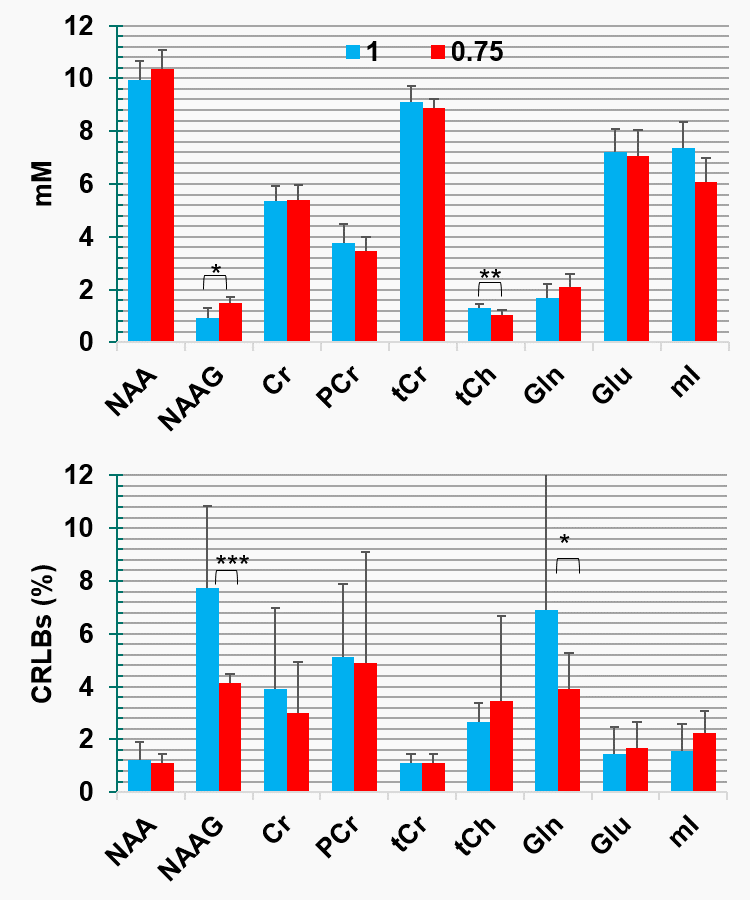
Figure 5: LCModel quantification results for two different ratios (1 and 0.75) for 9 datasets. Bars indicate the mean values and error bars the standard deviation. Significant differences did not survive after multiple comparisons correction. However, potentials differences are reported: *(P< 0.008), **(P< 0.004) and ***(P< 0.016)