2990
Integrative analysis of GABA-edited MRS data acquired at 19 research sites1Russell H. Morgan Department of Radiology and Radiological Science, The Johns Hopkins University School of Medicine, Baltimore, MD, United States, 2F. M. Kirby Research Center for Functional Brain Imaging, Kennedy Krieger Institute, Baltimore, MD, United States, 3Department of Radiology, Haukeland University Hospital, Bergen, Norway, 4Department of Clinical Medicine, University of Bergen, Bergen, Norway, 5Spinoza Centre for Neuroimaging, Amsterdam, Netherlands, 6Department of Radiology, Cincinnati Children’s Hospital Medical Center, Cincinnati, OH, United States, 7Department of Biomedical Engineering, The Johns Hopkins University School of Medicine, Baltimore, MD, United States, 8Department of Radiology, Taipei Medical University Shuang Ho Hospital, New Taipei City, Taiwan, 9Department of Biological and Medical Psychology, University of Bergen, Bergen, Norway, 10NORMENT – Norwegian Center for Mental Disorders Research, University of Bergen, Bergen, Norway, 11Department of Kinesiology, KU Leuven, Leuven, Belgium, 12REVAL Rehabilitation Research Center, Hasselt University, Diepenbeek, Belgium, 13Brain and Consciousness Research Centre, Taipei Medical University, Taipei, Taiwan, 14School of Health Sciences, Purdue University, West Lafayette, IN, United States, 15Department of Neuroimaging, Central Institute of Mental Health, Mannheim, Germany, 16Department of Clinical Engineering, Haukeland University Hospital, Bergen, Norway, 17Helen Wills Neuroscience Institute, University of California, Berkeley, Berkeley, CA, United States, 18Department of Radiology, University of Calgary, Calgary, AB, Canada, 19Department of Neurology, BG University Hospital Bergmannsheil, Bochum, Germany, 20Department of Radiology, Taipei Veterans General Hospital, National Yang-Ming University School of Medicine, Taipei, Taiwan, 21Department of Radiology, Maastricht University Medical Center, Maastricht, Netherlands, 22GE Healthcare, Calgary, AB, Canada, 23GE Healthcare, Taipei, Taiwan, 24Department of Psychology, University of Washington, Seattle, WA, United States, 25GE Healthcare, Berlin, Germany, 26Department of Electrical and Computer Engineering, McMaster University, Hamilton, ON, Canada, 27Department of Psychiatry and Behavioral Sciences, Medical University of South Carolina, Charleston, SC, United States, 28Department of Radiology, Children's Hospital of Philadelphia, Philadelphia, PA, United States, 29Research Imaging Centre, Centre for Addiction and Mental Health, Toronto, ON, Canada, 30Department of Psychology, University of Toronto, Toronto, ON, Canada, 31School of Biomedical Engineering, McMaster University, Hamilton, ON, Canada, 32Leuven Research Institute for Neuroscience & Disease (LIND), KU Leuven, Leuven, Belgium, 33Department of Diagnostic and Interventional Radiology, University Düsseldorf, Düsseldorf, Germany, 34Department of Biostatistics, Johns Hopkins Bloomberg School of Public Health, Baltimore, MD, United States, 35Institute of Clinical Neuroscience and Medical Psychology, Heinrich-Heine-University Düsseldorf, Düsseldorf, Germany
Synopsis
In this large multi-vendor, multi-site study, we seek to better understand the factors that impact quantitative outcomes of GABA-edited MR spectroscopy. Data from 187 participants from 19 research sites acquired on scanners from the three major vendors were pooled and analyzed using a standard pipeline. Coefficients of variation for GABA measurements acquired on each scanner platform and across the entire cohort were less than 11%. Multilevel linear modelling showed that most of the variance was accounted for by participant-level differences, while vendor-level differences accounted for comparatively more proportional variance than site-level differences.
Purpose
Detection and quantification of γ-aminobutyric acid (GABA) by J-difference spectral editing has received significant attention in the neuroimaging community in recent years [1]. However, implementation of the most common GABA-editing technique, MEGA-PRESS [2], remains diverse across MR scanner vendors and research sites. Differences in implementation make it difficult to compare data reported in the literature. We present initial results from a large multi-vendor, multi-site study in which GABA-edited data were pooled together and analyzed using a standard pipeline. Our objective is to compare GABA measurements acquired on different platforms and at different sites to determine which factors influence quantitative outcomes.Methods
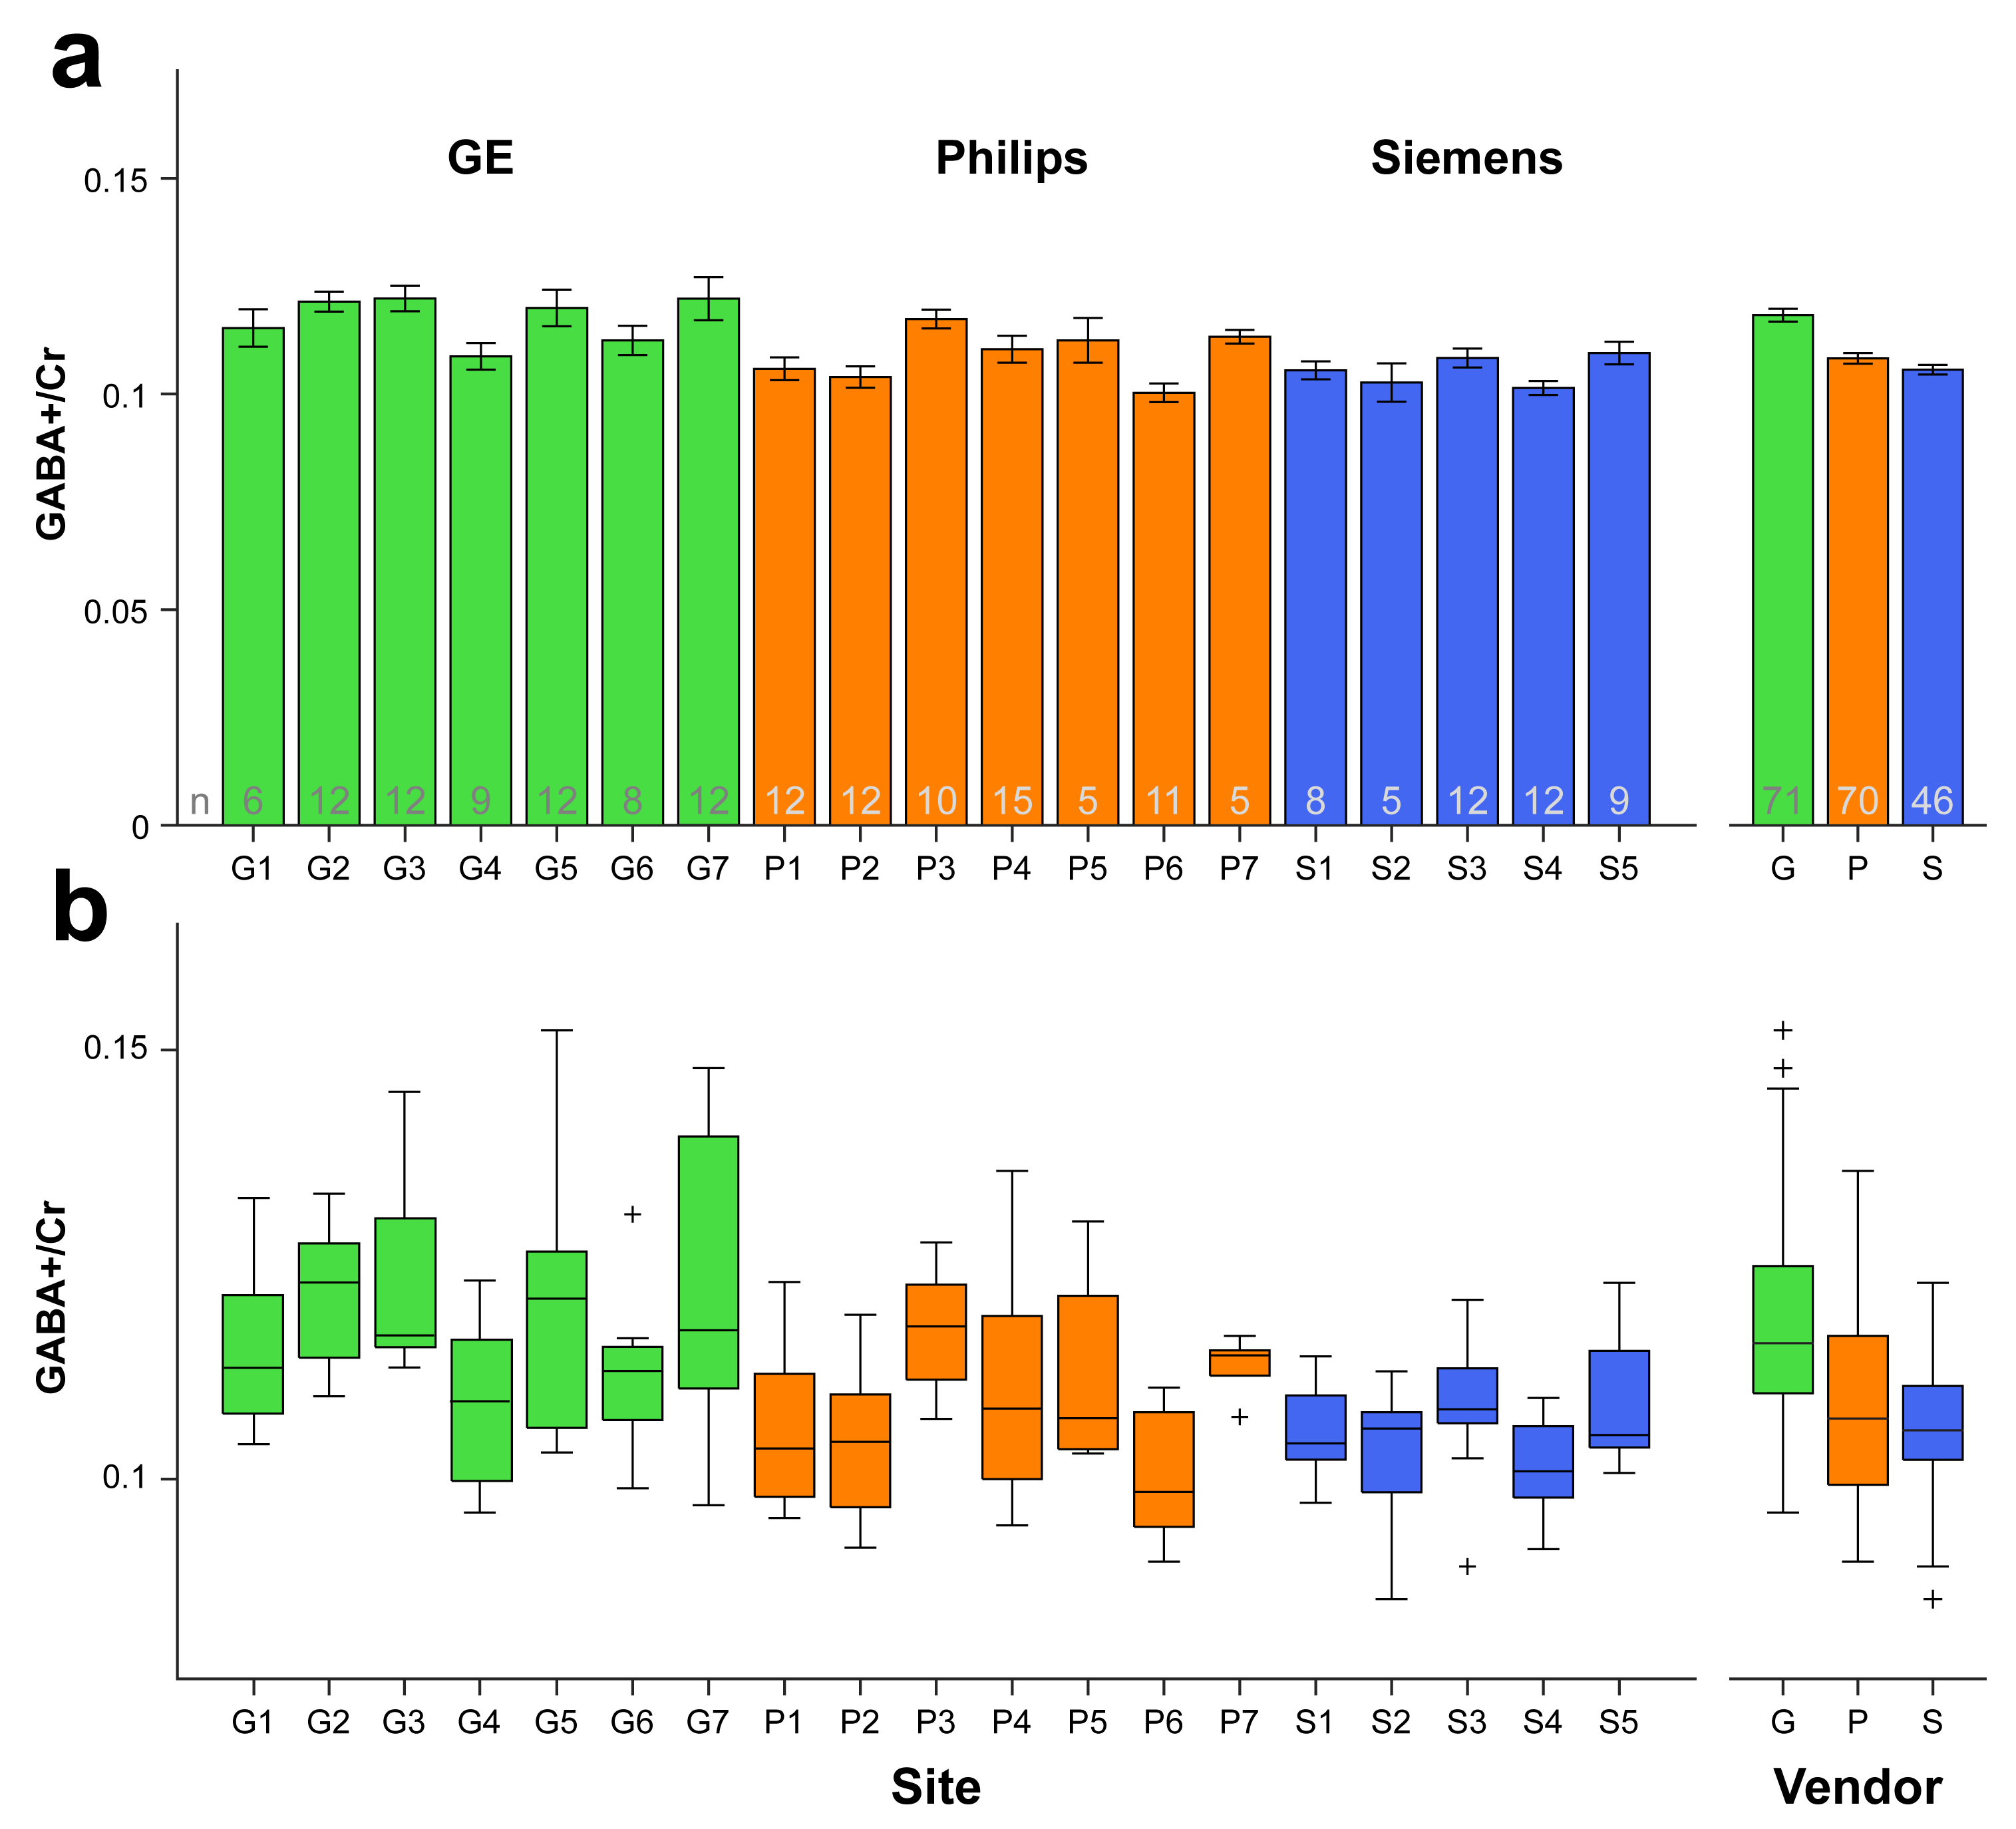
GABA-edited MRS data from 187 healthy adults (mean age: 26.5 ± 4.8 years; M/F: 94/93) were pooled from 19 research sites, with each site contributing 5–15 datasets. At the 19 sites, the scanners were GE (7), Philips (7) and Siemens (5). The data were acquired at 3T using vendor-specific implementations of MEGA-PRESS (Fig. 1) according to a standard scan protocol (with some site-specific idiosyncrasies). Acquisition parameters were: TE/TR = 68/2000 ms; 2/4/5 kHz spectral width; 2048/4096 data points; 320 total averages. Editing pulses were placed at 1.9 ppm (ON) and 7.46 ppm (OFF) and had an approximate inversion frequency bandwidth (FWHM) of 83 Hz. The GABA-edited signal was detected in a voxel placed in the medial parietal lobe (3 × 3 × 3 cm3) (Fig. 2).
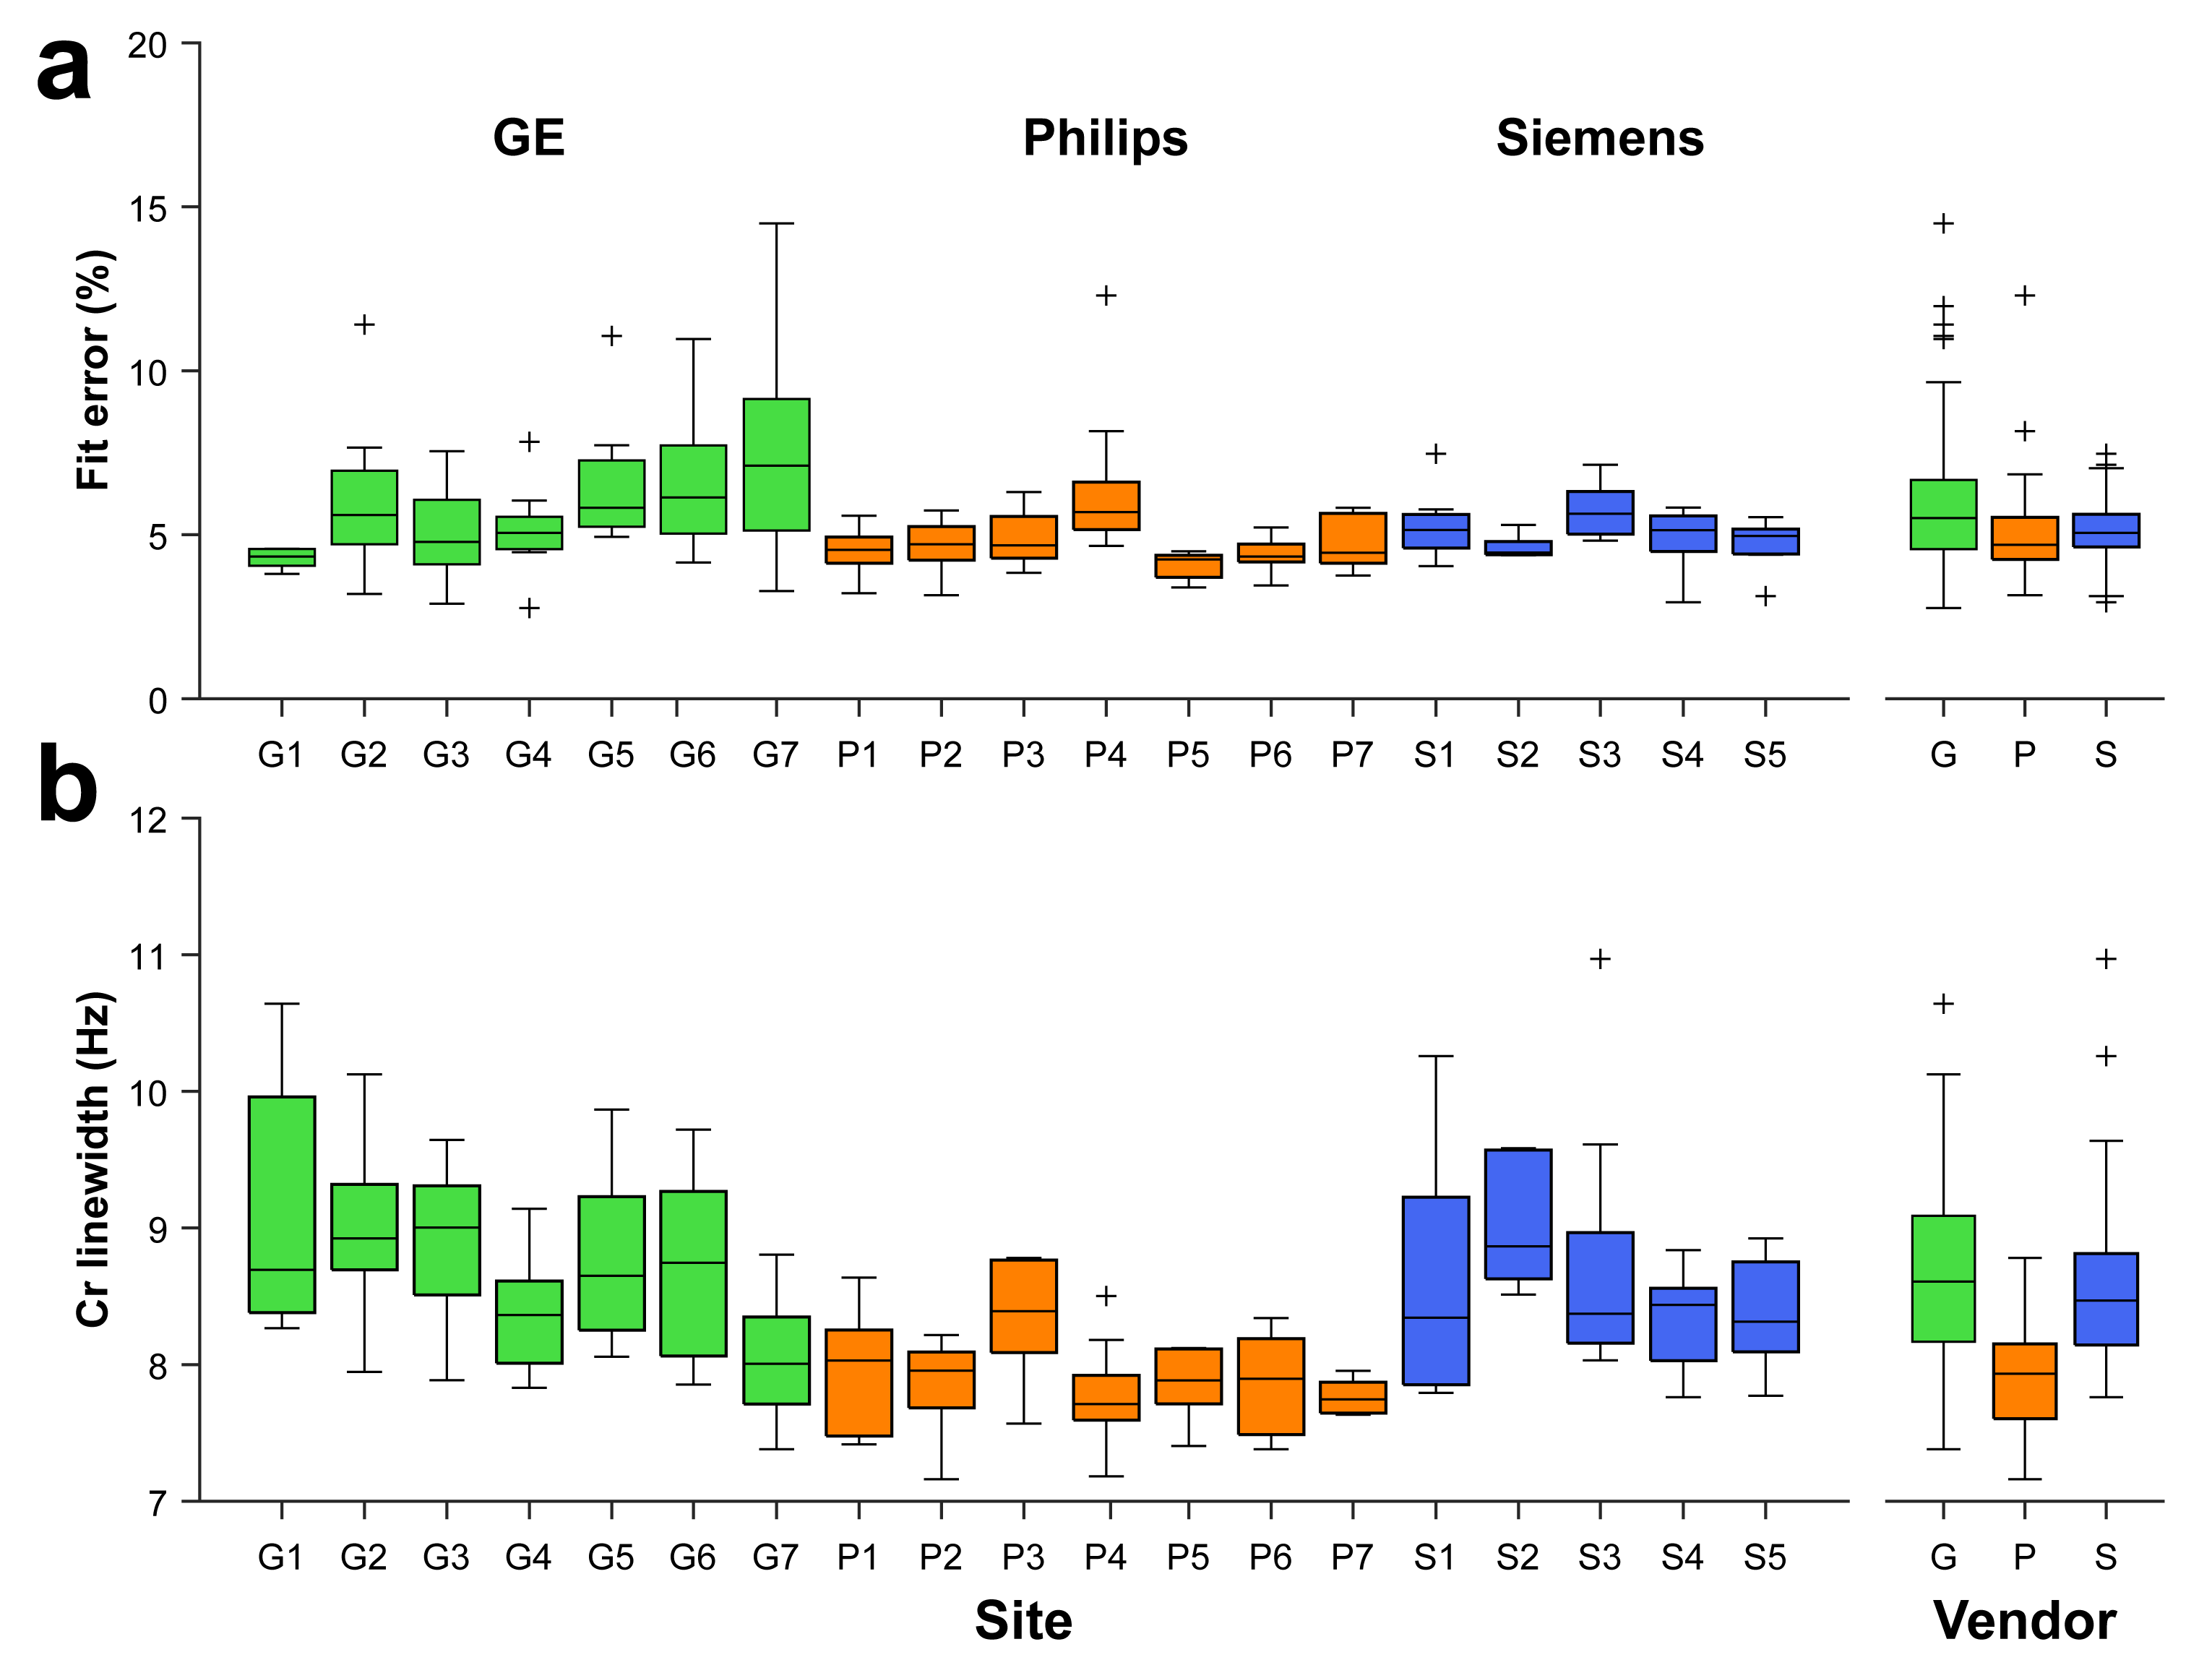
Each dataset was processed and GABA levels were quantified in Gannet [3]. Time-domain data were apodized using a 3-Hz exponential filter and zero-filled so as to yield a nominal spectral resolution of 0.061 Hz/point upon Fourier transformation. Frequency and phase errors were corrected using spectral registration [4]. The edited GABA signal in the difference spectrum was fit with a Gaussian model to determine the signal integral. The percentage fit error was calculated as the standard deviation of the fit residuals normalized to the amplitude of the modelled signal. The creatine (Cr) signal in the OFF spectrum was fit with a Lorentzian model for use as an internal reference. Spectral linewidth (FWHM) was estimated from the modelled Cr signal. Integral ratios are reported as GABA+/Cr to acknowledge the presence of co-edited macromolecules in the edited GABA signal.
Each participant was
scanned at one site, and each site had one scanner (a nested design). Therefore,
multilevel linear modelling [5] was used to examine
vendor-, site- and participant-related effects on measurement outcomes.
Results
Averaged difference spectra (±1 std.) for each vendor are shown in Fig. 3a, with all individual spectra overlaid in Fig. 3b. Bar graphs and boxplots of the mean and the distribution of GABA+/Cr values for each site and vendor are given in Fig. 4. The coefficients of variation (CV) for GABA+/Cr measurements acquired on GE, Philips and Siemens scanners were 10.7%, 9.6% and 7.2%, respectively. The CV across the entire cohort was 10.8%; the weighted average of the within-site CV was 8.4%. Variance partition coefficients from the multilevel model indicated that vendor-level differences accounted for 15.7% of the total variance in GABA+/Cr measurements, site-level differences accounted for 12.9% and participant-level differences accounted for 71.4%. Fig. 5 shows a degree of heterogeneity in relevant quality metrics (percentage fit error and Cr linewidth) across sites and vendors.Discussion
The mean values and CV of GABA measurements across all sites and vendors demonstrate a good degree of comparability. The results of the multilevel analysis additionally show that variation in the quantitative outcomes of GABA editing is explained in greatest proportion by participant-level differences. Vendor-level differences accounted for somewhat more of the total variance than site-related differences. This may suggest that minor vendor-specific differences in sequence timing or editing bandwidth impact quantitative outcomes more than site-specific nuances, such as voxel placement or receive-coil hardware. Future planned analyses include more complex multilevel models that include covariates that are known to influence difference-edited MRS measurements that are participant- or acquisition-related (e.g., age, frequency drift, measurement error or sequence parameters).Conclusion
Pooled GABA-edited measurements independently acquired at 19 sites using the three major MR scanner platforms display strong agreement despite varying hardware and sequence implementations. This protocol represents a useful standard parameter-set for future studies.Acknowledgements
This work was supported by NIH grants R01 EB016089 and P41 EB015909.References
1. Mullins PG, McGonigle DJ, O’Gorman RL, Puts NAJ, Vidyasagar R, Evans CJ, Cardiff Symposium on MRS of GABA, Edden RAE. Current practice in the use of MEGA-PRESS spectroscopy for the detection of GABA. Neuroimage 2014;86:43–52.
2. Mescher M, Merkle H, Kirsch J, Garwood M, Gruetter R. Simultaneous in vivo spectral editing and water suppression. NMR Biomed. 1998;11:266–272.
3. Edden RAE, Puts NAJ, Harris AD, Barker PB, Evans CJ. Gannet: A batch-processing tool for the quantitative analysis of gamma-aminobutyric acid-edited MR spectroscopy spectra. J. Magn. Reson. Imaging 2014;40:1445–1452.
4. Near J, Edden R, Evans CJ, Paquin R, Harris A, Jezzard P. Frequency and phase drift correction of magnetic resonance spectroscopy data by spectral registration in the time domain. Magn. Reson. Med. 2015;73:44–50.
5. Hayes AF. A primer on multilevel modeling. Hum. Commun. Res. 2006;32:385–410.
Figures
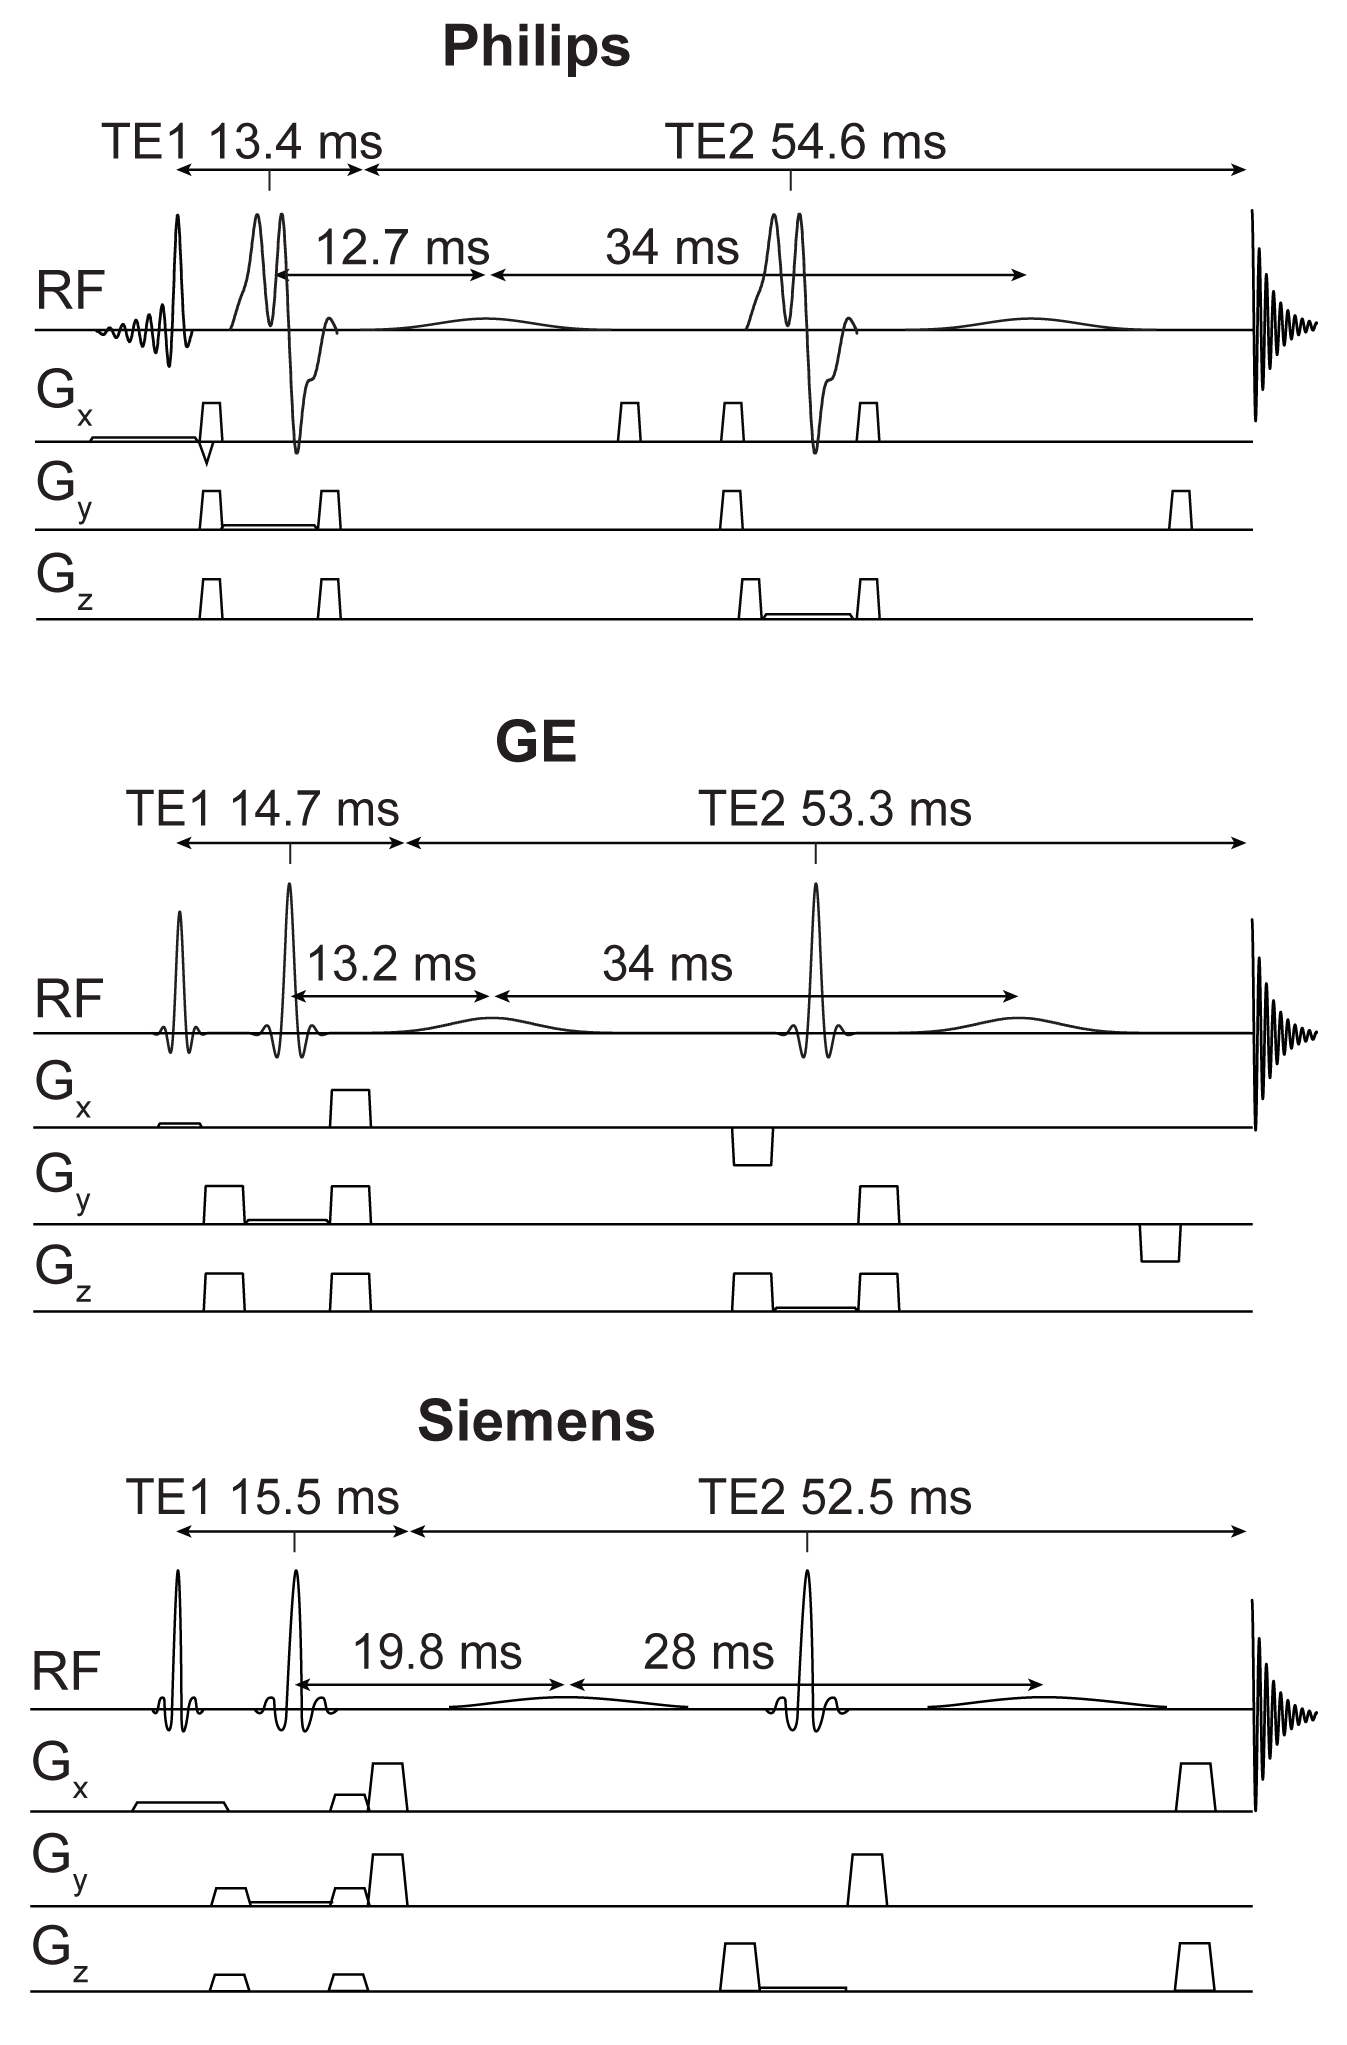
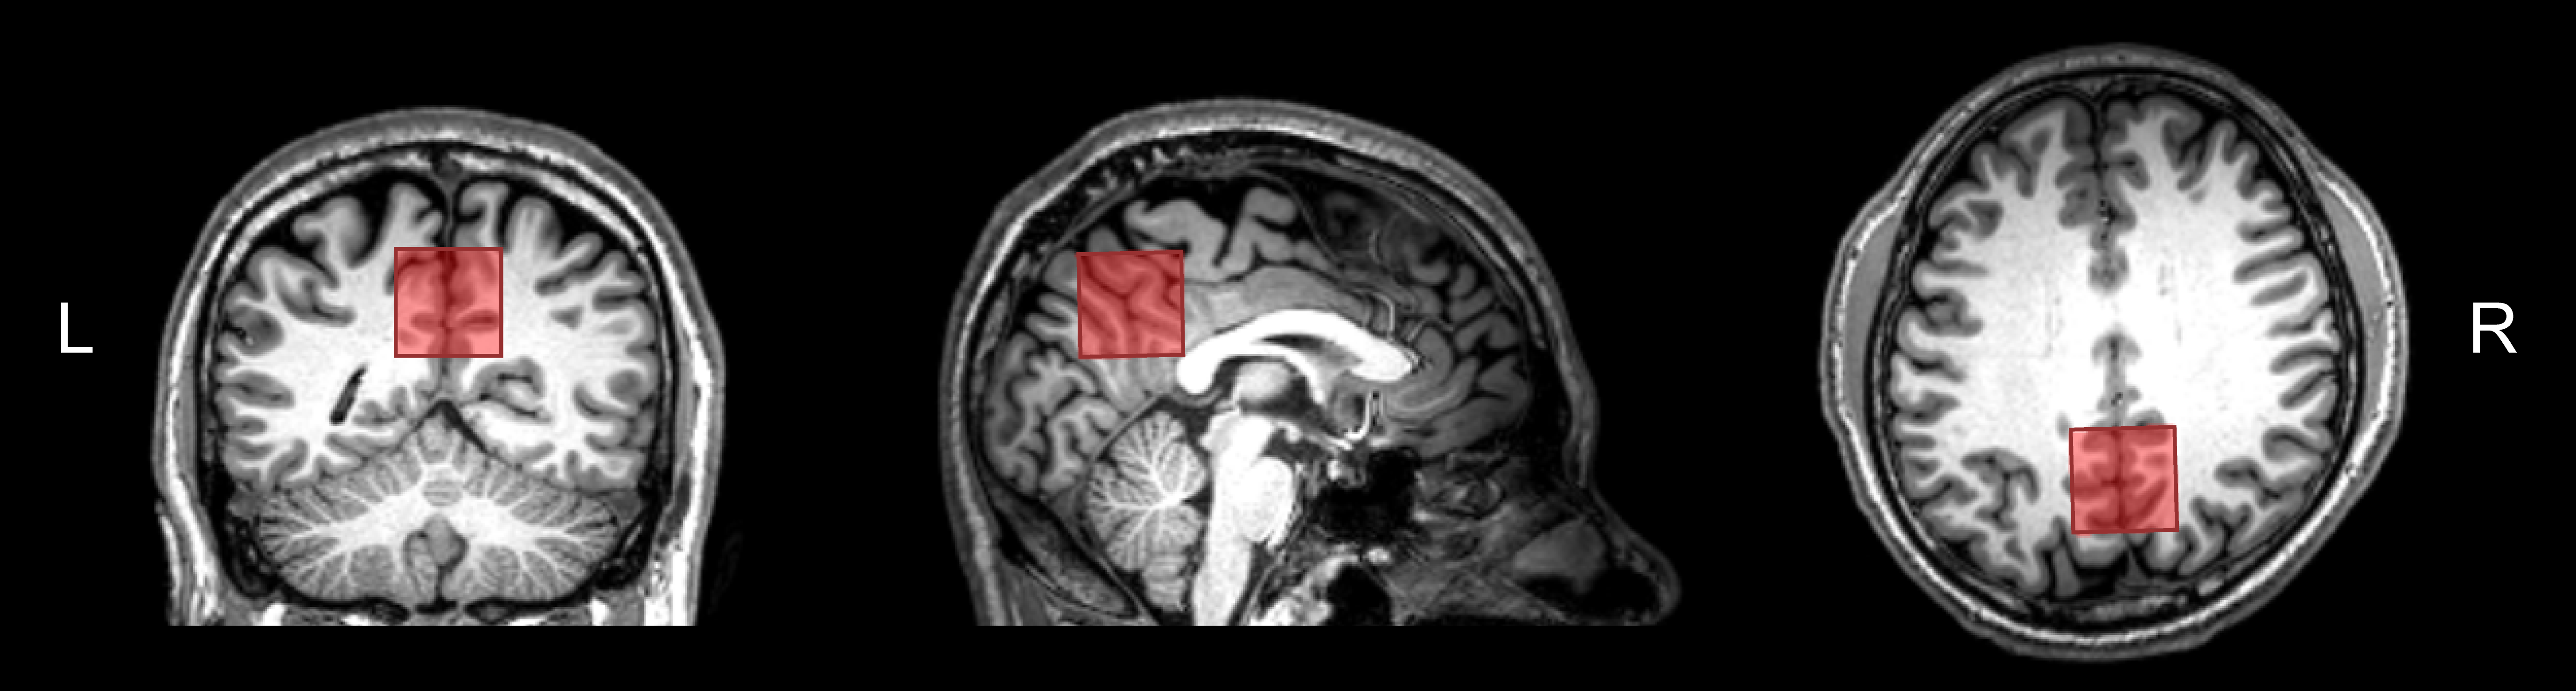
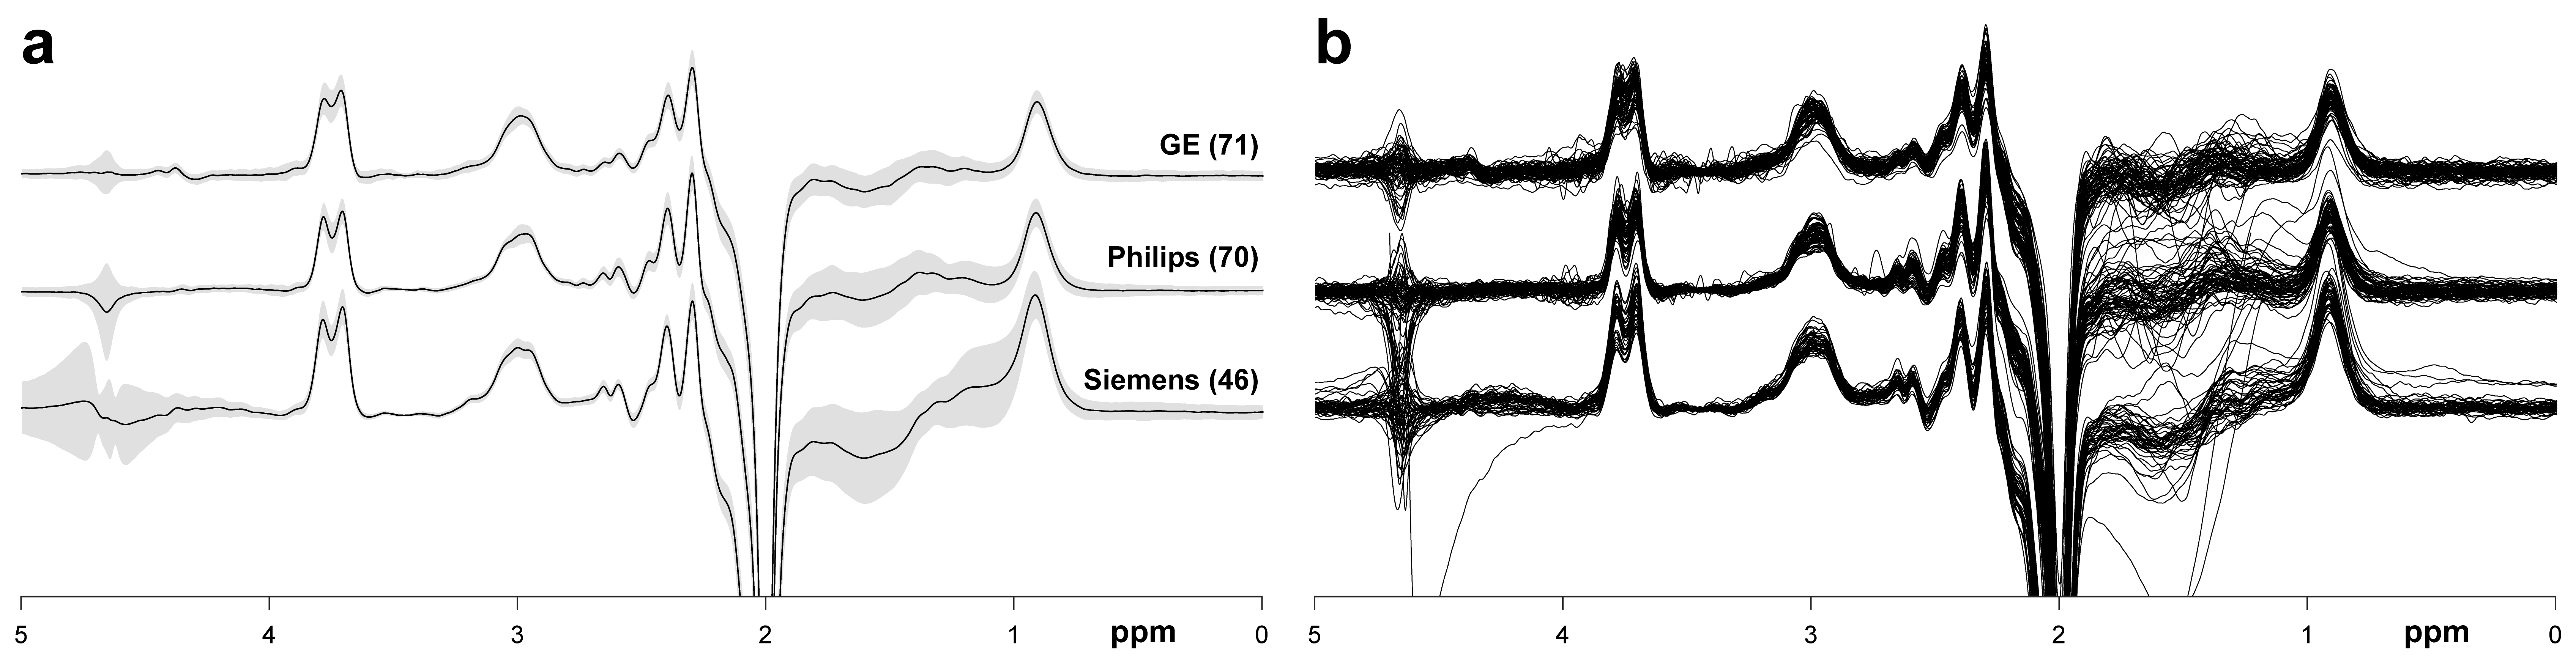
Figure 3. a: Averaged GABA-edited difference spectra for each vendor. The grey patches represent ±1 std. The associated sample sizes are shown in parentheses. b: Individual difference spectra for each vendor.