2987
Investigating metabolic alterations in a depressive-like rat model of chronic forced swimming stress using in vivo proton magnetic resonance spectroscopy at 7T1Department of Biomedical Engineering, and Research Institute of Biomedical Engineering, The Catholic University of Korea College of Medicine, Seoul, Korea, Republic of, 2Asan Institute for Life Sciences, Asan Medical Center, Seoul, Korea, Republic of, 3Ehwa Brain Institute, Ehwa Woman's University, Seoul, Korea, Republic of
Synopsis
The chronic forced swimming stress (CFSS) depression-like animal model has been widely used to investigate the pathophysiology of depression focusing on the monoamine system. The goal of this study was to investigate the CFSS-induced metabolic effects in the prefrontal cortex (PFC) of animals showing depression-like behavior using high-field and short echo time (TE) in vivo proton magnetic resonance spectroscopy (1H MRS). The results suggest that high-field and short TE in vivo 1H MRS can reliably quantify the key metabolites involved in depression and CFSS-induced behavioral despair and metabolic alterations similar to those found in human patients with depressive disorders.
Purpose
The chronic forced swimming stress (CFSS) depression-like animals have been used to investigate the pathophysiology of depression focusing on the monoamine system. An in vivo proton magnetic resonance spectroscopy (1H MRS) has been used to investigate metabolic alterations, other than the monoamine systems, including glutamate (Glu), choline-compounds, and myo-inositol (mIns), in patients with major depressive disorder (MDD). However, recent in vivo 1H MRS studies were conducted at clinical field strengths which had limitations in the quantification of metabolites with low concentrations, and/or spectral overlaps and strong J-coupling. High-field (7T) and relatively short-TE (16.3 ms) in vivo 1H MRS can improve the value of in vivo 1H MRS in investigating MDD. Thus, the goal of this study was to investigate the CFSS-induced effects in the prefrontal cortex (PFC) of depression-like animals using high-field and short-TE in vivo 1H MRS.Materials and Methods
Ten male Wistar rats underwent MRI and 1H MRS (pre-CFSS). Figure 1 shows experimental protocols including the MRI/MRS, forced swim test (FST), and CFSS. For the FST, the rats were placed in water tank (5 min; 30 °C). The rats underwent the CFSS to simulate depressive conditions (15 min; 25 °C). After the last CFSS (post-CFSS), MRI/MRS and FST were performed. MRI/MRS were acquired using a Bruker PharmaScan 7T MRI system (Bruker BioSpin) with a 72-mm birdcage volume coil and a surface coil. T2-weighted images (T2WIs) were acquired in rat brain (rapid-acquisition-with-relaxation-enhancement (RARE); TR/TE, 4000/11 ms; RARE factor, 8; field of view, 30 × 30 mm²; matrix size, 256 × 256; slice thicknesses, 1.5/1 mm (axial/coronal)). In vivo 1H MRS was acquired in the voxel (1.5 × 5 × 3 mm³) containing the PFC using point-resolved spectroscopy (TR/TE: 5000/16.3 ms, average: 256, spectral bandwidth: 5000 Hz). Water signals were suppressed by variable pulse power and optimized relaxation delays. Unsuppressed water signals were obtained in the same condition (average: 8). The FID signals were processed using linear combination of model spectra (LCModel, version 6.3) software to estimate the concentration of the following 19 metabolites: alanine, aspartate, creatine (Cr), phosphocreatine (PCr), γ-aminobutyric acid, glucose, Gln (glutamine), Glu, glycerophosphocholine (GPC), phosphocholine (PCh), glutathione, mIns, lactate, N-acetyl aspartate (NAA), N-acetyl-aspartyl-glutamate, scyllo-inositol, total creatine (tCr; Cr + PCr), total choline (tCho; PCh + GPC) and taurine, and scaled by the factor of receiver gain (Gainunsuppressed/Gainsuppressed). In order to assess the spectral overlap between Glu and Gln, a geometrical overlap ratio was computed from the intersection area of the LCModel fitted spectra of Glu and Gln as a percentage of the union area of Glu and Gln ((Glu ∩ Gln)/(Glu ∪ Gln) × 100%). The range of 2.25–2.55 ppm was selected for assessment, to include the main resonance for quantification of Glu (2.33–2.35 ppm) and Gln (2.43–2.45 ppm). Spectral overlaps between Glu and Gln were assessed using numerical simulation and in vitro measurements parametrically matched with in vivo experiments. Reliability of the quantification was assessed by Cramér-Rao lower bound (CRLB) values. The differences in metabolite levels and swimming behaviors were statistically analyzed using a paired sample t-test.Results
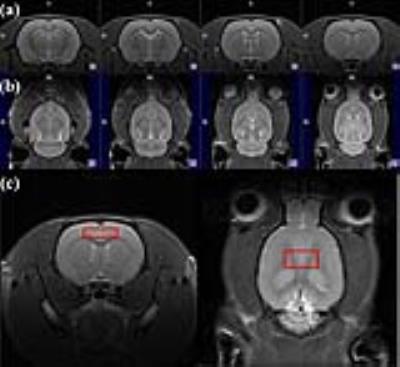
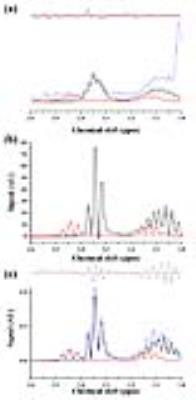
CFSS significantly changed swimming behaviors of the rats in FST. Figure 2 illustrates representative (a-b) axial/coronal T2WI of the rat brain with (c) the MRS voxel. Representative in vivo 1H MRS are shown in Figure 3(a): the raw data (blue), Glu (black), Gln (red), and residues (top). Figure 3(b-c) represents the results of simulation and in vitro measurements. Although the Glu and Gln spectra obtained with in vivo 1H MRS had slightly lower signal-to-noise ratios (SNRs) and larger line broadening, the spectral shapes showed good agreements. The levels of mIns, tCho, NAA, mIns/tCr, and tCho/tCr were significantly increased after the CFSS. Table 1 lists the geometrical overlap ratios, SNRs, and CRLB values.Discussion and Conclusion
In this study high-field and short-TE in vivo 1H MRS were used to assess CFSS-induced metabolic effects in the PFC in depression-like rats. With spectral simulations and in vitro experiments, we confirmed that in vivo 1H MRS could reliably assess Glu metabolism. Although significant alterations in Glu and Gln levels were not observed, increased prefrontal mIns, tCho, and NAA levels were partially consistent with the results found in patients with MDD, which suggested that the CFSS-induced behavioral despair and metabolic alterations were similar to those found in human patients with depressive disorders. We expect our findings to contribute to the investigation of the alterations in metabolic systems in MDD using in vivo 1H MRS, in addition to the monoaminergic system, and provide alternative insights into the pathophysiology and treatment strategies for patients with MDD.Acknowledgements
This study was supported by grants (2012-007883) from the Mid-career Researcher Program though the National Research Foundation (NRF) funded by the Ministry of Science, ICT & Future Planning (MSIP) of Korea.References
1) Mullins, P.G., Chen, H., Xu, J., Caprihan, A., Gasparovic, C., Comparative reliability of proton spectroscopy techniques designed to improve detection of J-coupled metabolites, Magn Reson Med. 60 (2008) 964-969.
2) Yildiz-Yesiloglu, A, Ankerst D.P, Review of 1H magnetic resonance spectroscopy findings in major depressive disorder: a meta-analysis, Psychiat Res. 147 (2006) 1-25.
Figures


