2986
Demyelination of the corpus callosum in a mouse model of mucopolysaccharidosis type IIvan Tkac1, Igor Nestrasil2, Steven Q Le3, Jakub Tolar4, and Patricia I Dickson3
1Center for Magnetic Resonance Research, University of Minnesota, Minneapolis, MN, United States, 2Departmant of Pediatrics, University of Minnesota, Minneapolis, MN, United States, 3Department of Pediatrics, Los Angeles Biomedical Research Institute at Harbor-UCLA Medical Center, Torrance, CA, United States, 4Pediatric Bone and Marrow Transplantation, University of Minnesota, Minneapolis, MN, United States
Synopsis
Mucopolysaccharidosis type I (MPS I) is an autosomal lysosomal storage disease caused by deficiency of α-L-iduronidase enzyme, which results in glycosaminoglycans accumulation within the lysosomes. MPS I leads to progressive loss of cognitive function and substantial physical disease in children. Abnormal myelin composition and reduced expression of myelin-related genes has been recently reported in a canine model of MPS I. The purpose of this study was to demonstrate whether demyelination of the corpus callosum can be detected also in a mouse model of MPS I using in vivo 1H MRS at 9.4 T.
PURPOSE
Mucopolysaccharidosis type I (MPS I), also called Hurler syndrome, is an autosomal recessive lysosomal storage disease caused by deficiency of α-L-iduronidase enzyme 1. Consequently, glycosaminoglycans accumulate within the lysosomes causing cellular dysfunction. MPS I leads to progressive loss of cognitive function and substantial physical disease in children. Cognitive decline in children with MPS I correlate with focal white matter lesions (hyperintense on T2W MRI) often observed in the corpus callosum 2. Recent study of a canine model of MPS I revealed abnormal DTI parameters in the corpus callosum, which was supported by reduced expression of myelin-related genes and abnormal composition of myelin 3. The purpose of this study was to demonstrate whether demyelination of the corpus callosum can be detected in vivo in a mouse model of MPS I.METHODS
C57BL/6 knock-out mice deficient for IDUA were used as a well-established model of MPS I. MRI/MRS data from MPS I mice (male, N = 11) and from heterozygote littermates (male, N = 12) were collected at 12 months of age using 9.4 T Agilent/Varian MR scanner. Multi-slice FSE images in axial and sagittal orientation (slice thickness = 0.5 mm) were used for a precise positioning of the VOI (2.0 x 1.0 x 1.8 mm3) centered in the corpus callosum (Fig. 1). The B0 field homogeneity was adjusted by FASTMAP shimming 4. In vivo 1H MRS data were acquired using ultra-short TE STEAM (TE = 2 ms) localization sequence combined with VAPOR water suppression 5. Metabolites were quantified using LCModel with the spectrum of fast relaxing macromolecules included in the basis set. Spontaneously breathing animals were anesthetized with 1.0 – 1.5% isoflurane. Another group of MPS I and control mice (N = 5 for each group) was fed with cuprizone-rich diet for 6 weeks to induced demyelination. After switching back to normal chow for 6 weeks, animals were sacrificed at 16 weeks and the corpus callosum was dissected and analyzed by RT-PCR and ELISA.RESULTS
The size of the mouse corpus callosum (thickness ranging from 0.15 – 0.35 mm) is too small for in vivo 1H MRS, therefore, the VOI was centered on the midline encompassing its posterior part (Fig. 1). The spectral quality consistently accomplished in this study (Fig. 1) enabled reliable quantification of seventeen brain metabolites (Fig. 2). The comparison of neurochemical profiles revealed significantly decreased N-acetylaspartate (NAA, -0.5 µmol/g, p = 0.004) and phosphoethanolamine (PE, -0.6 µmol/g, p = 0.018) concentration in MPS I mice relative to controls (heterozygote littermates). In addition, a trend for increased level of ascorbate (Asc, +0.5 µmol/g, p = 0.086) has been observed. Preliminary tissue analysis data of dissected corpus callosum at 16 weeks indicate a consistent reduction in myelin related gene expression in MPS I mice compared to controls. However, intergroup differences in myelin basic protein and total cholesterol have not been observed.DISCUSSION
Since phosphoethanolamine is the direct precursor for the synthesis of the phospholipid phosphatidylethanolamine, PE levels represent an in vivo marked of myelination 6. Therefore, a significantly decreased level of PE in the VOI encompasses the corpus callosum clearly indicates demyelination. These results are in agreement with preliminary issue analysis results showing reduced expression of myelin-related genes. Moreover, reduced PE levels are in excellent agreement with abnormal DTI parameters, reduced expression of myelin-related genes and abnormal myelin composition observed in a canine model of MPS I 3. A significant decrease in NAA well correspond with a loss in neuronal and axonal integrity characteristic for MPS I. In addition, a trend for increased level of Asc is in agreement with our previous finding in the hippocampus of MPS I mice 7, which indicate a protective response against the oxidative stress reported in lysosomal diseases 8. These consistent 1H MRS results have been found despite challenges related to the partial volume effects.CONCLUSIONS
In vivo 1H MRS confirmed demyelination and a loss in neuronal/axonal integrity in the corpus callosum of MPS I mice. These results highlight underlying neurodegenerative processes that may substantially contribute to progressive loss of brain cognitive function in this disease.Acknowledgements
Supported by: NIH grants P41 EB015894, P30 NS076408, R01 NS085381 and WM KECK FoundationReferences
1. Campos D, Monaga M. Mucopolysaccharidosis type I: current knowledge on its pathophysiological mechanisms. Metab Brain Dis 2012; 27(2):121-129. 2. Palmucci S, Attina G, Lanza ML, Belfiore G, Cappello G, Foti PV, Milone P, Di Bella D, Barone R, Fiumara A, Sorge G, Ettorre GC. Imaging findings of mucopolysaccharidoses: a pictorial review. Insights Imaging 2013; 4(4): 443-459. 3. Provenzale JM, Nestrasil I, Chen S, Kan SH, Le SQ, Jens JK, Snella EM, Vondrak KN, Yee JK, Vite CH, Elashoff D, Duan L, Wang RY, Ellinwood NM, Guzman MA, Shapiro EG, Dickson PI. Diffusion tensor imaging and myelin composition analysis reveal abnormal myelination in corpus callosum of canine mucopolysaccharidosis I. Exp Neurol 2015; 273: 1-10. 4. Gruetter R, Tkac I. Field mapping without reference scan using asymmetric echo-planar techniques. Magn Reson Med 2000; 43: 319-323. 5. Tkac I, Starcuk Z, Choi IY, Gruetter R. In vivo 1H NMR spectroscopy of rat brain at 1 ms echo time. Magn Reson Med 1999; 41: 649-656. 6. Tkac I, Rao R, Georgieff MK, Gruetter R. Developmental and regional changes in the neurochemical profile of the rat brain determined by in vivo 1H NMR spectroscopy. Magn Reson Med 2003; 50: 24-32. 7. Tkac I, Nestrasil I, McIvor RS, Kitto K, Fairbanks CA, Kozarsky K, Low WC, Whitley CB, Belur L. AAV serotype 9 vector transducing the human a-L-iduronidase gene normalizes hippocampal and cerebellar neurochemical profiles in a mouse model of mucopolysaccharidosis type I. Proceedings of the Annual ISMRM Meeting 2016, poster #2406. 8. Pereira VG, Martins AM, Micheletti C, D'Almeida V. Mutational and oxidative stress analysis in patients with mucopolysaccharidosis type I undergoing enzyme replacement therapy. Clin Chim Acta 2008; 387: 75-79.Figures
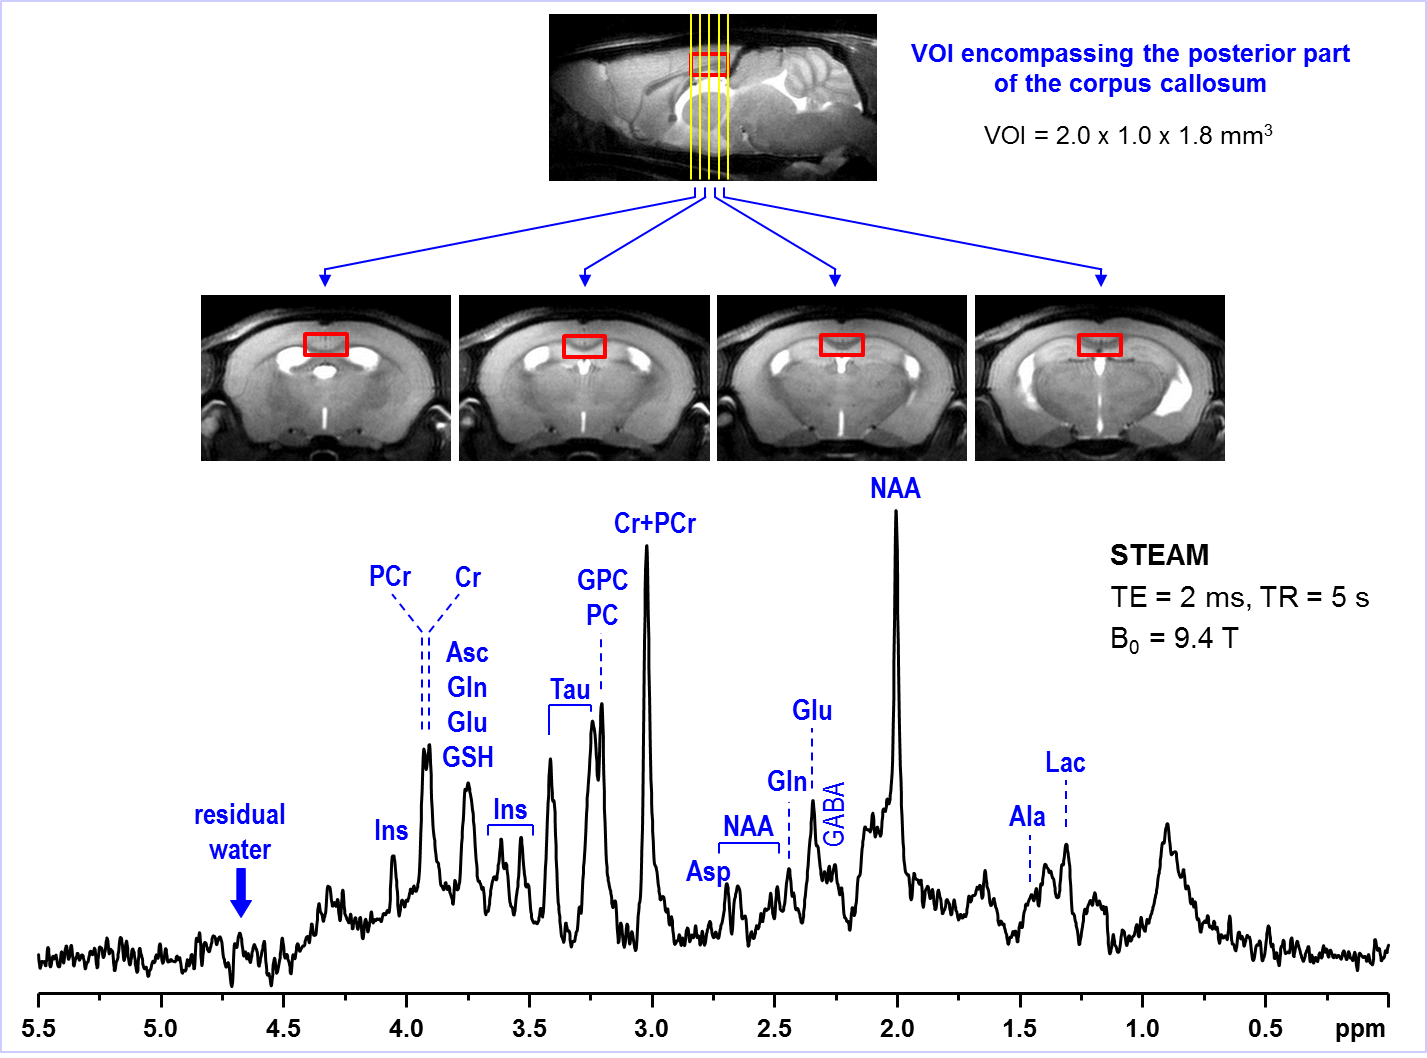
Representative in vivo 1H MR spectrum
acquired from the VOI encompassing the posterior part of the corpus callosum. The
typical VOI size and position in the mouse brain is illustrated on sagittal and
four axial MR images. Data were acquired using 9.4T Agilent/Varian MR scanner from
MPS I mouse at 12 months of age. Imaging: FSE, 100 µm x 100 µm in-plane
resolution, 0.5 mm slice thickness. Spectroscopy: FASTMAP shimming, STEAM (TE =
2 ms, TR = 5 s, number of transients = 320). Post-processing water signal
removal or baseline correction has not been applied.

Comparison of the neurochemical profiles quantified from the corpus
callosum of MPS I mice (N = 11) and heterozygote littermates (N = 12). MRS data
were acquired at 12 months of age. Bar diagram error bars indicate SDs.
Statistical significance: * p < 0.05, ** p < 0.005, # p < 0.1.