2984
Metabolic Subtypes of Atypical Teratoid Rhabdoid Tumors1Radiology, Children's Hospital Los Angeles, Los Angeles, CA, United States
Synopsis
Atypical Teratoid Rhabdoid Tumors (AT/RT) are highly malignant pediatric brain tumors distinguished from other primitive/embryonal tumors by alterations of the SMARCB1 gene. Recently, two molecular subtypes have been described for AT/RTs. We have reviewed MR spectra of AT/RT patients and identified two distinct clusters in respect to their metabolic profiles. Should a correlation with genetic subtypes be confirmed, in vivo MRS could potentially play a key role in the initial stratification of patients diagnosed with AT/RT.
Introduction
Atypical Teratoid Rhabdoid Tumors (AT/RT) are highly malignant pediatric brain tumors distinguished from other primitive/embryonal tumors by alterations of the SMARCB1 gene. Recently, two molecular subtypes have been described for AT/RTs1. Similar to our prior work which demonstrated metabolic correlates to the molecular subgroups of medulloblastomas, we hypothesize that AT/RTs with distinct metabolic features can be identified using MR Spectroscopy.2Methods
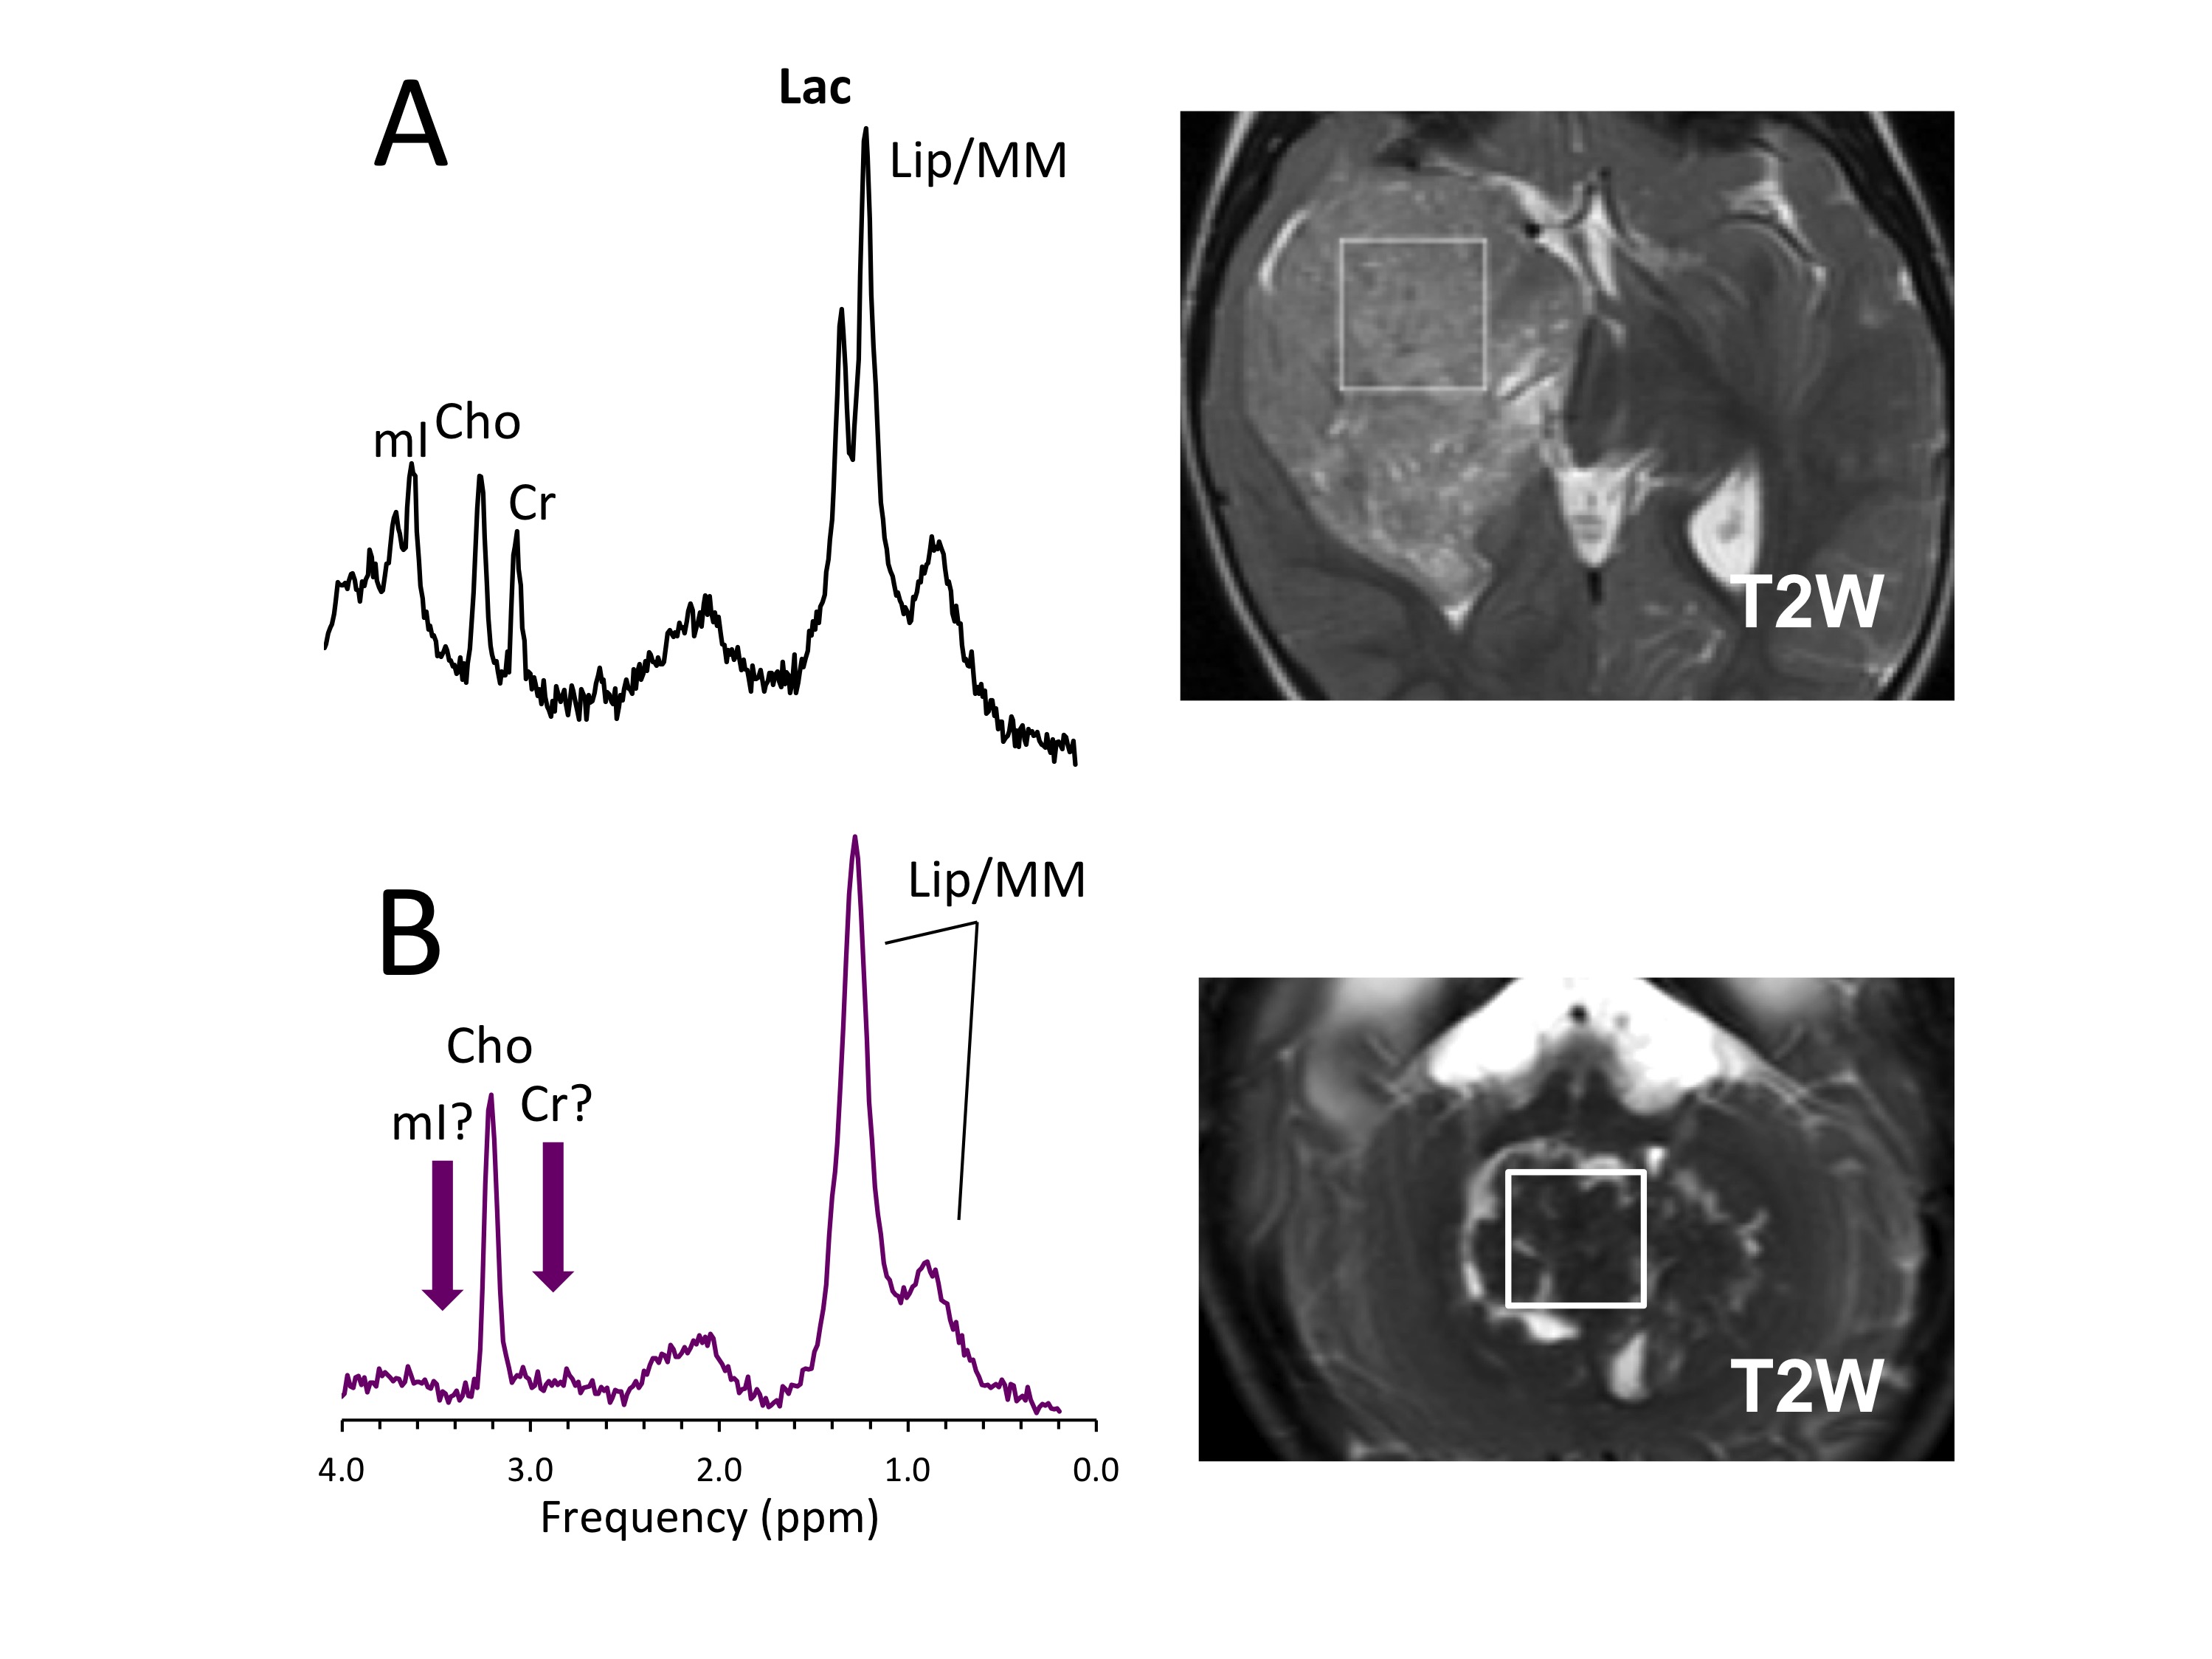
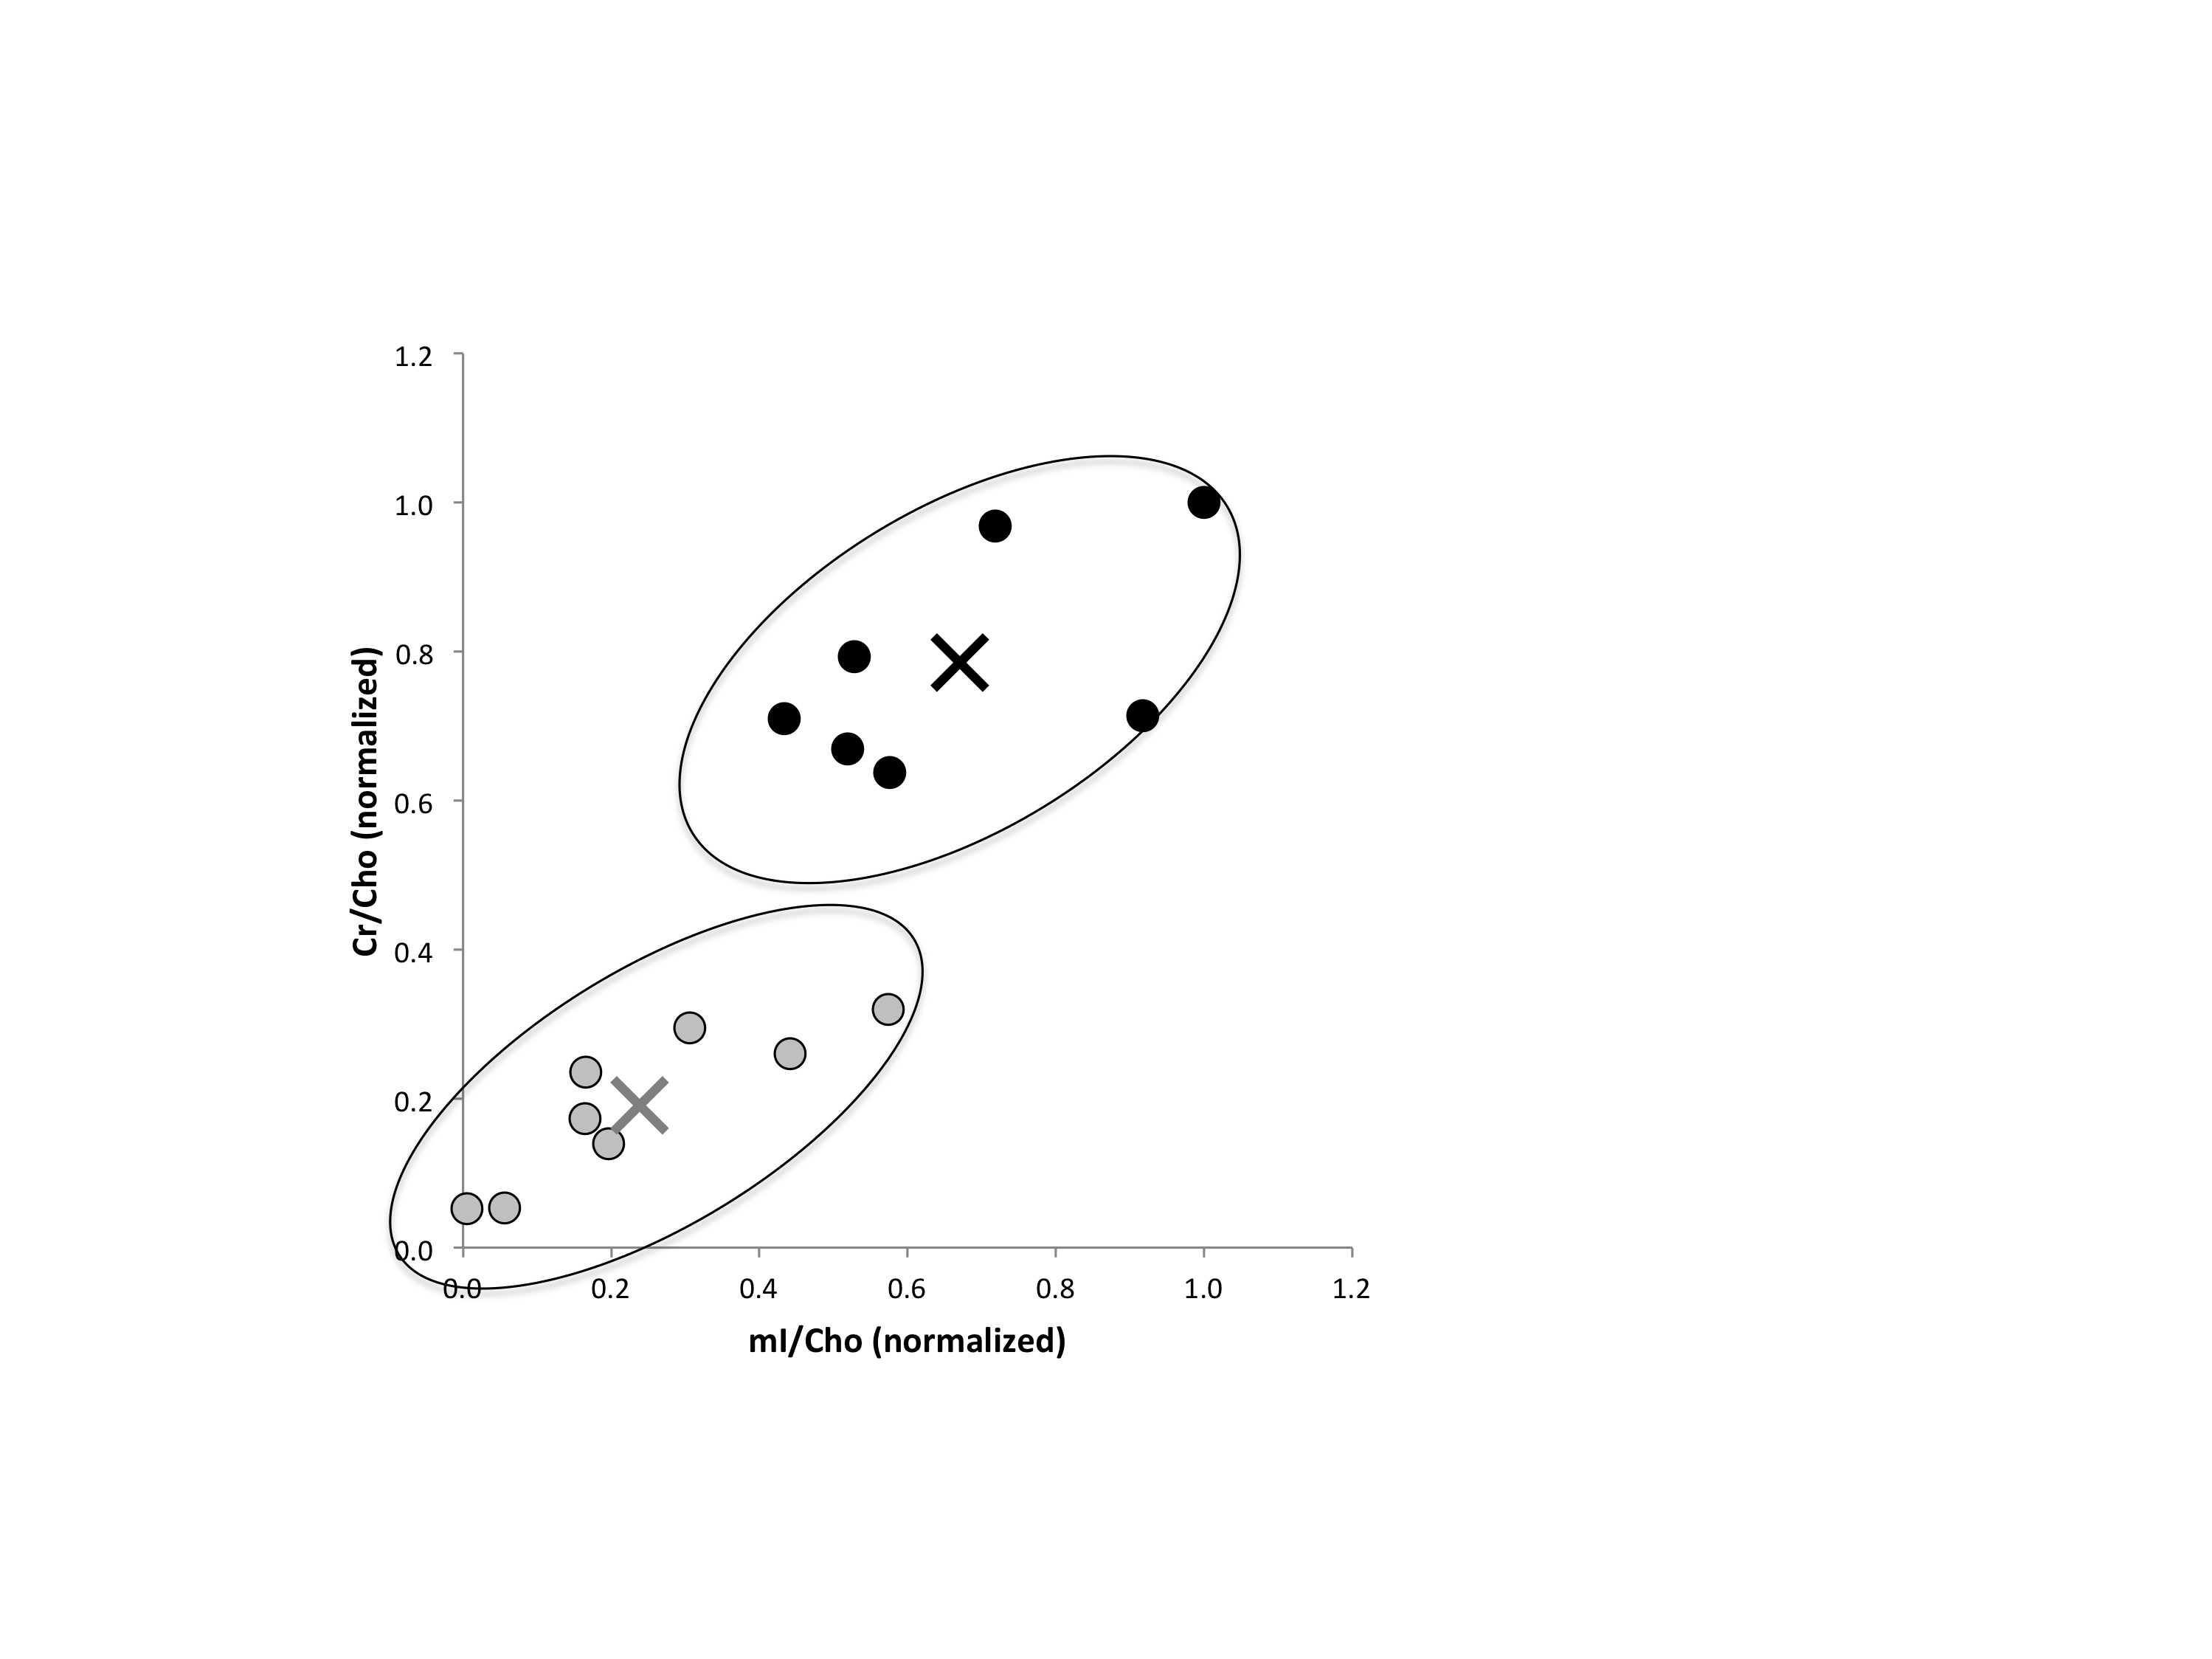
MR spectra of 15 patients (6f/9m, age: 1.1±0.5 yrs) with confirmed AT/RT were analyzed. All spectra were acquired on GE 1.5T or Philips 3T clinical scanners with single voxel PRESS sequence (TE = 35 ms, TR = 1.5s (1.5T) or TR = 2s (3T), 128 averages) and processed with fully automated LCModel (version 6.3-1c) software. Choline (Cho) was the only metabolite detected in all spectra and was used as reference peak. Concentration ratios relative to Cho of creatine (Cr), myo-inositol (mI), lactate (Lac), and methylene lipids (Lip13) were analyzed. Measurements in separate groups of controls and patients who underwent comparable MRS studies on both 1.5T and 3T scanners were used to correct for possible systematic differences in ratios due to different NMR properties at 1.5T vs. 3T. A K-means cluster analysis with equal weights (XLSTAT, Addinsoft) was performed.Results
MR spectra of AT/RT demonstrated significant heterogeneity (Fig. 1). Cluster analysis identified two clusters with essentially no overlap (Fig. 2). Post-hoc analysis (t-test) showed that Cr/Cho (p<0.000001) and mI/Cho (p<0.005) and mI/Cho separated the clusters best.Discussion
In vivo metabolic profiles of AT/RT form two subgroups with the most significant difference between the groups being low or absent Cr (relative to Cho). Low/absent Cr is observed in tissues that lack Cr kinase. Also, Cr is synthesized outside the brain and its uptake might be impaired in one of the subgroups of AT/RT. Presently, it is unclear how metabolism relates with the molecular subtypes of AT/RT (work in progress). However, a preliminary review of clinical outcome demonstrated similar parallels between the metabolic and molecular subgroups in terms of separation by age, location, and overall survival of the MRS metabolic subgroups and the molecular subgroups as reported by Torchia et al.1. Cr/Cho can readily be measured by in vivo MRS and therefore with identifying parallels between metabolic and molecular subgroups of ATRTs, in vivo MRS can potentially play a key role in the initial stratification of patients diagnosed with AT/RT.Acknowledgements
Rudi Schulte Research Institute, Ian’s Friends FoundationReferences
1. Torchia J, Picard D, Lafay-Cousin L, et al. Molecular subgroups of atypical teratoid rhabdoid tumours in children: an integrated genomic and clinicopathological analysis. Lancet Oncol. May 2015;16(5):569-582.
2. Blüml S, Margol AS, Sposto R, et al. Molecular subgroups of medulloblastoma identification using noninvasive magnetic resonance spectroscopy. Neuro Oncol. Aug 2015.
Figures