2980
Brain Metabolite Changes During Motor Task: A 3T functional MRS Study1Biomedical Engineering, McGill University, Montreal, QC, Canada, 2Brain Imaging Center, Douglas Mental Health Institute, Montreal, QC, Canada
Synopsis
Previous fMRS studies at 7T have shown changes in brain metabolite levels elicited by different stimuli. This 3T study employed a modified version of PRESS to effectively measure neurochemical changes generated by a finger tapping task during the MRS scan. The results show lactate in the motor cortex increased approximately 11%, while glutamate and aspartate trend toward a 2% increase and 3% decrease respectively. More subjects are required for further validation.
Purpose
The aim of this study is to demonstrate functional magnetic resonance spectroscopy (fMRS) at 3 Tesla to detect neurochemical changes in the motor cortex during a finger tapping motor task. Data were acquired using a point resolved spectroscopy (PRESS) sequence that was modified to enable the use of shorter echo-times.Method
Eight healthy subjects (3 female, age = 25± 2 years (mean± SD)) participated in the study. Each participant underwent an anatomical MRI, an fMRI and fMRS scan.
Motor Task: The task consisted of tapping each finger to the thumb twice in a sequential order starting from the digitus secundus (index finger) to the digitus minimus (little finger) and back repeatedly.
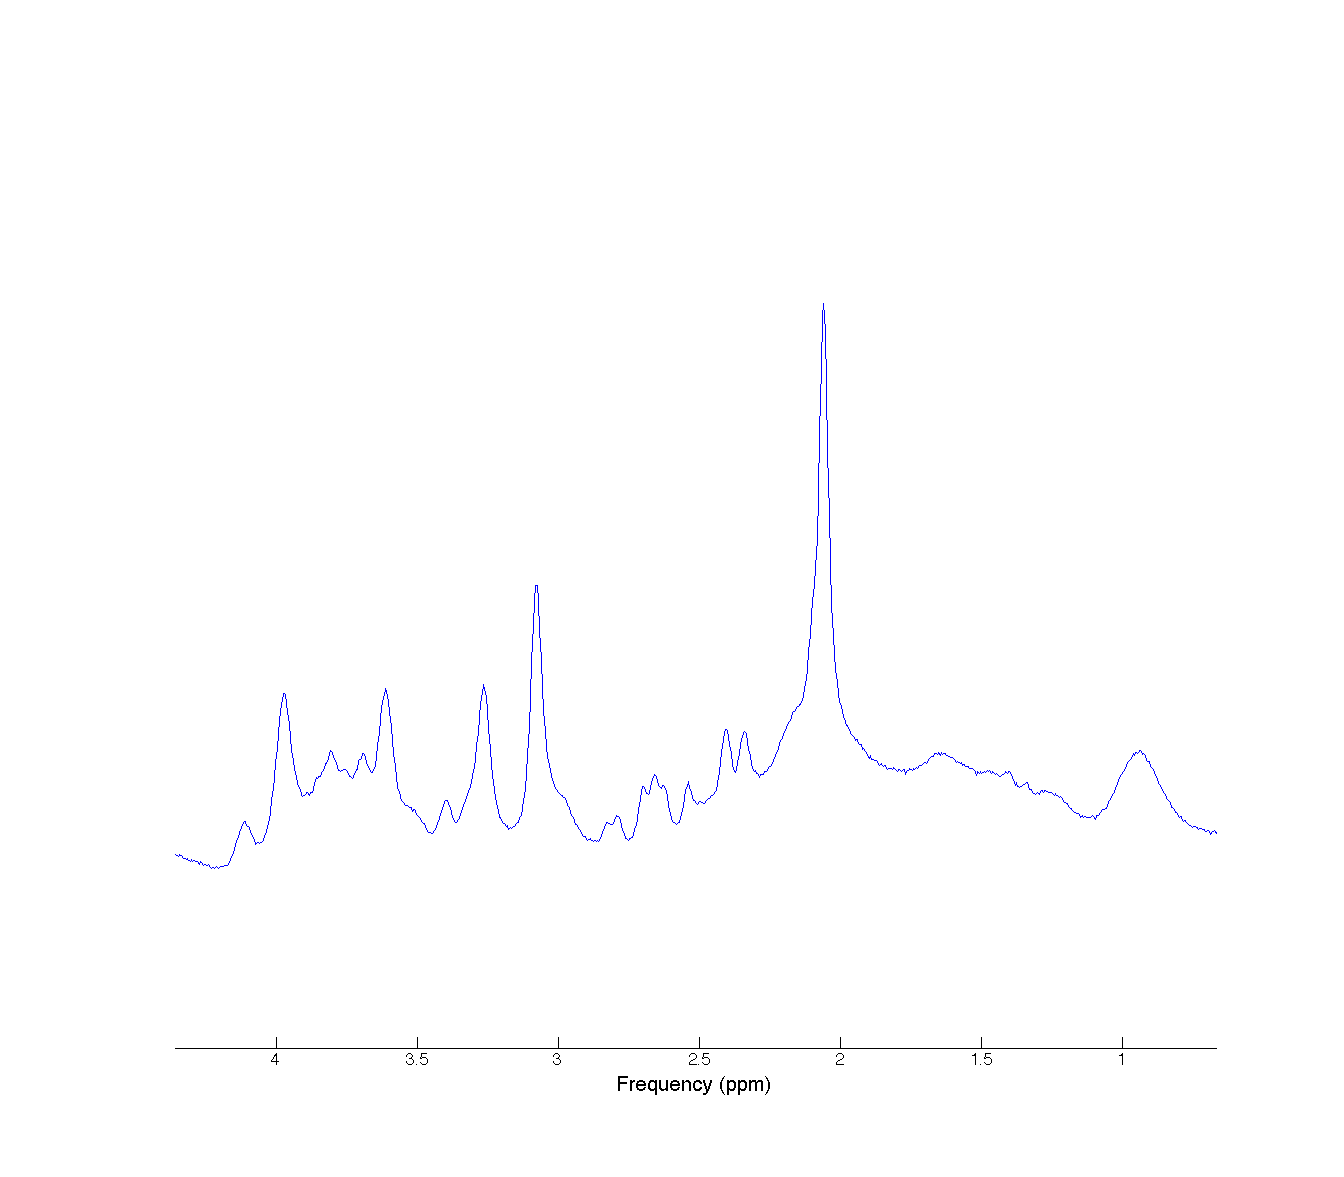
Acquisition: The PRESS sequence1 was modified to reduce TE below its minimum of 30ms to 17ms thereby minimizing T2 relaxation and J-evolution effects. This was achieved by replacing the existing symmetric excitation pulse with an asymmetrical minimum-phase pulse and decreasing the first and second refocusing pulse spoiler gradient durations by 44% and 60% respectively. The duration of the refocusing pulses remained unchanged. Representative spectrum seen in Figure 5.
fMRI/fMRS: All data were acquired on a Seimens (Erlangen, Germany) Magnetom TIM Trio 3 Tesla MRI scanner with a 32-channel head receiver array and body coil transmitter. First, a three plane localizer image was acquired, followed by an anatomical T1 weighted MPRAGE image with 1-mm isotropic resolution. A whole-brain single-shot, gradient-echo EPI scan (TR/TE = 2000ms/28ms, 3-mm isotropic resolution) was acquired while the subject performed the motor task following a visual cue with block design consisting of 20s-OFF, 10s-ON for four blocks. The activation map of this fMRI session was reconstructed online and overlaid with the anatomical image to help guide placement of the 2 x 2 x 3 cm3 MRS voxel. Placement of the voxel was chosen to be in the area encompassing the most BOLD activation around the primary motor cortex. Localized first and second order shimming of the voxel was performed with the FASTESTMAP2 sequence. MRS data were acquired using the modified PRESS sequence (TE=17ms, TR = 3000ms, 2048 spectral points, 1200Hz spectral width and 608 averages) while the subject performed the finger tapping motor task in 3 blocks of 5 minutes ON and 5 minutes OFF.
Analysis: MRS spectra were processed using 'run_pressproc_fmrs.m' function within the FID-A software package3 in MATLAB (The Mathworks, Natick, MA, USA). First, outlier averages were discarded then frequency and phase drift correction was performed on each average. Processed spectra were separated into stimulus ON and OFF blocks of 5 minutes with the first 48s of each block removed to account for transient effects. LCModel (Provencher Inc, Oakville, Canada) was used to calculate the metabolite concentrations from the processed ON/OFF spectra. Average ON/OFF metabolite concentration ratios were referenced to total creatine (Cr+PCr) and summed to obtain ON/OFF group averages.
Results
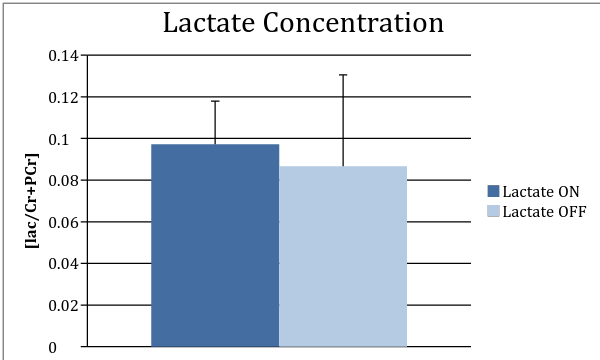
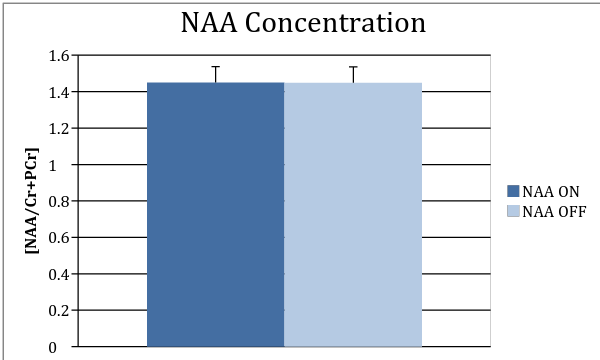
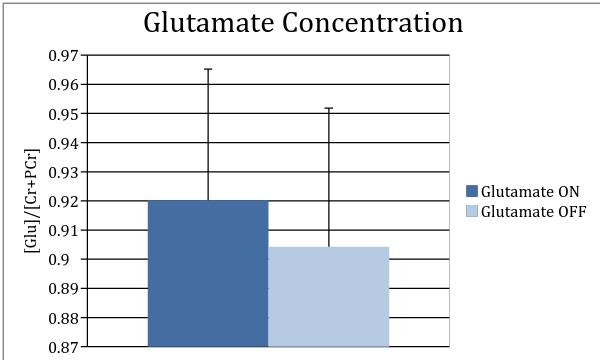
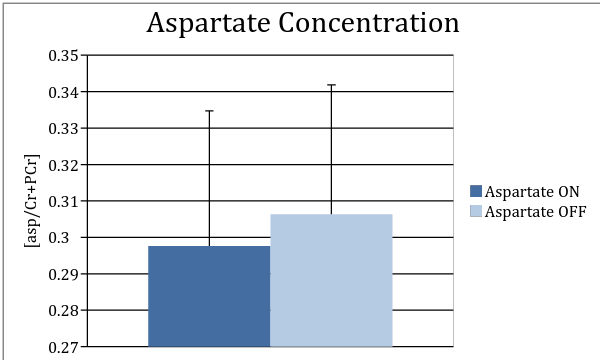
All concentrations are given as ratios to total creatine. Figure 1 shows lactate concentration ratio averages during the OFF and ON blocks. The lactate mean value increaseed by 11% (p < 0.05), from 0.087±0.041 during the OFF blocks to 0.098±0.039 during the ON blocks. Other typically stable metabolites like NAA in Figure 2 show no change (p=0.94) as expected. Glutamate and aspartate showed changes that trended toward significance. Figure 3 shows average glutamate levels during the OFF and ON blocks. The glutamate mean value changed by 2% from 0.904±0.047 to 0.920±0.045 (p = 0.11). Figure 4 shows average aspartate level during the OFF and ON blocks. The aspartate mean value decreased by 3% from 0.306±0.035 to 0.297±0.037 (p = 0.09).Discussion
Previous studies have shown a BOLD response to a motor stimulus using fMRI3 and others have seen an associated change in metabolite concentrations in areas of activation using visual4,5 and motor6 stimuli at 7T. Mostert et al. attempted examining metabolite concentrations with a 1.5T MRI scanner in a small cohort and found no significant changes7 . At 3T our results show a significant change in lactate and a trend towards significance in both glutamate and aspartate. The percent change we observe in this study is in close agreement with those found in visual stimulus studies. This suggests BOLD activation is accompanied by metabolite changes measurable at 3T.Conclusion
During a hand motor task, such as finger tapping fMRI BOLD activation in the motor cortex is accompanied by changes in concentrations of lactate and potentially glutamate and aspartate visible at 3T. To improve the statistical power of our results more subjects are needed since the percent change in concentrations are hypothesized to be less than 10%.Acknowledgements
No acknowledgement found.References
1. Bottomley, Paul A. "Spatial localization in NMR spectroscopy in vivo." Annals of the New York Academy of Sciences 508.1 (1987): 333-348.
2. Gruetter, Rolf. "Automatic, localized in Vivo adjustment of all first-and second-order shim coils." Magnetic Resonance in Medicine 29.6 (1993): 804-811.
3. Simpson, Robin, et al. "Advanced processing and simulation of MRS data using the FID appliance (FID-A)—An open source, MATLAB-based toolkit."Magnetic resonance in medicine (2015).
4. Cramer, Steven C., et al. "Activation of distinct motor cortex regions during ipsilateral and contralateral finger movements." Journal of neurophysiology81.1 (1999): 383-387.
5. Lin, Yan, et al. "Investigating the metabolic changes due to visual stimulation using functional proton magnetic resonance spectroscopy at 7 T." Journal of Cerebral Blood Flow & Metabolism 32.8 (2012): 1484-1495.
6. Mangia, Silvia, et al. "Sustained neuronal activation raises oxidative metabolism to a new steady-state level: evidence from 1H NMR spectroscopy in the human visual cortex." Journal of Cerebral Blood Flow & Metabolism 27.5 (2007): 1055-1063.
7. Schaller, Benoît, et al. "Are glutamate and lactate increases ubiquitous to physiological activation? A 1 H functional MR spectroscopy study during motor activation in human brain at 7Tesla." Neuroimage 93 (2014): 138-145.
8. Mostert, Jop P., et al. "1H Magnetic resonance spectroscopy of the internal capsule in human brain: a feasibility study to detect lactate following contralateral motor activity." European radiology 15.7 (2005): 1349-1352.
Figures