2978
Attenuated excitatory metabolism in the prefrontal Cortex of single prolonged stress model: in vivo and ex vivo proton magnetic resonance spectroscopy1Department of Biomedical Engineering, and Research Institute of Biomedical Engineering. The Catholic University of Korea College of Medicine, Seoul, Korea, Republic of, 2Asan Institute for Life Sciences, Asan Medical Center, Seoul, Korea, Republic of
Synopsis
The purpose of the study was to evaluate neurochemical changes in the prefrontal cortex of rats during time-dependent sensitization in the single prolonged stress (SPS) model that reveals pathogenetic neurometabolites characteristic of posttraumatic stress disorder by using in vivo and ex vivo proton magnetic spectroscopy. After the time-sensitization period, Glu and Cr levels were reduced and Cho and Lac levels were increased in SPS group in comparison with control group. These indicate that SPS induced sustained adaptation of the glutamatergic activity in PFC.
Purpose
Materials and Methods
Animal
Male Sprague-Dawley rats (n = 16; mean body weight: 200 - 220 g) were arbitrary assigned into two groups: SPS (n = 9) and control (n = 7). The SPS protocol was applied to SPS group. Rats were restrained for 2 h and then immediately forced to swim for 20 min in water (20 - 24°C). After a 15 min recuperation period, rats were exposed to ether (using a desiccator) until general anesthesia occurred (< 5 min) and then placed in their home cages for 7 days without further disturbance. Control group was placed in their home cages for 7 days without any stress.
In vivo MR spectroscopy
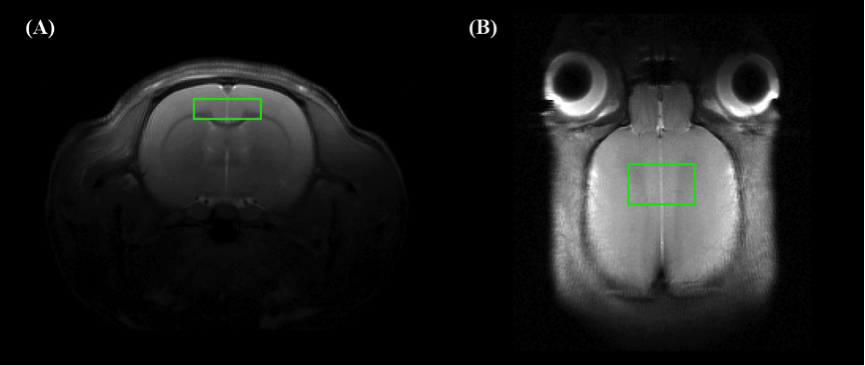
In vivo proton MRS was performed 30 min before SPS, approximately 30 min after the three stressors, 3 and 7 days after the three stressors to investigate time-dependent changes on metabolites levels in the PFC. Acquisition of in vivo MRS spectra and MRI was conducted at four time points using 9.4T Agilent Scanner. The MRS scan parameters were as follows: TR = 5000 ms; TE = 13.4 ms; number of averages = 256; spectral width = 5000 Hz; complex data points = 2048.
Ex vivo MR spectroscopy
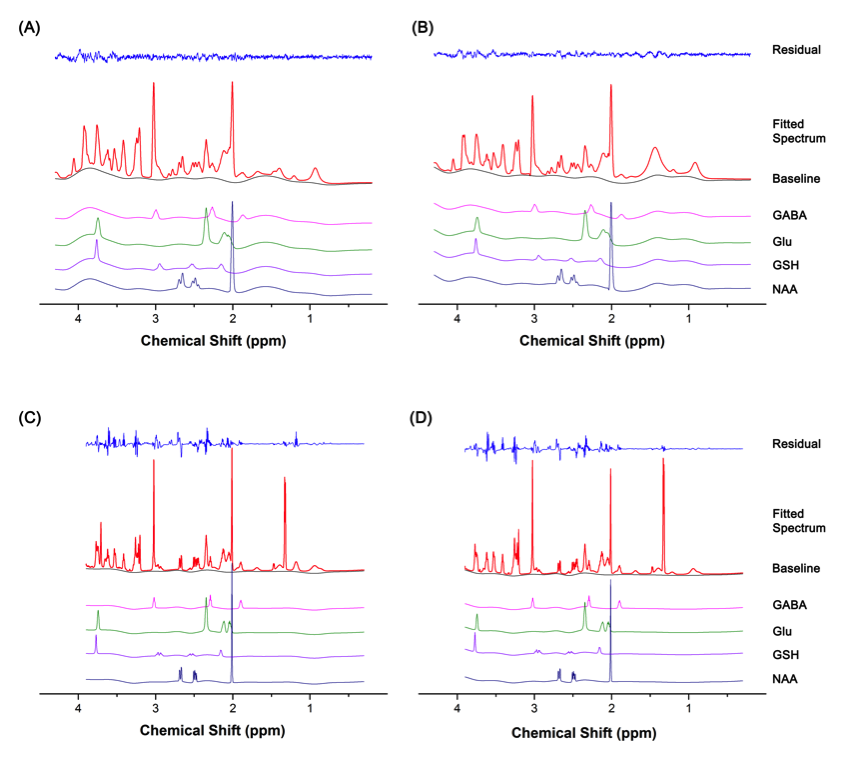
After the final in vivo MRS scans were acquired on day 7, all the animals were sacrificed and the prefrontal cortex was quickly harvested using the brain slicer matrix. The intact tissue was placed in a disposable insert kit and D2O containing 0.75% (wt) trimethylsilyl propionate was added to provide a field-frequency lock for the NMR spectrometer. All the 1H HR-MAS NMR spectra were acquired on an ADVANCE 700 NMR spectrometer a spin rate of 6000 Hz at 293 K. The NMR spectra were acquired using a 1D Carr-Purcell-Meiboom-Gill (CPMG) pulse sequence with water presaturation with the following parameters: 128 transients, 32K data points, a spectrum width of 14097.7 Hz, a spin-spin relaxation delay (2nτ) of 252 ms, the recycle delay was 4 s. LCModel was used to analyze both the in vivo and the ex vivo spectra.
All the statistical analyses were performed using the SPSS 21 software. An independent t-test was used to compare the metabolite concentrations between the control and SPS groups at each time point. The differences in metabolite levels with respect to the ‘time’ and ‘group’ factors were considered statistically significant when the associated p values were less than 0.05 (*p < 0.05; **p < 0.01; ***p < 0.001).
Results
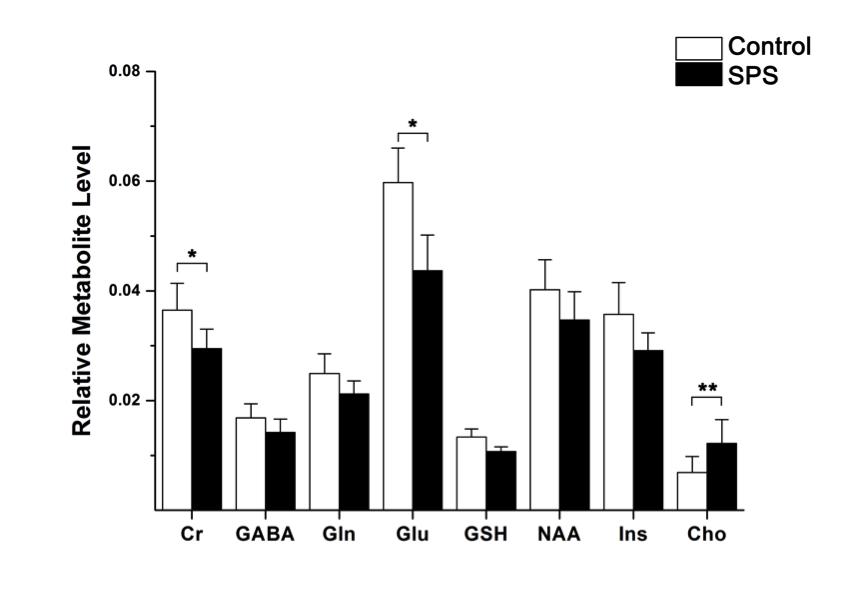
Independent t-tests showed significant differences in the metabolites between the SPS and control groups at each time point in vivo. At baseline, the Glu, GSH, Ins, NAA, tCho, and tNAA levels in the SPS group were higher than those in the control group (p < 0.05). At day 0, the Glu, GSH, Ins, NAA, and tNAA levels in the SPS group were higher than those in the control group (p < 0.05). In contrast, the tCho level in the SPS group was lower than that in the control group (p = 0.012). At day 3, the GSH level in the SPS group was lower than that in the control group (p = 0.002). At day 7, the Ins level in the SPS group was lower than that in the control group (p = 0.026). In the ex vivo HR-MAS analysis at day 7, the relative concentrations for Glu and Cr in the control group were significantly higher than those in the SPS group (p < 0.05). However, the relative levels of Lac and Cho in the control group were significantly lower than those in the SPS group (p < 0.05).
Discussions
In conclusion, our results have demonstrated that in vivo and ex vivo 1H MRS spectra provided valuable information that revealed attenuated activity in the PFC of the SPS rat model. After the SPS application, SPS group showed sign of oxidative stress (GSH) and cellular membrane turnover (Cho and tCho) for 7 days. After the time-sensitization period, Glu and Cr levels were reduced and Cho and Lac levels were increased in SPS group in comparison with control group. These indicate that SPS induced sustained adaptation of the glutamatergic activity in PFC2.Acknowledgements
This study was supported by grants (2012-007883) from the Mid-career Researcher Program through the National Research Foundation (NRF) funded by the Ministry of Science, ICT & Future Planning (MSIP) of Korea. And, this research was supported by a grant of the Korea Health Technology R&D Project through the Korea Health Industry Development Institute (KHIDI), funded by the Ministry of Health & Welfare, Republic of Korea (grant number: HI14C1135).References
1. Liberzon, I., & Young, E. A. (1997). Effects of stress and glucocorticoids on CNS oxytocin receptor binding. Psychoneuroendocrinology, 22(6), 411–422. http://doi.org/10.1016/S0306-4530(97)00045-0
2. Yamamoto, S., Morinobu, S., Takei, S., Fuchikami, M., Matsuki, A., Yamawaki, S., & Liberzon, I. (2009). Single prolonged stress: toward an animal model of posttraumatic stress disorder. Depression and Anxiety, 26(12), 1110–7. http://doi.org/10.1002/da.20629
Figures