2976
Longitudinal MRS Study following Treatment of Early-Phase Psychosis with N-Acetylcysteine1Health Sciences, Purdue University, Lafayette, IN, United States, 2Purdue University; Indiana University School of Medicine, 3Indiana University School of Medicine, 4Health Sciences, Purdue University; Indiana University School of Medicine, Lafayette, IN, United States
Synopsis
This study followed early stage schizophrenia patients undergoing treatment with single voxel MRS in the frontal lobe. Patients were split into a placebo (sugar pills) and treatment (N-acetylcysteine (NAC)) group and followed over the course of a year where they participated in 2-3 MRS scans at regular intervals. Patients show significantly elevated concentrations of Cre and Glx when compared to controls. This significance remained throughout the longitudinal study in intra- and inter-patient comparisons. This unchanged elevation of Glx and Cre contradicts the hypothesis that NAC will work to normalize these metabolite concentrations.
Purpose:
Schizophrenia is a psychiatric disorder characterized by disordered thoughts, abnormal social behaviors, flat affect, and auditory or visual hallucinations. Glutamatergic levels have been observed to increase, in early episode psychosis, in the frontal lobe.1 In the current study, using in vivo magnetic resonance spectroscopy (MRS), we aimed to 1) investigate alterations in brain metabolism in patients near the onset of psychoses (early-phase psychosis, EPP) to characterize abnormalities during the early stages of schizophrenia; and 2) to investigate whether N-acetylcysteine (NAC), a proposed treatment for schizophrenia, will affect the regulation of brain metabolite levels if any change is observed.Methods:
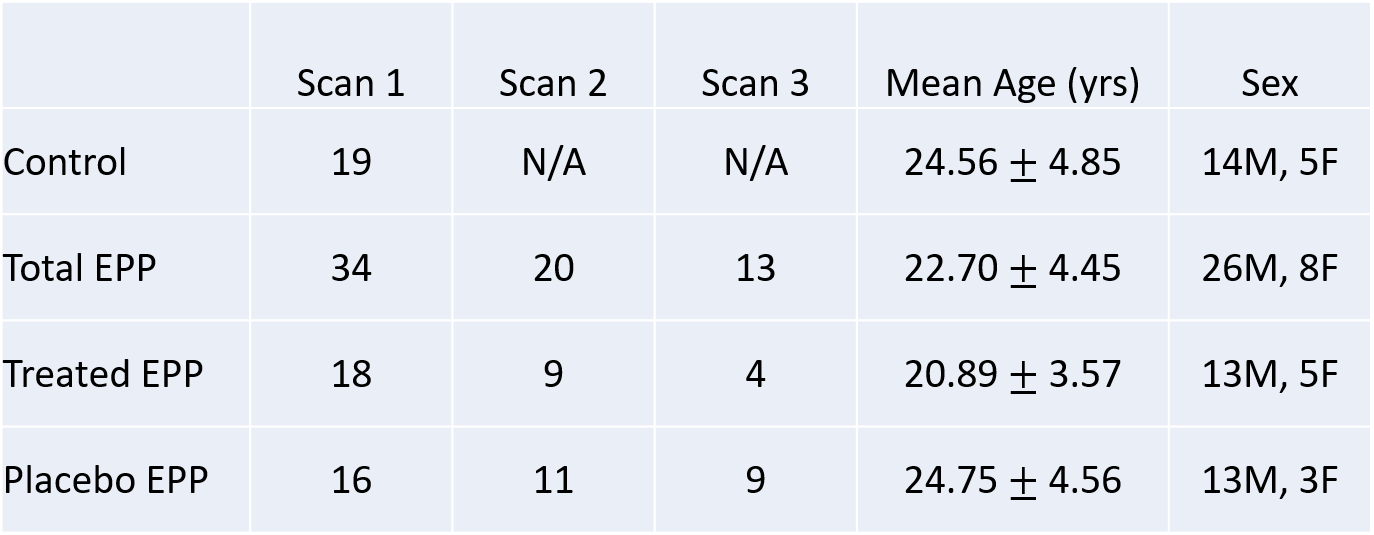
Baseline scans were acquired in 19 healthy controls and 34 EPP patients within two years of psychotic illness onset and no longer than 5 years from onset. EPP patients were split into a placebo and a treatment group after the baseline scan for longitudinal analysis (table 1). Patients from both groups were scanned again 24 and 52 weeks after the baseline scan. All MRI/MRS acquisitions were performed on a Siemens 3T TIM Trio whole-body scanner with a 32-channel head coil. T1-weighted MPRAGE images were acquired for anatomical information. The MRS volume of interest (VOI) was placed medially in the frontal cortex (size = 2x2x2 cm3; TE = 30ms; TA = 4min) (fig. 1a). All spectroscopy data were quantified using LCModel V6.2-0R (Fig.1b) and scaled to the internal water signal, obtained with a water-unsuppressed scan. MPRAGE images were segmented into gray matter, white matter and cerebral spinal fluid with SPM12. The percentage of each type of tissue within the MRS VOI was calculated using in-house Matlab code. Metabolite concentrations were then corrected for CSF using the following equation2:
$$M_{corr} = M_{uncorr}*\frac{(WM+GM)+(1.55*CSF)}{(WM + GM)}$$
Two-tailed unpaired t-tests were used for the comparison of creatine (Cre) and glutamine + glutamate (Glx) concentrations between the controls and EPP baseline differences. EPP placebo and treatment groups were analyzed using two-tailed paired t-tests. One-way ANOVA tests, using R 3.3.1, were used to compare Cre and Glx over the three scans for both placebo and treated patients and used to compare metabolite levels of controls, placebos, and treated patients for scan 2 and scan 3.
Results:
A
cross-sectional analysis between controls and the baseline scan of EPP patients
found significantly elevated Glx in EPP ([controls] = 4.070.27mM, [EPP] = 4.930.25mM, p =
0.0297, (fig.
2a)) and significantly elevated Cre in EPP ([controls] = 2.750.18mM, [EPP] = 3.340.15mM, p = 0.0156, (fig. 2b)). No significant
difference was found for levels of Glx (F(2, 28) = 1.189, p = 0.3195) nor for
Cre (F(2, 28) = 0.679, p = 0.5151) in treated patients across the three scans. The change of Glx levels over the 3 scans are
displayed for each patient in Fig.2. Based on the lack of differences between
the placebo and treatment group, all of the EPP patients (treated and placebo)
were combined as one group for the follow-up scans and student t-tests were
conducted to compare the group differences in Glx and Cre between baseline
scans from controls and the 2nd and 3rd scans from
patients, to test whether the significant elevation of the metabolites was
still observable. The 2nd scan still shows a significant elevation
of Glx and Cre levels in the EPP group compared to controls (patients: Glx:
p=0.0267, [Glx]=5.160.38mM; Cre: p=0.0186, [Cre]=3.530.26mM). Due to the small sample size in the
third scan, no significance was observed anymore (fig. 3).Discussion and Conclusion:
The significantly increased Glx in the frontal lobe in EPP
patients that was found in this study is consistent with prior reports. Elevated Glx and Cre could possibly be related
to N-methyl-D-aspartate (NMDA) receptor hypofunction in the frontal cortex and
the abnormal energy metabolism observed near first episodes of psychosis.3,4,5
The finding of elevated Cre is consistent with literature reporting increased
concentrations of Cre in the frontal lobe of children with schizophrenia.6 Lack of a significant longitudinal change in Glx or Cre levels in NAC-treated
patients indicates that NAC might not be very effective for regulating frontal
metabolite levels to normal. This is further supported by the group comparison
between all EPP patients (treated and placebo) in the follow-up scans with
baseline control-levels, as the increase of Glx and Cre did not vanish in
patients.
Acknowledgements
This study is supported by the Stanley Medical Research Institute.References
1. Poels, Kegeles, Kantrowitz, Javitt, Lieberman, Abi-Dargham, & Girgis. (2014). Glutamatergic abnormalities in schizophrenia: A review of proton MRS findings. Schizophrenia Research, 152(2-3), 325-332.
2. Chowdhury, F., O'Gorman, R., Nashef, L., et al.(2015). Investigation of glutamine and GABA levels in patients with idiopathic generalized epilepsy using MEGAPRESS. Journal of Magnetic Resonance Imaging, 41(3), 694-699.
3. Smesny, Gussew, Biesel, Schack, Walther, Rzanny, et al. (2015). Glutamatergic dysfunction linked to energy and membrane lipid metabolism in frontal and anterior cingulate cortices of never treated first-episode schizophrenia patients. Schizophrenia Research, 168(1-2), 322-329.
4. Tibbo, P. G., Bernier, D., Hanstock, C. C., Seres, P., Lakusta, B. and Purdon, S. E. (2013), 3-T proton magnetic spectroscopy in unmedicated first episode psychosis: A focus on creatine. Magn Reson Med, 69: 613–620.
5. Olney JW, Farber NB.(1995): Glutamate receptor dysfunction and schizophrenia. Arch Gen Psychiatry. 52:998-1007.
6. O'neill, J., Levitt, J., Caplan, R., Asarnow, R., Mccracken, J. T., Toga, A. W., & Alger, J. R. (2004). 1H MRSI evidence of metabolic abnormalities in childhood-onset schizophrenia. NeuroImage, 21(4), 1781-1789.
Figures
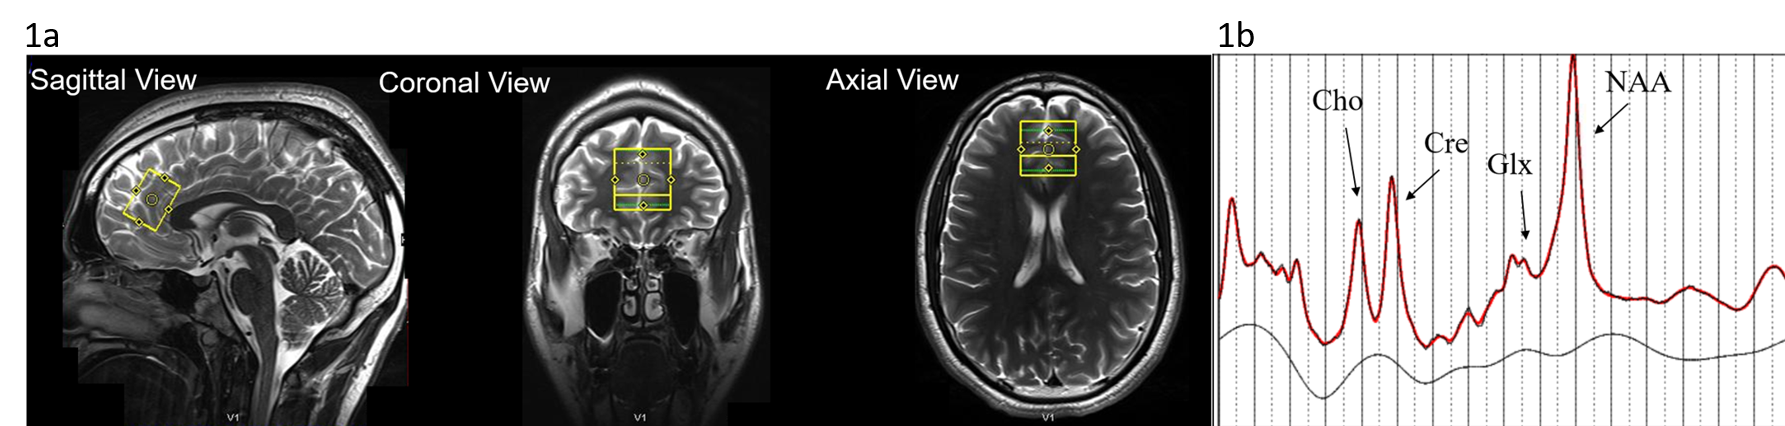
Figure 1a: Showing voxel placement in frontal lobe from the sagittal, coronal, and axial planes.
Figure 1b: Example of spectrum from our study showing the peaks of Glx, Cre, choline (Cho), and N-acetylaspartate (NAA)
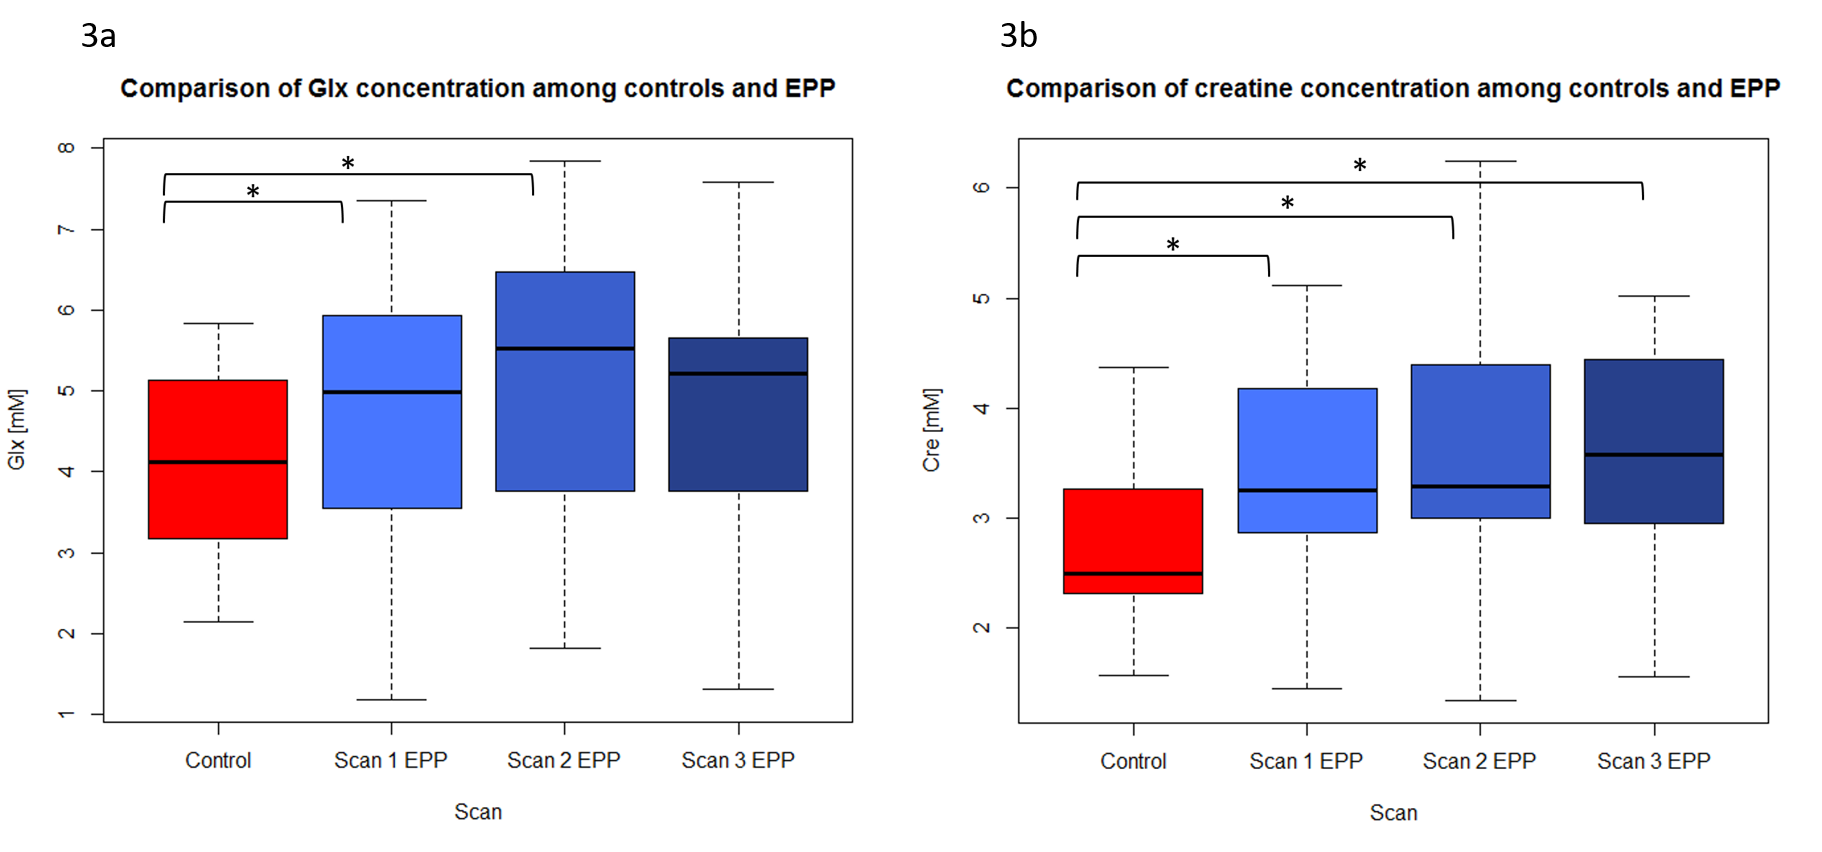
Figure 3a: group comparisons of Glx for controls and longitudinal scans for EPP patients.
*(Control to EPP Scan 1) p = 0.0297
*(Control to EPP Scan 2) p = 0.0267
Figure 3b: group comparisons of Glx for controls and longitudinal scans for EPP patients.
*(Control to EPP Scan 1p = 0.0156
*(Control to EPP Scan 2) p = 0.0186
*(Control to EPP Scan 3) p = 0.0176
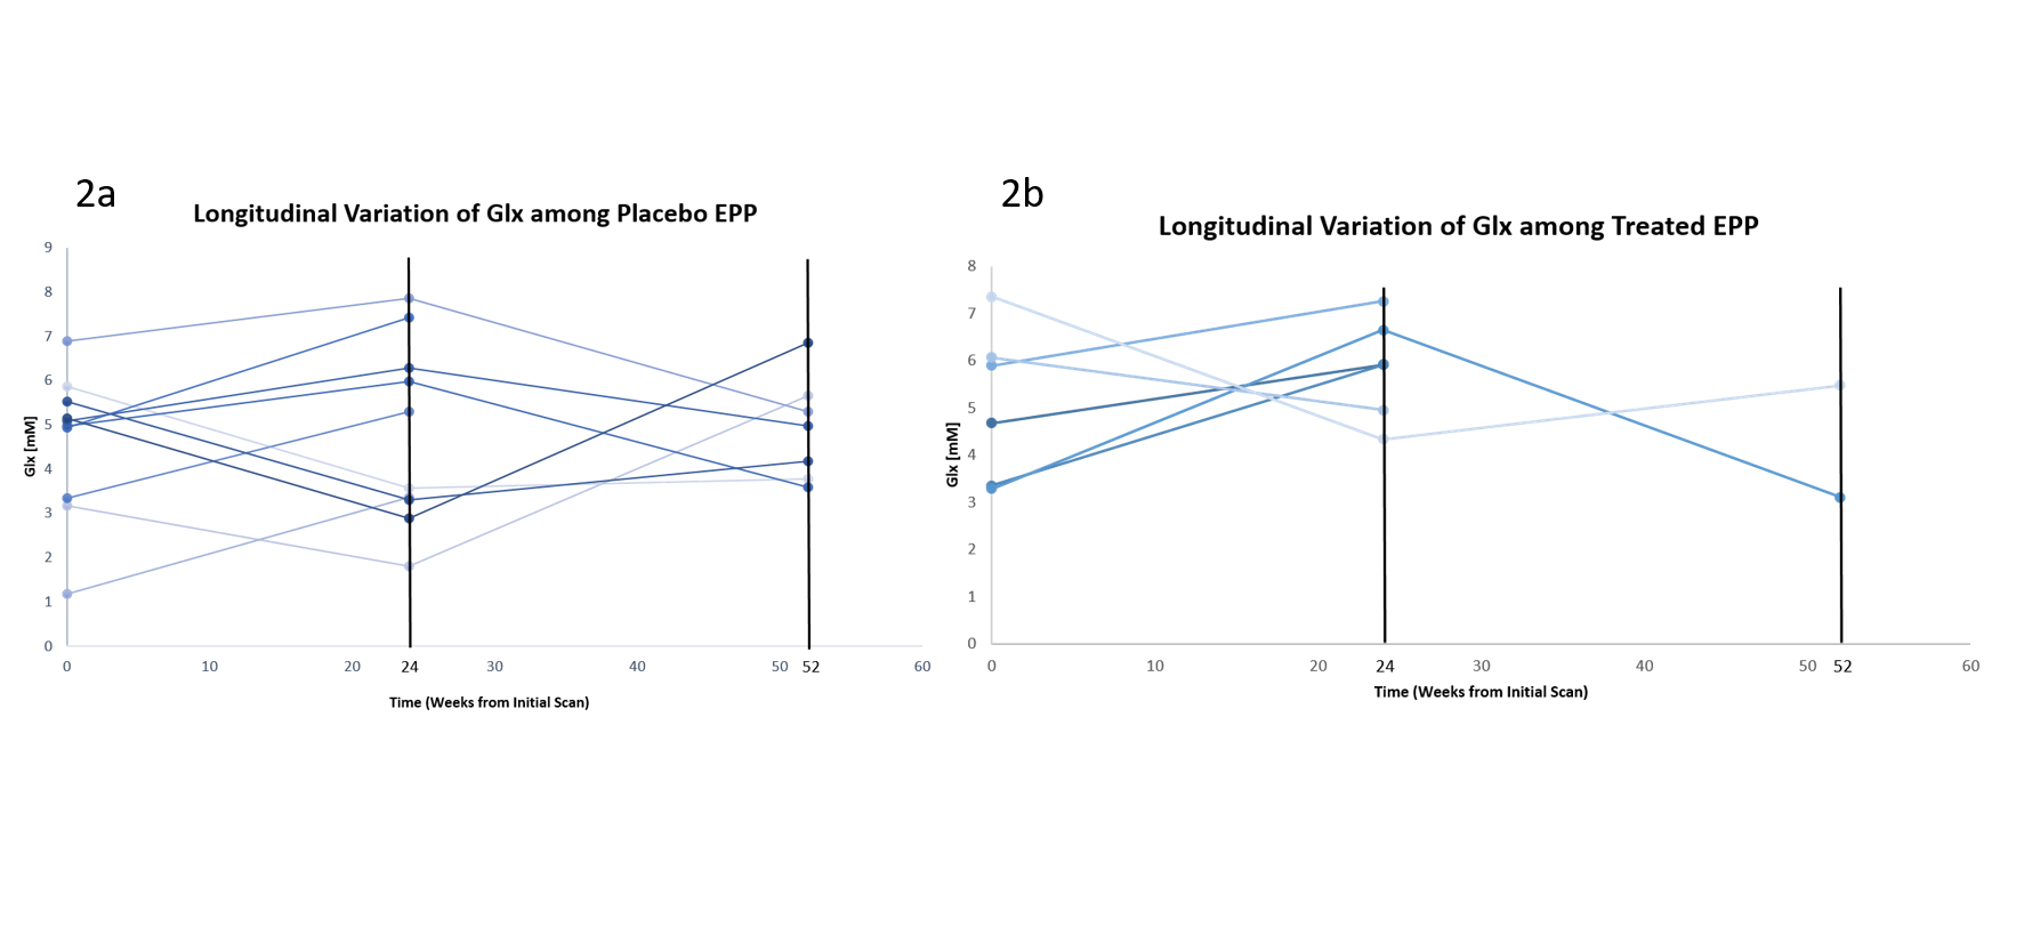
Figure 2a: Concentration of Glx for EPP patients receiving placebo.
Figure 2b: Concentration of Glx for EPP patients receiving treatment with NAC.