2975
GABA concentration measurements in infants without sedation1Beckman Institute, University of Illinois at Urbana-Champaign, Urbana, IL, United States, 2Boston Children's Hospital, Harvard Medical School, Boston, MA, United States, 3Beth Israel Deaconess Medical Center, Boston, MA, United States, 4Department of Bioengineering, University of Illinois at Urbana-Champaign, Urbana, IL, United States, 5Boston Children's Hospital, Harvard Medical School, Boston, MA
Synopsis
We report measurements of GABA concentration in infants without sedation using the MEshcher-Garwood (MEGA) sequence. Single-voxel measurements were performed in 114 infants at approximately one month and/or three months of age. Quantification is performed with water scaling, and concentration values are reported in units of mM of NMR-visible water in the brain. For the two scan times, we found the inter-subject coefficient of variation (CV) of GABA to be 8% and 9%, respectively. Average GABA concentration values are 7% higher for the 3 month scan than the 1 month scan, indicating a gradual increase in GABA concentration after birth.
Introduction
gamma-Aminobutyric acid (GABA) plays a critical role in the early development and growth of neurons (1). J-difference editing is widely used for measuring GABA concentration in human brain (2, 3). This technique has been validated in adults (4-7); however, it has rarely been performed in infants (8, 9). Here we report the largest sample to date of GABA measurements in healthy infants.Methods
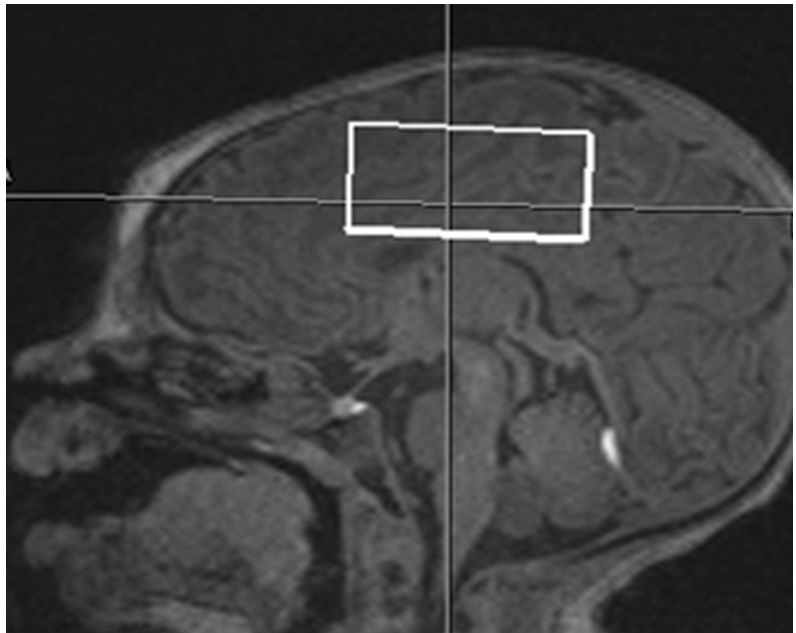
Healthy term infants were scanned without sedation in compliance with IRB guidelines. Data was acquired on a Siemens TIM Trio 3 T system with a 32-channel head coil. Infants included for analysis were scanned approximately 1 month after birth (range: 12-52 days, mean: 27 days) and/or approximately 3 months after birth (range: 77-136 days, mean: 101 days). Our scanning protocol consisted of a multi-echo MPRAGE acquisition enhanced with volumetric EPI navigators for prospective motion correction (voxel size = 1 mm3, FOV 160 mm2, GRAPPA R = 2; TR = 2350 ms, TI = 1450 ms, FA = 7 degrees, overall scan time of 4:51 min). This scan was used to position a single voxel of 30 x 40 x 20 mm superior to the lateral ventricles (see Fig. 1). Metabolite spectra were obtained with a MEshcher-Garwood (MEGA) sequence that included PRESS excitation and a Gaussian editing pulse of bandwidth 44 Hz that alternated between an “edit-on” condition at 1.9 ppm and an “edit-off” condition at 7.5 ppm (TE/TR = 68/2000 ms, water suppression). Initially this sequence was performed with 144 averages for all subjects. However, to minimize the effect of changes in center frequency due to drift and head motion we revised the protocol to include 1 to 3 scans of 48 averages, with a manual readjustment of center frequency before each scan. These scans were immediately followed by an identical acquisition with no water suppression (TR = 30s, one average). To further characterize the relaxation of the water signal we also performed single-voxel PRESS acquisitions with no water suppression, and TE = 30, 70, 150, 250, 600, 900,1100,1300,1500 ms (TR = 30s, one average, 512 points, bandwidth 1250 Hz).
Spectra were post-processed using code adapted from the FID-A processing toolbox (github.com/CIC-methods/FID-A). We first performed a weighted coil array recombination, then removed averages contaminated by motion, and then performed a frequency drift correction (10) . In some infants, small motions produced abrupt changes in frequency. We discarded averages that were acquired after the frequency drifted more than 2 Hz from the start of each scan. We summed all averages, and then performed a manual adjustment of frequency and phase to minimize residual choline and creatine in the difference spectrum. LCModel was used to fit GABA from the difference spectrum and all other metabolites from the edit-off spectrum. Water-scaled metabolite concentrations were corrected for CSF fraction and T2 relaxation of the water signal, obtained by fitting double exponential functions to relaxation data (11, 12). For some subjects the relaxation data was contaminated by motion, causing us to report only metabolite ratios. We required that Cramer-Rao error estimates be <= 8% for GABA, and <=15% for other metabolites. Outliers that were more than 2.2 times the interquartile range from the median value were discarded. We corrected for metabolite relaxation using adult literature values, and report metabolite concentrations in units of mM of NMR-visible water in brain tissue.
Results
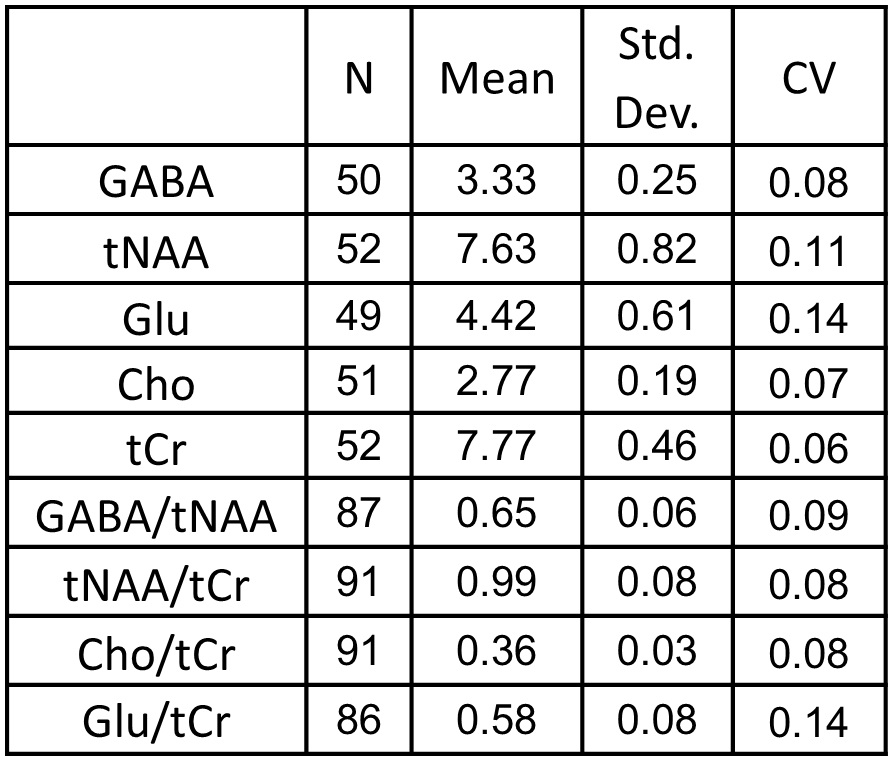
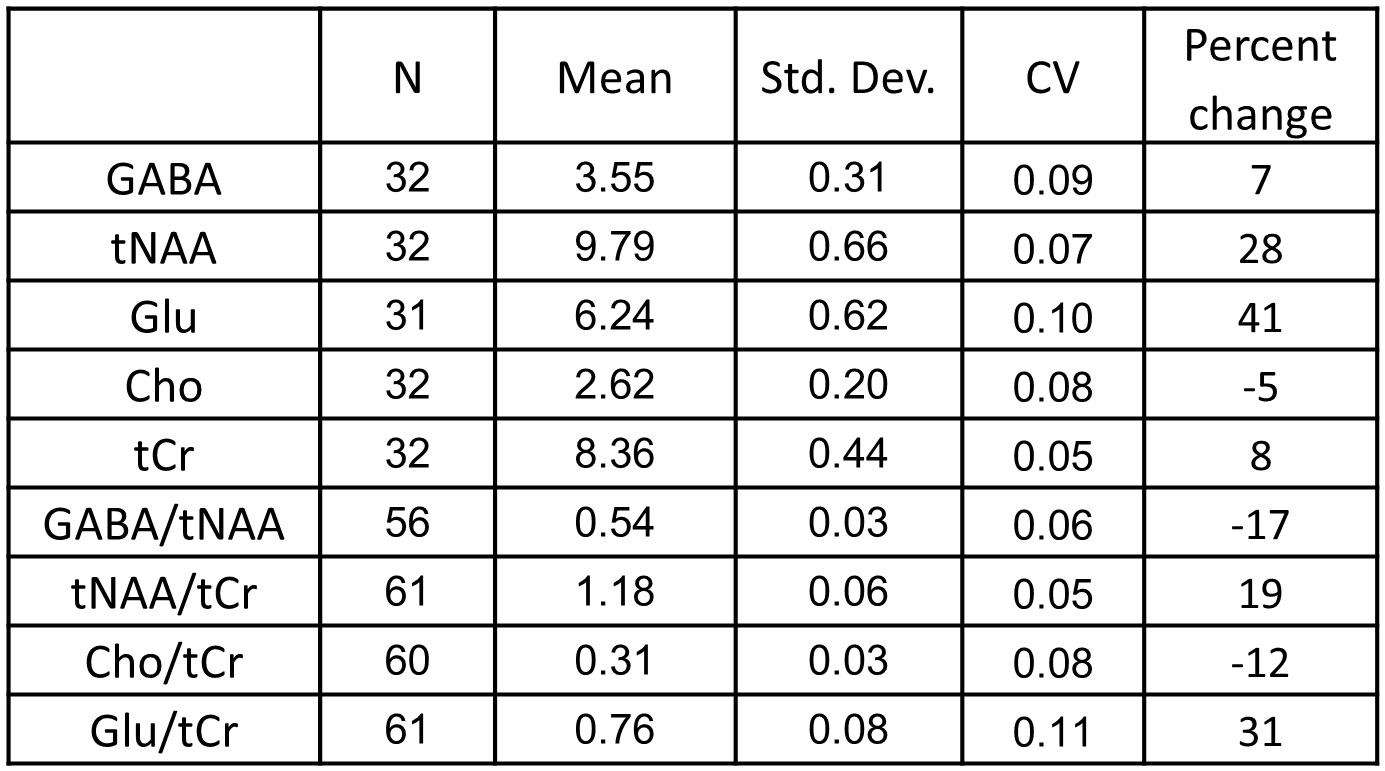
For the two scan times, we found the inter-subject coefficient of variation
(CV) of GABA to be 8% and 9%. This is
similar to inter-subject CVs of GABA in the range of 9-15% that have been
observed in young adults at 3T (4-6) (see Tables 1 and 2).
We also observed CVs in the range of 5% - 14% for NAA +NAAG (tNAA), total
choline signal (Cho), total creatine (tCr), and Glutamate (Glu). CVs obtained
from metabolite ratios were similar to those obtained with the use of
water-scaling (see Tables 1 and 2). Discussion
The observed CVs are reasonable, despite the relatively large age range of the infants during a period of rapid change and development. Comparison of average metabolite concentration difference between the two time points suggests large increases in NAA and Glu concentration, a small increase in tCR, and a decrease in Cho, consistent with trends reported previously (13). Our results also show an increase in GABA concentration after birth.Conclusion
We have demonstrated the use of MEGA-PRESS for measuring GABA concentration in sleeping infants. Further improvements can likely be achieved with the use of navigators to update acquisition parameters during scanning to account for head motion.Acknowledgements
Thanks to Dr. Jamie Near for kindly providing analysis code. This work is funded by Abbott Nutrition through the Center for Learning Nutrition and Memory at the University of Illinois at Urbana-Champaign.References
1. Y. Ben-Ari, Excitatory actions of gaba during development: the nature of the nurture. Nat Rev Neurosci 3, 728-739 (2002).
2. M. Mescher, H. Merkle, J. Kirsch, M. Garwood, R. Gruetter, Simultaneous in vivo spectral editing and water suppression. Nmr Biomed 11, 266-272 (1998).
3. P. G. Mullins et al., Current practice in the use of MEGA-PRESS spectroscopy for the detection of GABA. NeuroImage 86, 43-52 (2014).
4. C. J. Evans, D. J. McGonigle, R. A. E. Edden, Diurnal Stability of gamma-aminobutyric Acid Concentration in Visual and Sensorimotor Cortex. Journal of Magnetic Resonance Imaging 31, 204-209 (2010).
5. R. L. O'Gorman, L. Michels, R. A. Edden, J. B. Murdoch, E. Martin, In vivo detection of GABA and glutamate with MEGA-PRESS: reproducibility and gender effects. J Magn Reson Imaging 33, 1262-1267 (2011).
6. W. Bogner et al., In vivo quantification of intracerebral GABA by single-voxel H-1-MRS-How reproducible are the results? European Journal of Radiology 73, 526-531 (2010).
7. J. Near, Y. C. Ho, K. Sandberg, C. Kumaragamage, J. U. Blicher, Long-term reproducibility of GABA magnetic resonance spectroscopy. NeuroImage 99, 191-196 (2014).
8. E. J. Novotny, Jr., F. Hyder, M. Shevell, D. L. Rothman, GABA changes with vigabatrin in the developing human brain. Epilepsia 40, 462-466 (1999).
9. S. H. Kwon et al., GABA, resting-state connectivity and the developing brain. Neonatology 106, 149-155 (2014). 1
10. J. Near et al., Unedited in vivo detection and quantification of gamma-aminobutyric acid in the occipital cortex using short-TE MRS at 3 T. Nmr in Biomedicine 26, 1353-1362 (2013).
11. R. Kreis, T. Ernst, B. D. Ross, Development of the Human Brain - in-Vivo Quantification of Metabolite and Water-Content with Proton Magnetic-Resonance Spectroscopy. Magnetic Resonance in Medicine 30, 424-437 (1993).
12. T. Ernst, R. Kreis, B. D. Ross, Absolute Quantitation of Water and Metabolites in the Human Brain .1. Compartments and Water. J Magn Reson Ser B 102, 1-8 (1993).
13. S. Bluml et al., Metabolic Maturation of the Human Brain From Birth Through Adolescence: Insights From In Vivo Magnetic Resonance Spectroscopy. Cereb Cortex 23, 2944-2955 (2013).
Figures