2974
Influence of signal-to-noise, spectral filtering, and Cramér–Rao Lower Bounds for the optimal use of in vivo 2HG MRS to determine glioma IDH mutation status1Memorial Sloan Kettering Cancer Center, New York, NY, United States, 2GE HealthCare, Berlin, Germany
Synopsis
Cancer-associated mutations
in IDH results in overproduction of 2-hydroxyglutarate (2HG). A few studies
have evaluated the use of MR spectroscopy (MRS) technology to noninvasively
determine IDH mutation status by measuring 2HG concentrations. However, it is
unknown how factors such as signal-to-noise ratio (SNR), spectral apodization,
and Cramér–Rao Lower Bounds (CRLB) can influence MRS sensitivity and
specificity for 2HG detection in gliomas. This study seeks to define the ideal
method to define optimal thresholds of CRLB and spectral filtering resulting in
improved 2HG detection sensitivity without a drop in MRS specificity.
Introduction:
Gliomas make up 80% of malignant brain tumors, and the prognosis for patients with gliomas depends greatly on whether they harbor a missense mutation in the metabolic gene isocitrate dehydrogenase (IDH).1 Recent studies have shown that cancer-associated mutations in IDH result in overproduction of 2-hydroxyglutarate (2HG), a detectable metabolite by proton MR spectroscopy (MRS). A few studies3 have evaluated the use of this technology to noninvasively determine IDH mutation status, but it is unknown how factors, such as signal-to-noise ratio (SNR), spectral apodization, and Cramér–Rao Lower Bounds (CRLB), will affect MRS sensitivity and specificity for 2HG detection. This study seeks to define the ideal method for noninvasively determining the IDH mutation status of a tumor.
Methods:
This retrospective study is HIPAA-compliant and an IRB waiver was obtained. Single voxel MRS data were acquired on a 3T, MR750 scanner, using an 8-channel head coil using PRESS (TE/TR=97/2000ms, 128/256 averages).
63 total patients with gliomas and known IDH mutation-status with MRS evaluable quality were included in the study. MRS evaluable quality is defined as having a SNR higher than 5 with line width less than 9-Hz. SNR is the ratio of the major peak amplitude to the baseline noise.
To study the effect of filtering on metabolite quantification, 4 data sets were prepared: raw (raw p-files were analyzed directly using LCModel), 0-Hz, 1-Hz, and 2-Hz filtering (using in-house Matlab code to coil combine signals with either “no” filter (0-Hz) or “1” or “2” Hz filter and were analyzed by LCModel). Concentrations were converted from LCModel units to standard units (mmol)3 by calculating a correction factor to include T1 and T2 effects of 2HG and water.3,4 Sensitivity and specificity to diagnose IDH-mutation status were calculated using different CRLB cutoff. Further, data was dichotomized into three groups based on SNR: ≥5, ≥10, ≥15.
A statistical analysis (t-test) was performed with p<=0.05 representing significance.
Results:
1) Varying level of filtering: Of these 63 patients, 55 were IDH-positive and 8 were wild-type (WT) (MSK-IMPACT analysis). The mean voxel volume was 7.18mL (± 4.05mL). An example of a glioma is provided (Figure 1), with positive 2HG in mutant IDH (mIDH) and undetectable levels of 2HG in patient WT IDH status. Twenty-two of the patients had not received any treatment at the time of the MRS scan. Of these 22 treatment-naive patients, 5 had WT IDH tumors. With a cutoff of CRLB≤30% as “positive for 2HG,” it was found that filtering resulted in a higher sensitivity of the test without compromising specificity up to 2-Hz filtering, where specificity drops significantly (Figure 2). Table 1 show that there is no significant difference in 2HG detection in voxels with “no” filter and 1-Hz filter. Hence, 1-Hz is the optimal filtering for processing the tumor voxel data. As could be anticipated, limiting the data set to only data points with higher SNR also increases the sensitivity for all filtering levels. For eg., using the 1-Hz data set, with SNR ≥ 5, sensitivity was 49.1%.
2) Limiting the data set and changing CRLB cutoff: Changing the CRLB cutoff for a positive case from the customary 30% to 40% increases the sensitivity while maintaining a specificity of 100% (using the 1-Hz data set, Table2). Increasing the CRLB cutoff further will result in a decline in specificity.
3) Limiting the data set to pretreatment data: When the 1-Hz data set was limited to only pre-treatment patients, the sensitivity of the 2HG test increased with 100% specificity. (Table 2)
Conclusion and Discussion:
Our study showed that there are a number of ideal characteristics that can alter the accuracy of using MRS to determine IDH-mutation status: 1) 2HG sensitivity was greatest in treatment naïve patients as 2HG levels could possibly decrease to an undetectable level post-treatment. 2) A -Hz filter should be applied to the data to reduce baseline noise and filter out other “noise” peaks that may interfere with quantification of the 2HG peak. 3) 2HG detection accuracy is increased with a higher SNR of the data. This is because SNR is proportional to MRS voxel size and tumor cellularity within the MRS volume, and it could thus be an important factor in clinical diagnostics. 4) CRLB threshold of 40% could be used as a threshold to define positive 2HG scan so MRS scan sensitivity increases without a drop in specificity. We hope to investigate the usage of CRLB of normal tissue as a reference to help in detecting the small 2HG levels possibly present in tumor tissue.
Acknowledgements
Brain Tumor Center grant, B*Cured foundation grant, MSK society grant, and Dana Foundation grant
References
1) Dang L, White DW, Gross S, et al. Cancer-associated IDH1 mutations produce 2-hydroxyglutarate. Nature. 2009; 462(7274): 739–744.
2) Choi C, Ganji SK, DeBerardinis RJ, et al. 2-hydroxyglutarate detection by magnetic resonance spectroscopy in IDH-mutated patients with gliomas. Nat Med. 2012;18(4):624–629.
3) de la Fuente MI, Young RJ,Thakur SB, et al. Integration of 2-hydroxyglutarate-proton magnetic resonance spectroscopy into clinical practice for disease monitoring in isocitrate dehydrogenase-mutant glioma. Neuro Oncol. 2016 Feb; 18(2):283-90.
4) Madan A, Ganji SK, Choi C, et al. Proton T2 measurement and quantification of lactate in brain tumors by MRS at 3 Tesla in vivo. Magn Reson Med. 2015;73(6):2094.
Figures
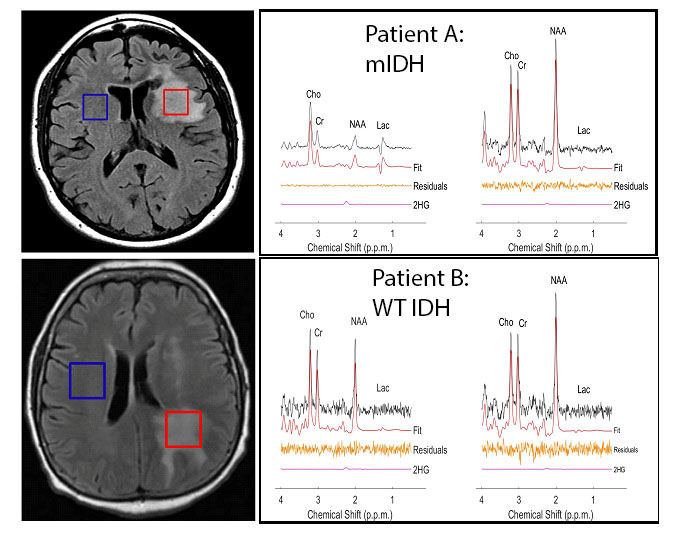
Figure 1: Left: MR images for a subject with a diffuse astrocytoma grade II brain tumor with mIDH status (Patient A) and WT IDH status (Patient B). Tumor and normal voxels are shown in red and blue.
Right: MR spectra for patient A and B where the tumor (left) and the normal voxel (right) are shown. (A) An IDH+ mutant patient with normal-voxel 2HG = 1.99 (CRLB=83%) and tumor 2HG = 4.70 (CRLB=8%). (B) A WT patient with normal-voxel 2HG = 2.007 (CRLB=79%) and tumor 2HG = 1.17 (CRLB=187%). The IDH+ mutant patient shows 2HG peak at 2.25 ppm.
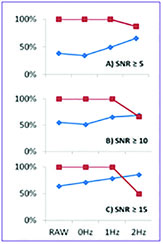
Figure 2. Sensitivity (blue) and specificity (red) for different amounts of filtering. (A) represents the full data sets. (B) and (C) represent truncated data sets only, including scans with an SNR greater than varying cutoffs.
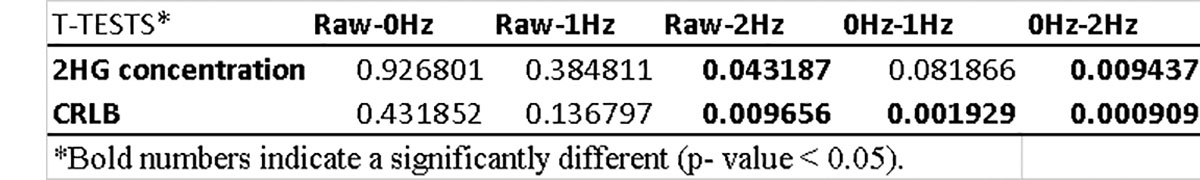
Table 1. Comparison of MRS voxel 2HG concentrations and CRLB values between RAW, 0Hz, 1Hz, and 2Hz by t-tests.

Table 2. 2HG MRS sensitivity and specificity at different CRLB thresholds