2971
KIDNEY CANCER SUBTYPES, IDENTIFIED BY TWO DIMENSIONAL MR SPECTROSCOPY, MAY EVENTUALLY ALLOW TREAMENT OF CLINICALLY DISTINCT DISEASES.1Translational Research Institute, Brisbane, Australia, 2Centre for Kidney Disease Research, UQDI, The University of Queensland, Brisbane, Australia, 3Department of Urology, Princess Alexandra Hospital, Brisbane, Australia, 4Aquesta Pathology, Brisbane, Australia
Synopsis
Small renal masses, such as non-clear cell renal carcinoma (non-ccRCC), can be monitored rather than resected as morbidity is unlikely. The distinction between malignant clear cell RCC (ccRCC) from indolent RCC subtypes and benign renal tumour is not possible by imaging thus some patients undergo unnecessary surgery1. Using 2D COrrelated SpectroscopY we report that normal renal tissue, non-ccRCC and ccRCC each has different chemical profile. ccRCC differs from normal tissue with cholesterol and lipid increased by 572% and 481% (P=0.001); decreased alanine 51% (P=0.001); valine 57% (P=0.003) and lysine 46% (P=0.005). When comparing ccRCC to the non-ccRCC there are increases in valine 48% (P=0.004) and lysine 40% (P=0.04).
Introduction
The increasingly common diagnosis of small renal masses (usually defined as Stage T1a lesions that are ≤ 4cm in size in the kidney) during routine abdominal imaging poses a challenge of how best to manage such patients that are not likely to progress and/or cause death. The most common type of kidney cancer is renal cell carcinoma (RCC). Despite current imaging and the use of renal neoplasm biopsy, most contemporary surgical series continue to report significant rates of benign lesions, amongst resected small renal masses. Other small masses, such as chromophobe RCC, can often be safely monitored rather than resected. Thus there are current concerns regarding over-diagnosis and over-treatment of patients with low-risk or indolent disease1. RCC makes up around 90% of kidney cancer often presenting late and depending on the subtype, often with poor prognosis. Clear cell (cc) RCC is the most common subtype (70–80% of RCC), with papillary (10–15%), chromophobe (5%) and collecting duct RCC (<1%). Renal oncocytoma, a benign growth, accounts for approximately 3–7% of adult renal neoplasms 1.
MRS has shown over many years that it can provide valuable diagnostic and prognostic information on biopsy by identifying the early stages of disease progression and extent of loss of differentiation2. Recently 1D MRS metabolic changes have been reported for RCC subtypes3,4.
Hypothesis
The diagnostic capability for renal pathology can be improved by the use of 2D MRS, on biopsy material by identifying molecular differences that distinguishes malignant clear cell RCC from the indolent or low malignant potential subclasses such as chromophobe RCC and benign oncocytoma. If possible this would support the concept that these cancers could be treated as clinically distinct diseases.Methods
The study was undertaken with approval from Queensland Metro South Health Human Research Ethics Committee. Patients from The Princess Alexandra Hospital Urological services were enrolled with informed consent. Samples for MRS analysis were collected after nephrectomy and included the tumour and normal cortical tissue distal to the tumour. Eighteen such paired samples i.e. tumour and normal tissue from the same patient, and 8 unmatched samples of human kidney tissue were analysed (44 samples). Samples were placed in D2O Phosphate-buffered saline (D2O PBS) and preserved in liquid nitrogen, and stored at -80°C, prior to MRS analysis. Samples were thawed and washed once in D2O PBS. 1H homonuclear COrrelation SpectroscopY (COSY) spectra were acquired on an Agilent Technologies MR400-DD2 NMR Spectrometer, running VnmrJ 4.2. Data were processed and analysed using FelixNMR 2007 (FelixNMR Inc, San Diego, USA) and cross and diagonal peak volumes were measured. The choline diagonal peak at 3.2ppm was the internal chemical shift reference.Results
Histopathology
The post-operative histopathology for 16 of the tumours was ccRCC. Nine were diagnosed as non-ccRCC, (one had insufficient cells). The remaining eight non clear cell tumours included: papillary type 1 (n=1), papillary type 2 (n=2), Hybrid Oncocytoma/Chromophobe tumour (n=2), Oncocytoma (n=1), Chromophobe (n=1) and RCC unclassified (n=1). All 16 specimens taken distant from the tumour were classified histologically as normal renal tissue.
Evaluation of the 2D COSY data
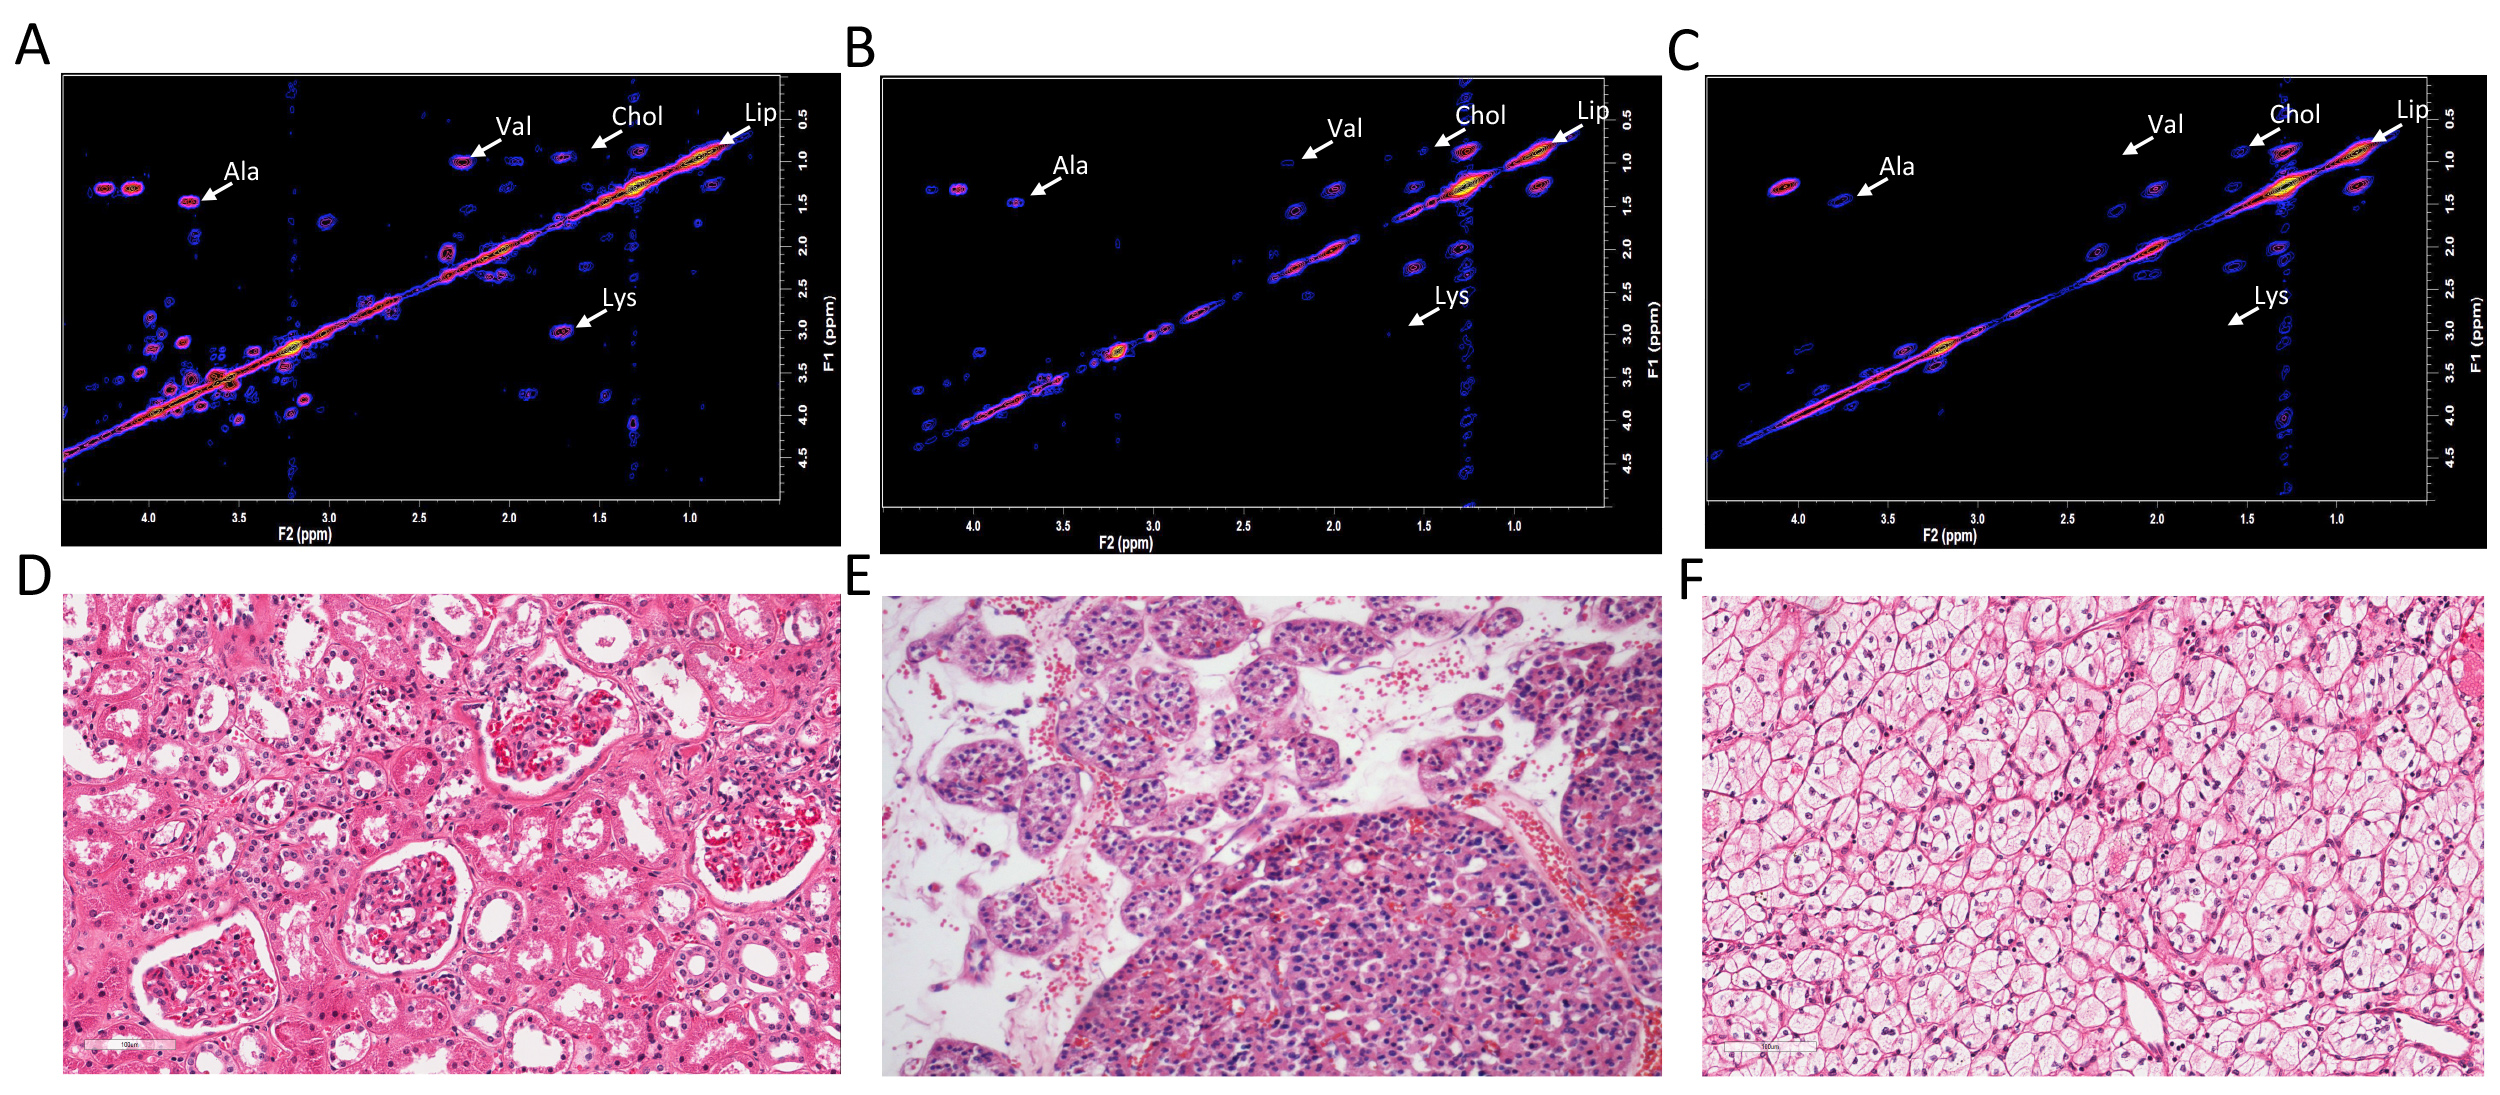
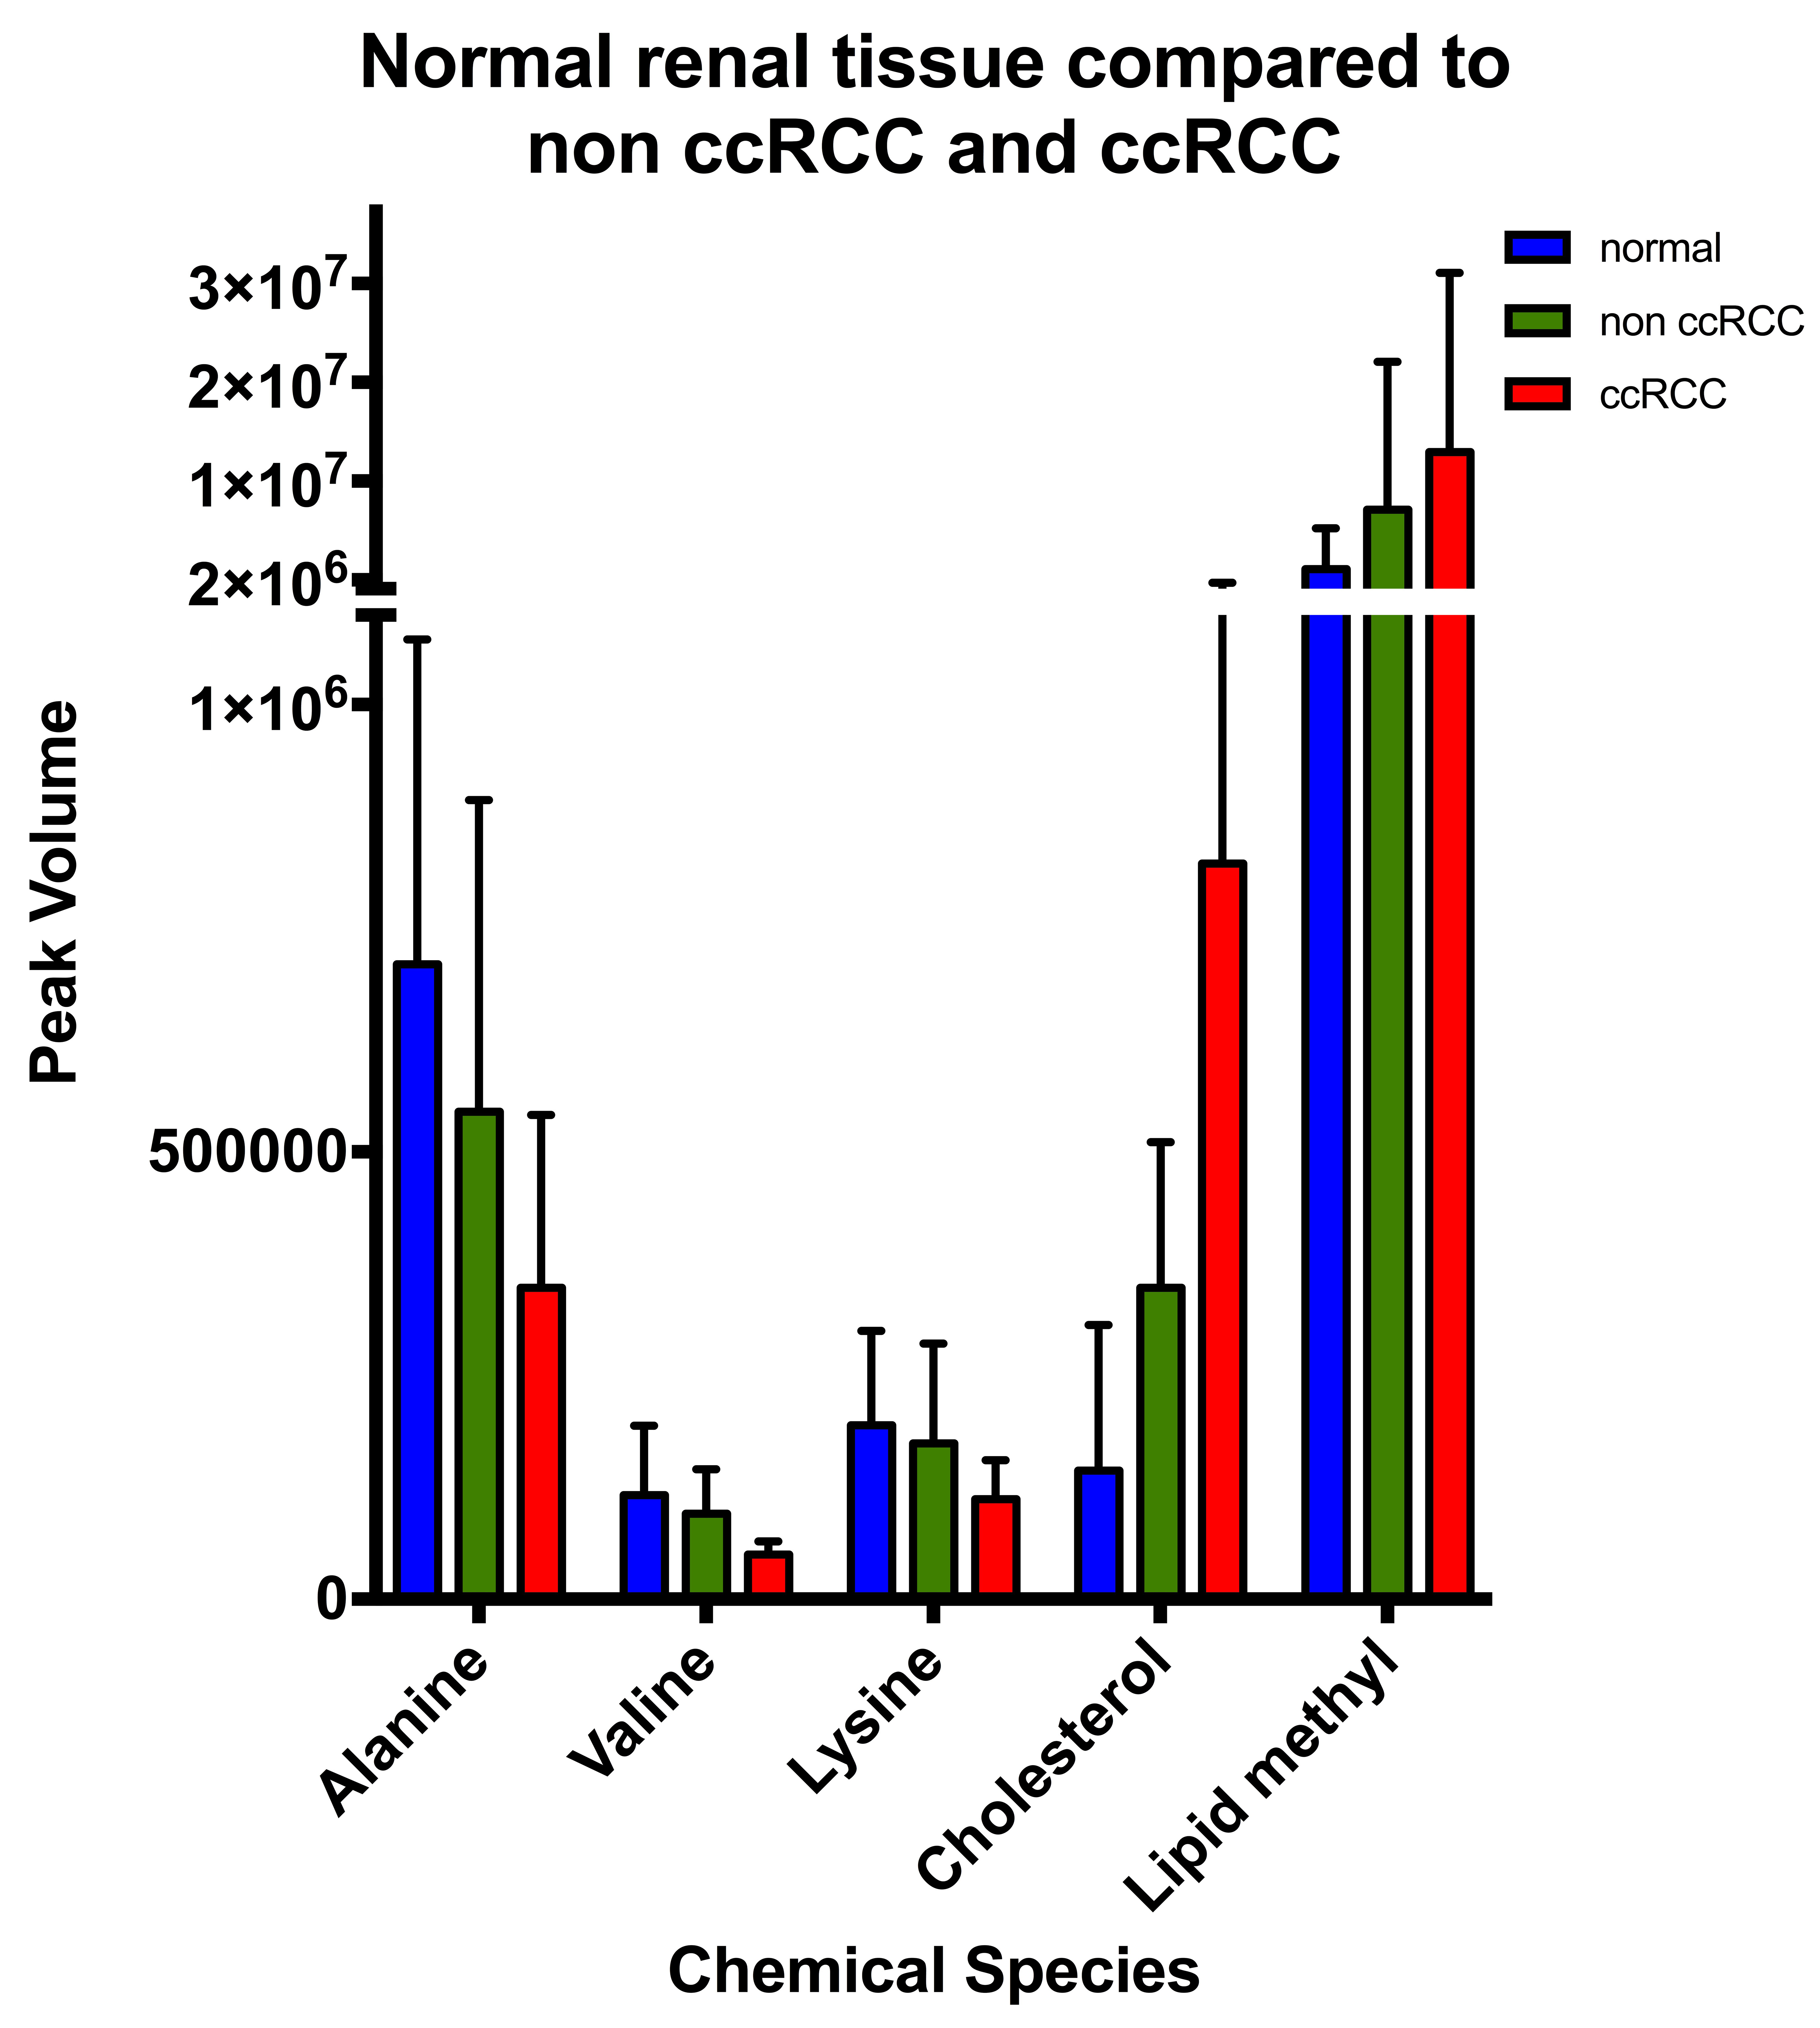
A 2D COSY from normal renal tissue is compared with a non-ccRCC “hybrid oncocytoma/ chromophobe tumour specimen and a ccRCC in figure 1. The resultant data comparisons are shown in figure 2. Assignments are as in 2.
Normal tissue vs ccRCC: Cholesterol (F2: 1.53ppm, F1: 0.88ppm) P=0.001 and lipid methyl group at (F2: 0.88 ppm, F1: 0.88ppm) P=0.006 were significantly increased by 572% and 481% respectively. Significant decreases were recorded for alanine (F2: 3.77ppm, F1: 1.47ppm) by 51% (P=0.001); valine (F2: 2.28, F1: 1.01ppm) by 57% (P=0.003) and lysine (F2: 1.70 ppm, F1: 3.01 ppm) by 46% (P=0.005).
ccRCC vs non ccRCC: Significant decreases in the ccRCC were recorded in the levels of valine (F2: 2.28, F1: 1.01ppm) by 48% (P=0.004) and lysine (F2: 1.70 ppm, F1: 3.01 ppm) by 40% (P=0.04) when compared with the non ccRCC. The decrease in the level of alanine (F2: 3.77ppm, F1: 1.47ppm) was not significant (P=0.08).
Discussion and Conclusions
This pilot study shows that normal healthy tissue, low-grade non-ccRCC lesions and ccRCC each have a unique 2D MRS signature. The gradual increase in cholesterol and lipid recorded with loss of cellular differentiation is consistent with chemical analyses and 2D MRS of cells and plasma membranes of other cancer models5. Confirmation of these results from a larger cohort could provide the means of to identify indolent small renal masses from those that are life threatening. With the different chemical signatures recorded the challenge is to develop the in vivo technology.Acknowledgements
No acknowledgement found.References
1. Ng KL, Rajandram R, Morais C, et al. Differentiation of oncocytoma from chromophobe renal cell carcinoma (RCC): can novel molecular biomarkers help solve an old problem? Journal of clinical pathology 2014;67:97-104.
2. Mountford CE, Doran S, Lean CL, Russell P. Proton MRS can determine the pathology of human cancers with a high level of accuracy. Chem Rev 2004;104:3677-704.
3. Ragone R, Sallustio F, Piccinonna S, et al. Renal Cell Carcinoma: A Study through NMR-Based Metabolomics Combined with Transcriptomics. Diseases 2016;4:7.
4. Sevcenco S, Krssak M, Javor D, et al. Diagnosis of renal tumors by in vivo proton magnetic resonance spectroscopy. World journal of urology 2015;33:17-23.
5. Mackinnon WB, Huschtscha L, Dent K, Hancock R, Paraskeva C, Mountford CE. Correlation of Cellular-Differentiation in Human Colorectal-Carcinoma and Adenoma Cell-Lines with Metabolite Profiles Determined by H-1 Magnetic-Resonance Spectroscopy. Int J Cancer 1994;59:248-61.
Figures