2970
Towards in vivo neurochemical profiling of multiple sclerosis with MR spectroscopy at 7 Tesla: Cross-sectional assessment of frontal-cortex glutathione, GABA, and glutamate in individuals with relapsing-remitting and progressive multiple sclerosis1Biomedical Engineering, Columbia University School of Engineering and Applied Science, New York, NY, United States, 2Radiology and Biomedical Imaging, Yale University School of Medicine, New Haven, CT, United States, 3Neurology, Yale University School of Medicine, New Haven, CT, United States, 4Radiology, Columbia University School of Engineering and Applied Science, New York, NY, United States
Synopsis
Multiple sclerosis (MS) is an autoimmune disease that damages the central nervous system and affects an estimated 2.3 million people worldwide. One potential key to understanding MS is investigating the metabolic distinctions between its relapsing-remitting (RR-MS) and progressive courses (P-MS). We obtained single-voxel metabolic 1H spectra at 7 Tesla from the frontal cortex of RR-MS and P-MS patients and controls to explore the effects of disease state on concentrations of brain metabolites like glutathione, GABA, glutamate, and N-acetyl aspartate (NAA). Our results suggest an age- and disease-related decrease in glutamate, as well as a disease-related decrease in NAA, in patients with P-MS relative to RR-MS and controls without MS. No disease-related changes in GSH or GABA were found. Our data underscore the importance of continued investigation into the potential physiological distinctions among various MS subtypes.
Purpose
Multiple sclerosis (MS) is an autoimmune disease that damages the central nervous system. Though MS affects about 2.3 million people worldwide,1 we possess no cure, in part due to an incomplete understanding of its pathological mechanisms. One potential path to such understanding is investigating the metabolic distinctions between the relapsing-remitting and progressive disease courses. Proton magnetic resonance spectroscopy (1H-MRS) at 7 Tesla can be used to assess these possible differences by noninvasively measuring small molecule concentrations in vivo with greater fidelity than at lower field strengths. We obtained single-voxel metabolic 1H spectra at 7 Tesla from the frontal cortex of relapsing-remitting (RR-MS) and progressive (P-MS) patients and controls to explore the effects of disease state on brain metabolite concentrations. Analytic foci included glutathione (GSH), an antioxidant synthesized by neurons and especially astrocytes;2 γ-aminobutyric acid (GABA), a neurotransmitter reported to ameliorate autoimmune central nervous inflammation in a mouse model3 and exhibit reductions in P-MS sensorimotor cortex;4 and glutamate, a key player in cell death by excitotoxicity.5 nooOther small molecules, including N-acetyl aspartate (NAA), an amino acid derivative found at high concentrations in brain cells,6 were also assessed.Methods
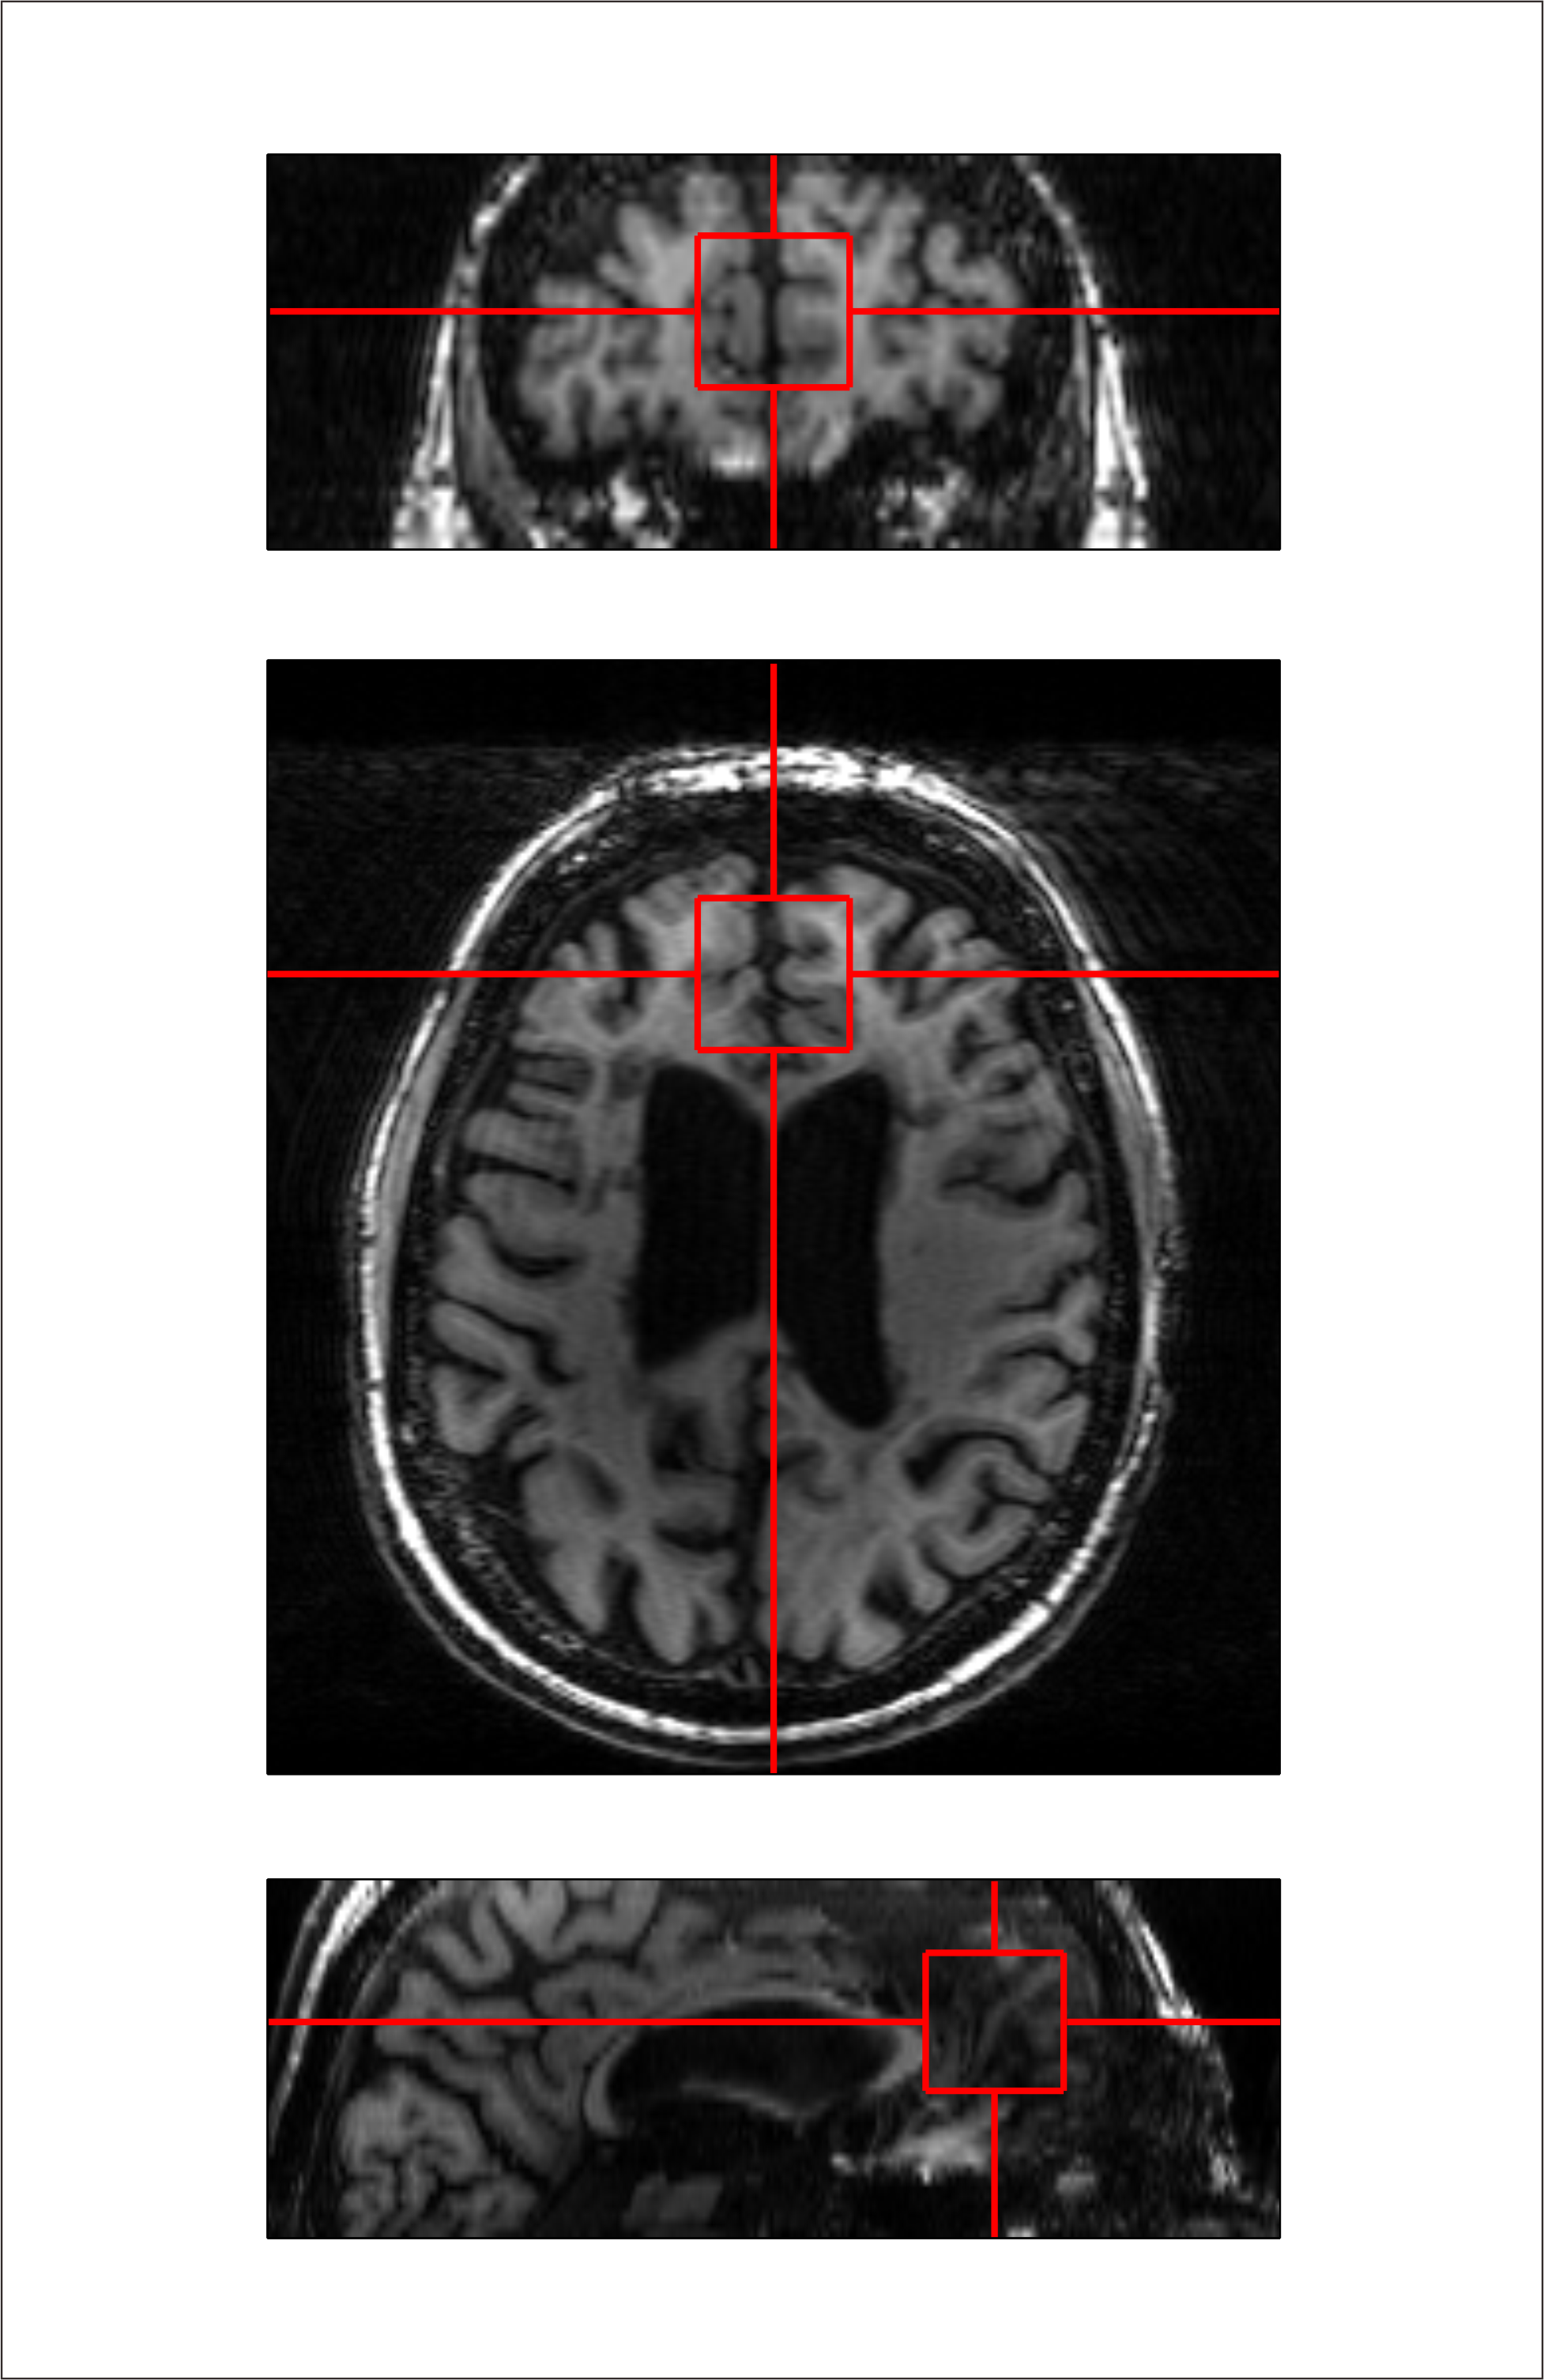
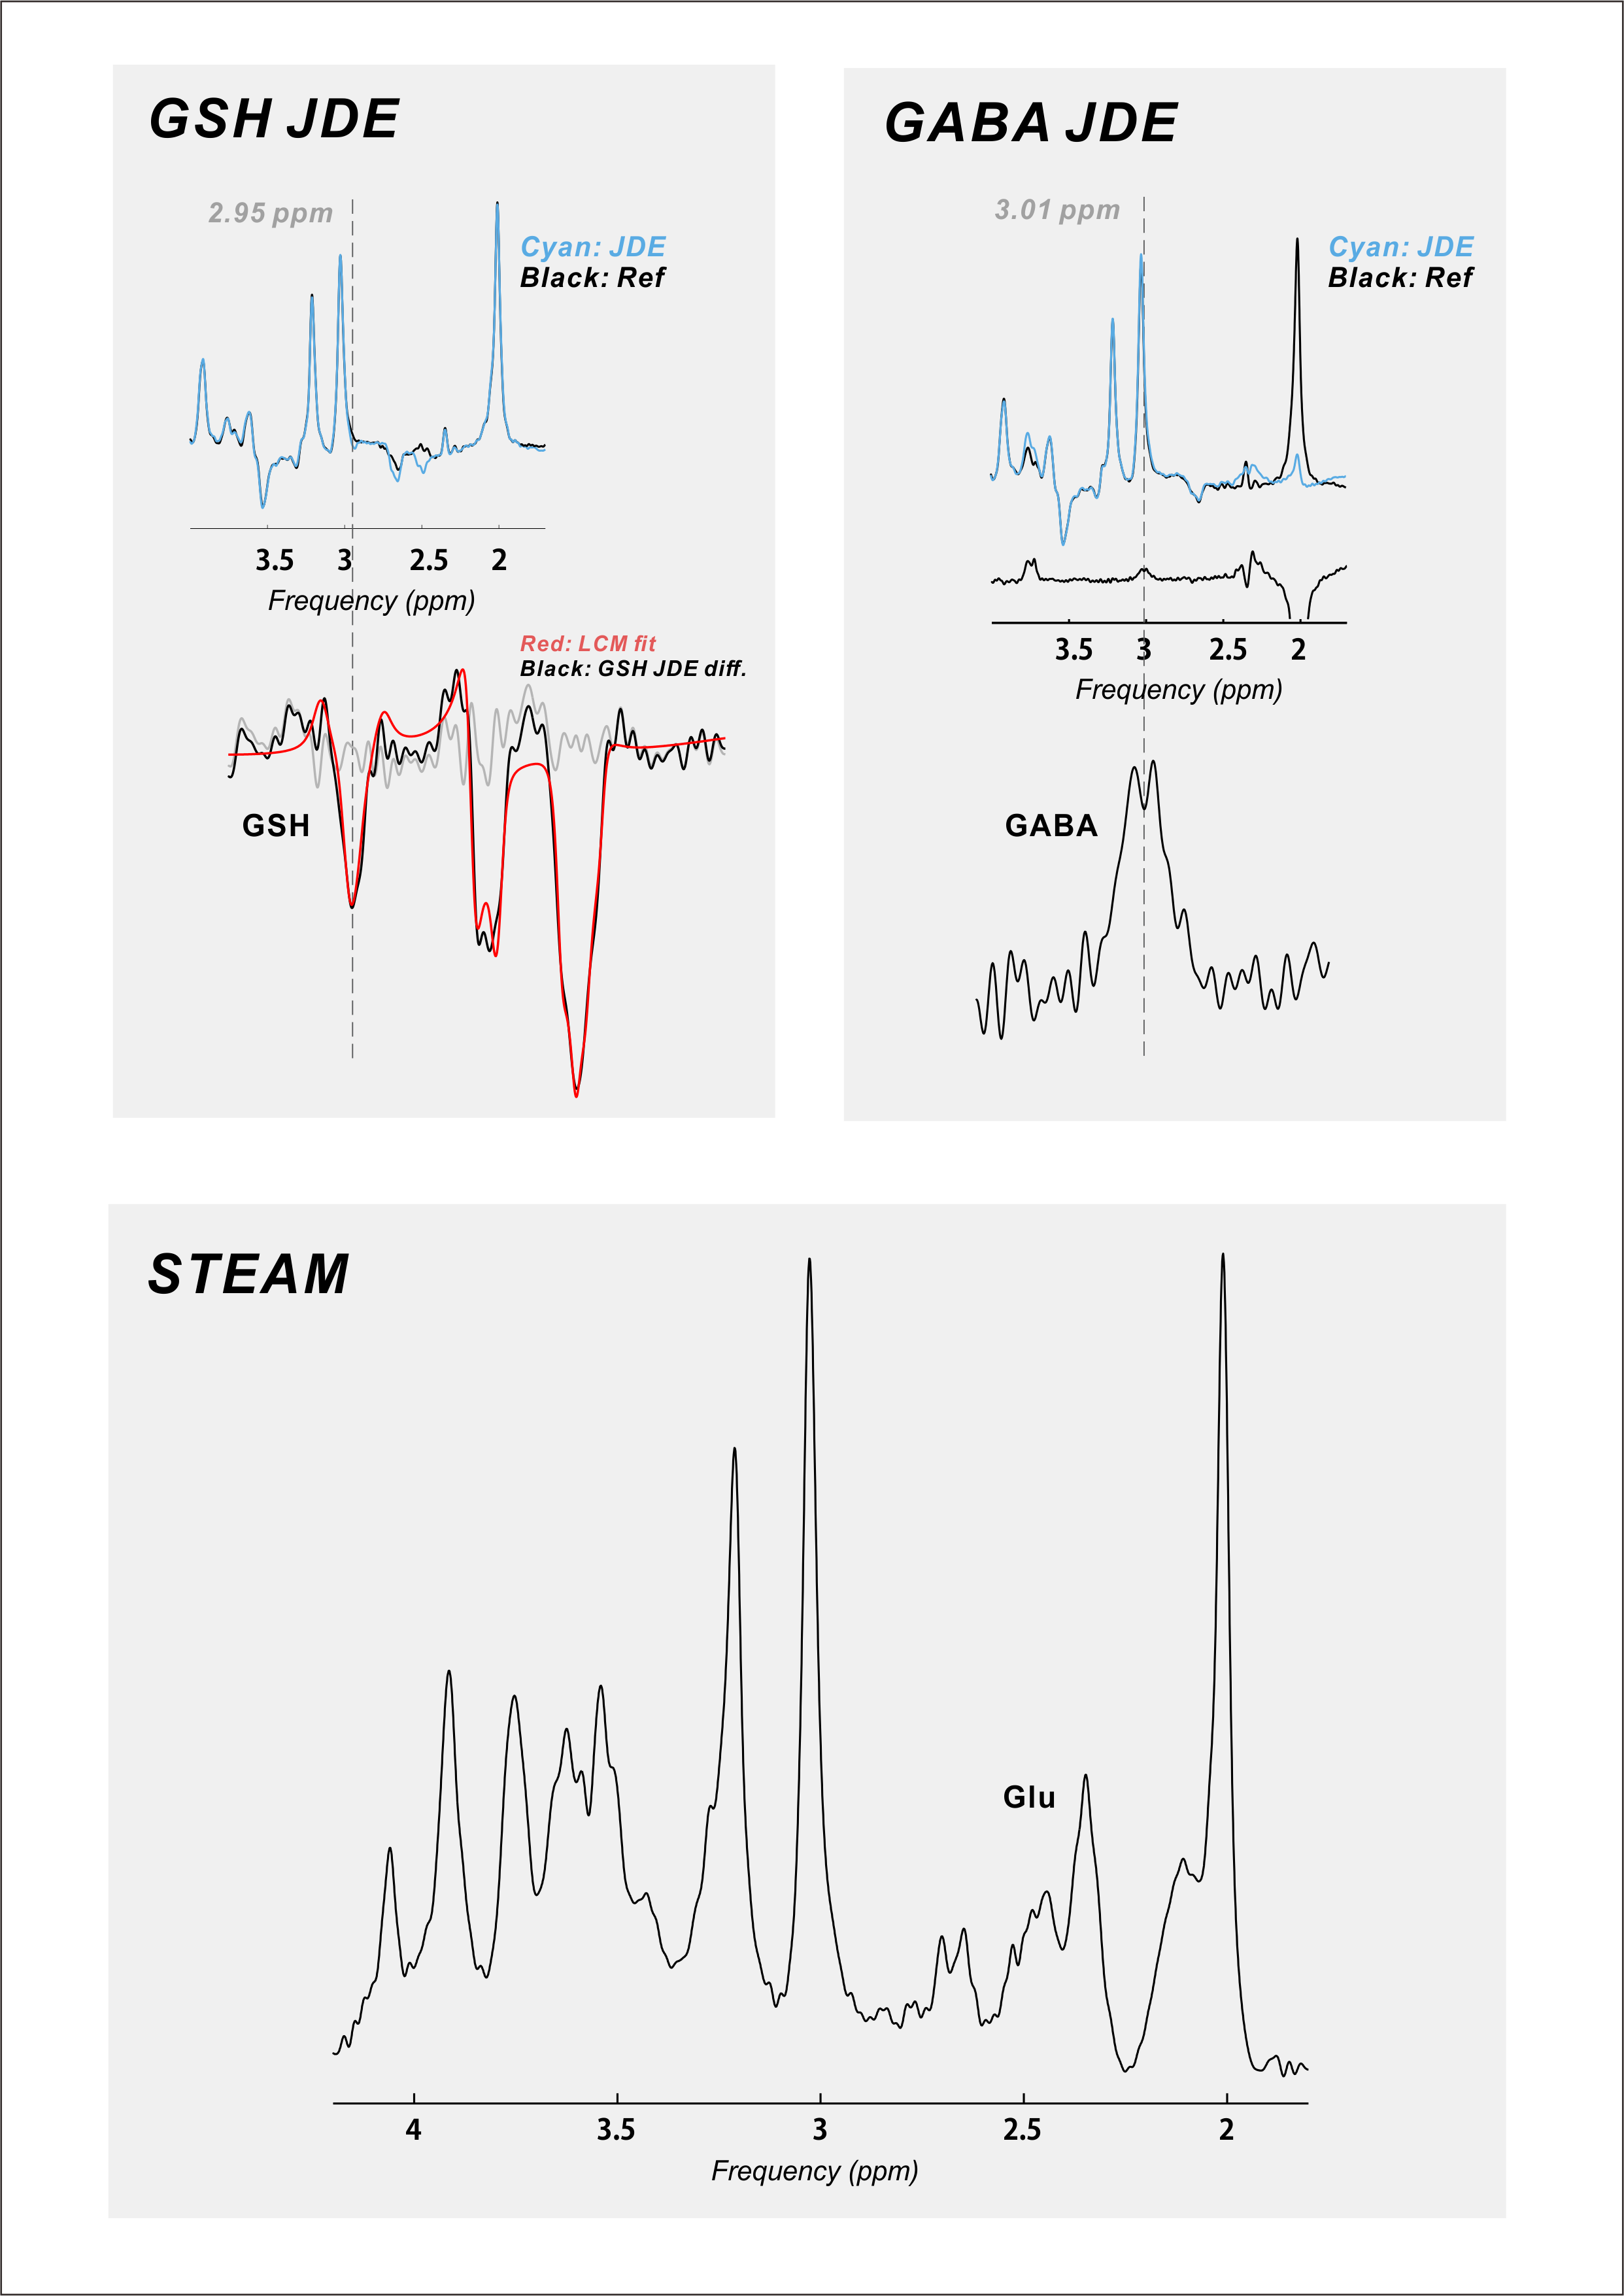
Twenty-six (18 female; mean ± S.E.M. 44 ± 2.5 y.o.) RR-MS patients, 21 (12 female; 55 ± 1.7 y.o.) P-MS patients, and 25 (12 female; 43 ± 3.0 y.o.) controls without MS were examined in a 1-hour session with a 7-Tesla MR scanner (Varian Medical Systems, Inc., Palo Alto, CA, USA) with an eight-channel transceiving radiofrequency coil. A single 27-cc cubic voxel was placed at the longitudinal fissure in medial prefrontal cortex following T1-weighted imaging (Figure 1) with spherical harmonics shimming applied as described previously.7 Metabolites were examined using macromolecule-suppressed STEAM (TE 10 ms, TM 50 ms, TR 3000 ms, NR 32) or semi-LASER (TE 72 ms, TR 3000 ms, NR 60) with J-difference editing for GSH or GABA (Figure 2). Spectral data were anonymized using a routine written in MATLAB (MathWorks, Natick, MA, USA) to enable blind alignment, processing, and metabolite quantification with custom software (INSPECTOR).7 Relative metabolite concentrations were estimated by linear combination model fitting in INSPECTOR with basis sets of up to 16 different metabolites simulated in NMRWizard8 using published chemical shift and coupling parameters.9 Group differences in metabolite concentrations relative to 10 mM total creatine (tCr) were calculated in SPSS 20 (IBM, Armonk, NY) with α = 0.05.
Results
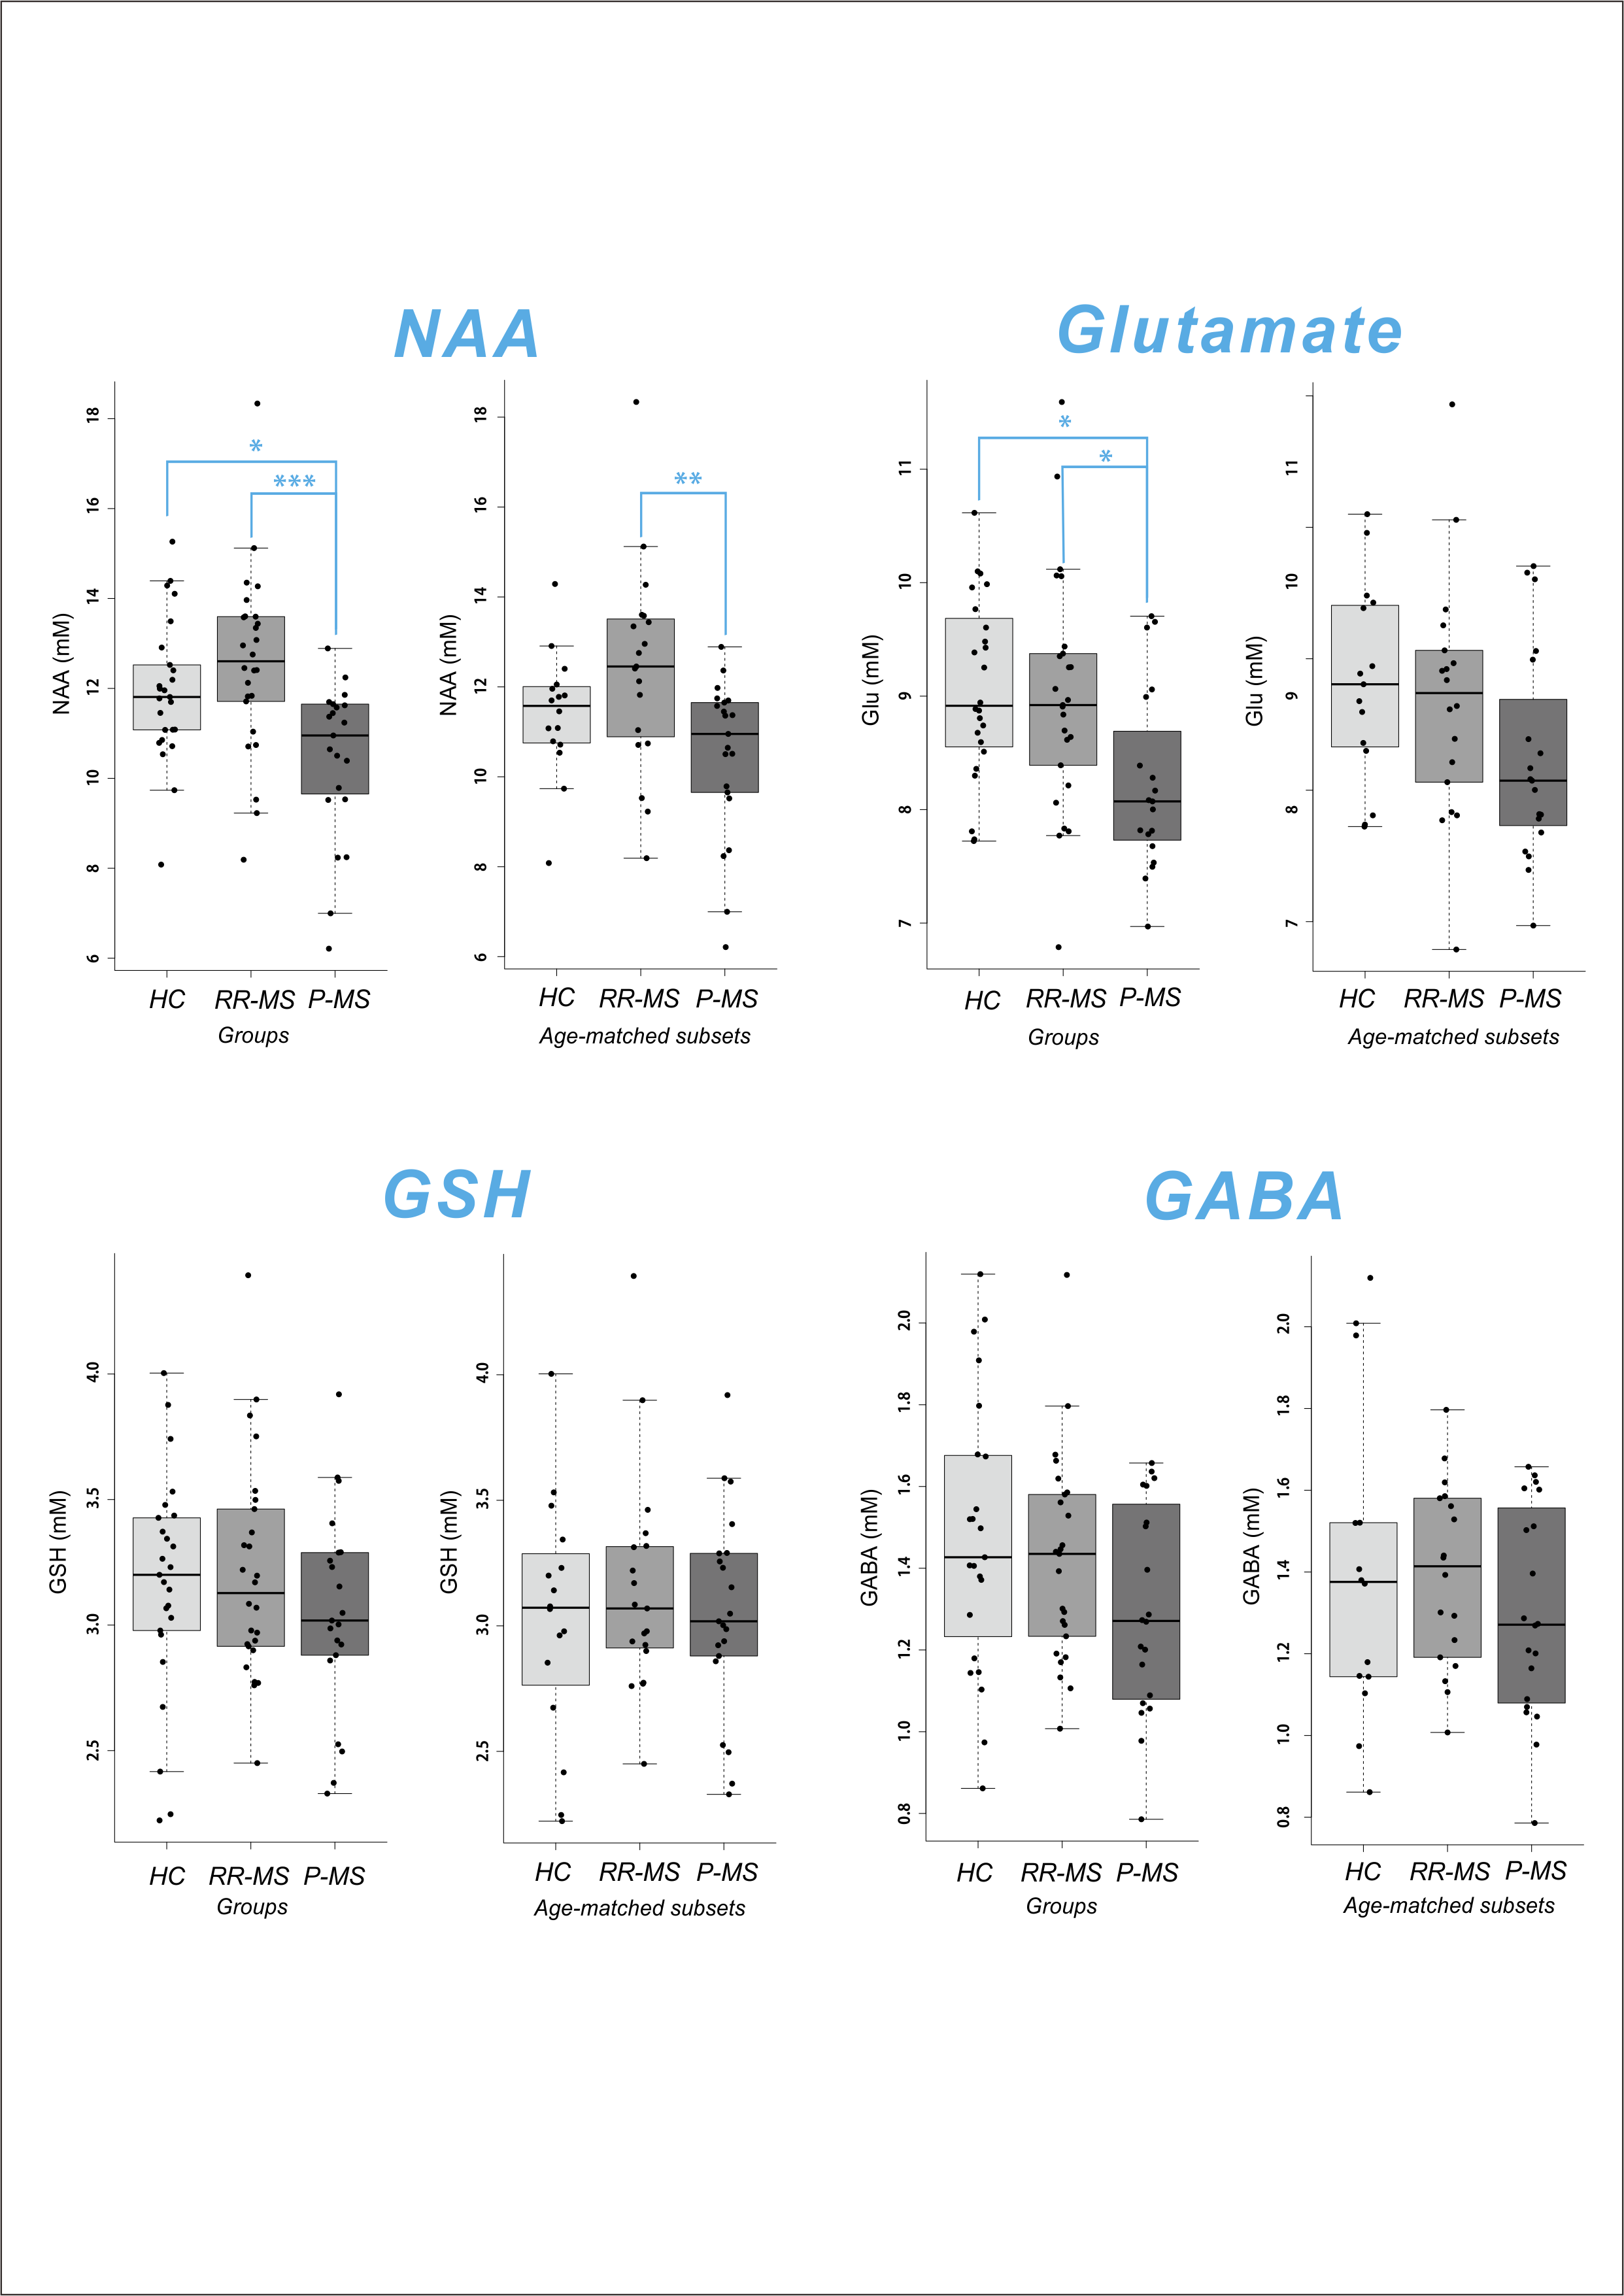
GSH was quantified in all 72 subjects; GABA and glutamate, in 68/72. Cramer-Rao Lower Bounds (CRLB) on concentration estimates of GSH, GABA, NAA, and glutamate were < 5% for all quantified cases. Meaningful quantification was also achieved for total choline, glutamine, glycine, and myoinositol (data not shown). Shapiro-Wilkes statistics confirmed the normality of all groups to which parametric tests were applied. One-way ANOVA or Kruskal-Wallis test demonstrated a significant effect of disease state on relative NAA (F2,69 = 8.175, p = 0.001) and glutamate (F2,65 = 5.429, p = 0.007) but not GABA or GSH. Post-hoc mean difference calculation with Sidak correction demonstrated reduced NAA and glutamate in P-MS relative to control (NAA -1.4801, p = 0.022; glutamate -0.8308, p = 0.011) and RR-MS (NAA -2.1103, p < 0.001; glutamate -0.7615, p = 0.020) groups. Groupwise differences in NAA were replicated across both semi-LASER sequences (GABA data not shown). To eliminate age differences among groups, all tests were repeated on only participants > 35 y.o., age-matching the P-MS group with new control (N = 16; 9 female; 52 ± 2.6 y.o.) and RR-MS (N = 19; 13 female; 50 ± 2.4 y.o.) subsets. Among age-matched groups, one-way ANOVA or Kruskal-Wallis test demonstrated a significant effect of disease state on relative NAA (F2,56 = 5.426, p = 0.007) but not glutamate, GABA, or GSH. Post-hoc mean difference calculation with Sidak correction demonstrated reduced NAA in P-MS relative to RR-MS (NAA -1.9518, p = 0.005) groups (Figure 3).Conclusions
Our data suggest an age- and disease-related decrease in glutamate, as well as a disease-related decrease in NAA, in patients with P-MS relative to RR-MS and control. These findings dovetail with a previous report of reduced NAA in P-MS relative to RR-MS in normal-appearing brain10 and may reflect a pathological mechanism involving the dysfunction or loss of disproportionately NAA-producing cells. No disease-related changes in GSH were found, and our null effect of disease state on relative GABA concentrations bolsters an earlier report of no difference in prefrontal GABA concentrations between P-MS patients and controls.6 Whether the same trends manifest following absolute quantification relative to estimated water concentrations in the segmented voxel remains to be seen.
Acknowledgements
Special thanks are due to Ms. Yvette Strong at the Yale Center for Clinical Investigation and the nursing staff at the Yale-New Haven Hospital Interventional Immunology Clinic for their invaluable help in patient recruitment. This research was made possible by the National Multiple Sclerosis Society (NMSS) grant “In Vivo Metabolomics of Oxidative Stress with 7 Tesla Magnetic Resonance Spectroscopy“ (RG 4319) and falls within the purview of Yale Medical School Human Investigation Committee protocol #1107008743.References
1. Browne P, Chandraratna D, Angood C, Tremlett H, Baker C, Taylor BV, Thompson AJ. Atlas of Multiple Sclerosis 2013: A growing global problem with widespread inequity. Neurology 2014; 83(11): 1022-24.
2. Carvalho AN, Lim JL, Nijland PG, Witte ME, Van Horssen J. Glutathione in multiple sclerosis: more than just an antioxidant? Mult Scler 2014; 20(11): 1425-31.
3. Bhat R, Axtell R, Mitra A, Lock C, Tsien RW, Steinman L. Inhibitory role for GABA in autoimmune inflammation. PNAS 2010; 107(6): 2580-85.
4. Cawley N, Solansky BS, Muhlert N, Tur C, Edden RA, Wheeler-Kingshott CA, Miller DH, Thompson AJ, Ciccarelli O. Reduced gamma-aminobutyric acid concentration is associated with physical disability in progressive multiple sclerosis. Brain 2015; 138(9): 2584-95.
5. Kostic M, Zivkovic N, Stojanovic I. Multiple sclerosis and glutamate excitotoxicity. Rev Neurosci 2013; 24(1): 71-88.
6. de Graaf RA. Magnetic Resonance Spectroscopy, C.J. Stagg and D. Rothman, eds. (Elsevier, London, 2014), p. 40.
7. Prinsen H, de Graaf RA, Mason GF, Pelletier D, Juchem C. Reproducibility measurement of glutathione, GABA, and glutamate: Towards in vivo neurochemical profiling of multiple sclerosis with MR spectroscopy at 7T. JMRI 2016; e-publication ahead of print.
8. de Graaf RA, Chowdhury GMI, Behar KL. Quantification of high-resolution 1H NMR spectra from rat brain extracts. Anal Chem 2011; 83(1): 216-24.
9. Govindaraju V, Young K, Maudsley AA. Proton NMR chemical shifts and coupling constants for brain metabolites. NMR in Biomedicine 2000; 13(3): 129-153.
10. Falini A, Calabrese G, Filippi M. Benign versus secondary-progressive multiple sclerosis: the potential role of proton MR spectroscopy in defining the nature of disability. AJNR Am J Neuroradiol 1998; 19(2): 223–9.
Figures