2969
Assessment of Response to Radiation Therapy Using High-Resolution Proton MRSI in Soft Tissue Sarcoma Patients1Gordon Center for Medical Imaging, Radiology, Massachusetts General Hospital, Harvard Medical School, Boston, MA, United States, 2Radiation Oncology, Massachusetts General Hospital, Harvard Medical School, Boston, MA, United States, 3Pathology, Massachusetts General Hospital, Harvard Medical School, Boston, MA, United States, 4Nuclear Medicine, West China Hospital, Sichuan University, Chengdu, People's Republic of China
Synopsis
As the recent rapid development of radiation therapy techniques glowingly facilitate an individualized adaptive radiation therapy (RT), the roles of imaging as a tool to assess the early treatment response to RT or to tailor the treatment volume are becoming important. Conventional structural MR images have limited specificities in delineating and differentiating between residual/recurrent tumor and treatment effects (e.g., edema, inflammation, and radiation necrosis). This work presents a pilot study to assess response to RT in soft tissue sarcoma (STS) patients using a recently proposed rapid high-resolution MRSI method: SPectroscopic Imaging by exploiting spatiospectral CorrElation (SPICE).
Purpose
As the recent rapid development of radiation therapy techniques, e.g., intensity-modulated radiation therapy (IMRT) and intensity-modulated proton therapy (IMPT)1, glowingly facilitate an individualized adaptive radiation therapy (RT), the roles of imaging as a tool to assess the early treatment response to RT or to tailor the treatment volume are becoming important. Conventional structural MR images have limited specificities in delineating and differentiating between residual/recurrent tumor and treatment effects (e.g., edema, inflammation, and radiation necrosis). While proton MRS/MRSI has been shown useful in assessing response to RT2, its practical utility has been limited due to low resolution and long data acquisition time. Recently, a new subspace-based MRSI method, SPectroscopic Imaging by exploiting spatiospectral CorrElation (SPICE)3,4,5,6, has been developed, showing promising capabilities in achieving high-resolution MRSI with good SNR. This work presents a pilot study on assessing response to RT in soft tissue sarcoma (STS) patients using SPICE.Methods
A male patient with STS in the right thigh was recruited (approved by our local IRB). The patient underwent simultaneous 18F-FDG-PET/MR on a commercially available whole-body simultaneous PET/MR scanner (Siemens Biograph mMR, Siemens Healthcare, Erlangen, Germany) after preoperative proton RT. The patient fasted for at least 6 hours before the 18F-FDG injection.
In SPICE acquisition, two complementary 2D MRSI data sets were acquired3,4,5. A low-resolution “training” data set was acquired using a PRESS-CSI sequence with the following imaging parameters: FOV = 240x240mm2, encoding matrix = 16x16(spatial) x 512(spectral), readout bandwidth = 2kHz, slice thickness = 10mm, TE/TR=30/1200ms, acquisition time = 3min, weak water suppression, fat suppression using 4 outer-volume-suppression bands, and elliptical sampling. A high-resolution “imaging” data set was acquired using a PRESS-EPSI sequence with: encoding matrix = 72x72(spatial) x 128(spectral), readout bandwidth = 100kHz, echo spacing = 1.9ms (bipolar acquisition), 8 averages, acquisition time = 12 min. The rest of the imaging parameters of the EPSI acquisition were the same as the CSI acquisition. In SPICE reconstruction, a union-of-subspace based method5,6 was first used to remove the residual water and lipid signals and baseline signals from both the “training” and “imaging” data. The “training” data were then used to estimate the spectral distribution of metabolites (or spectral basis functions), followed by determining the spatial distribution of metabolites (or spatial coefficients) using the “imaging” data3,4,5.
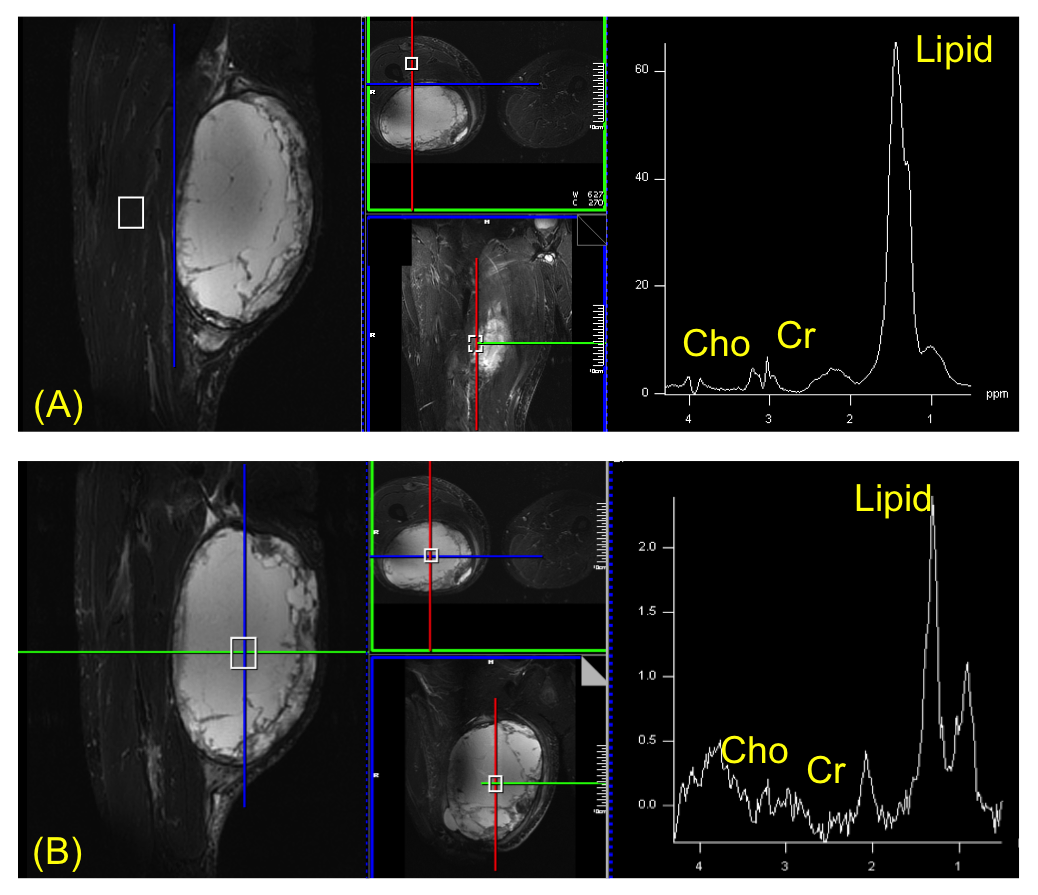
Two single voxel MRS data sets were acquired in the regions of normal tissue and tumor, respectively, with the following parameters: voxel size = 20x20x25mm3, 512 spectral encodings, readout bandwidth = 2kHz, 128 averages, acquisition time = 2.5min. Additional structural MR scans included a GRE based B0 inhomogeneity mapping acquisition and a multi-slice fat suppressed Short-TI Inversion Recovery (STIR) acquisition (30 slices, 1.6x1.6x3.0mm3 resolution). For validation, 7 min PET scan was performed simultaneously. The PET detectors provided 258mm axial FOV and 4.4mm full width at half maximum transverse spatial resolution at 1 cm off the center. PET attenuation correction and reconstruction were performed using the manufacture’s software.
Results
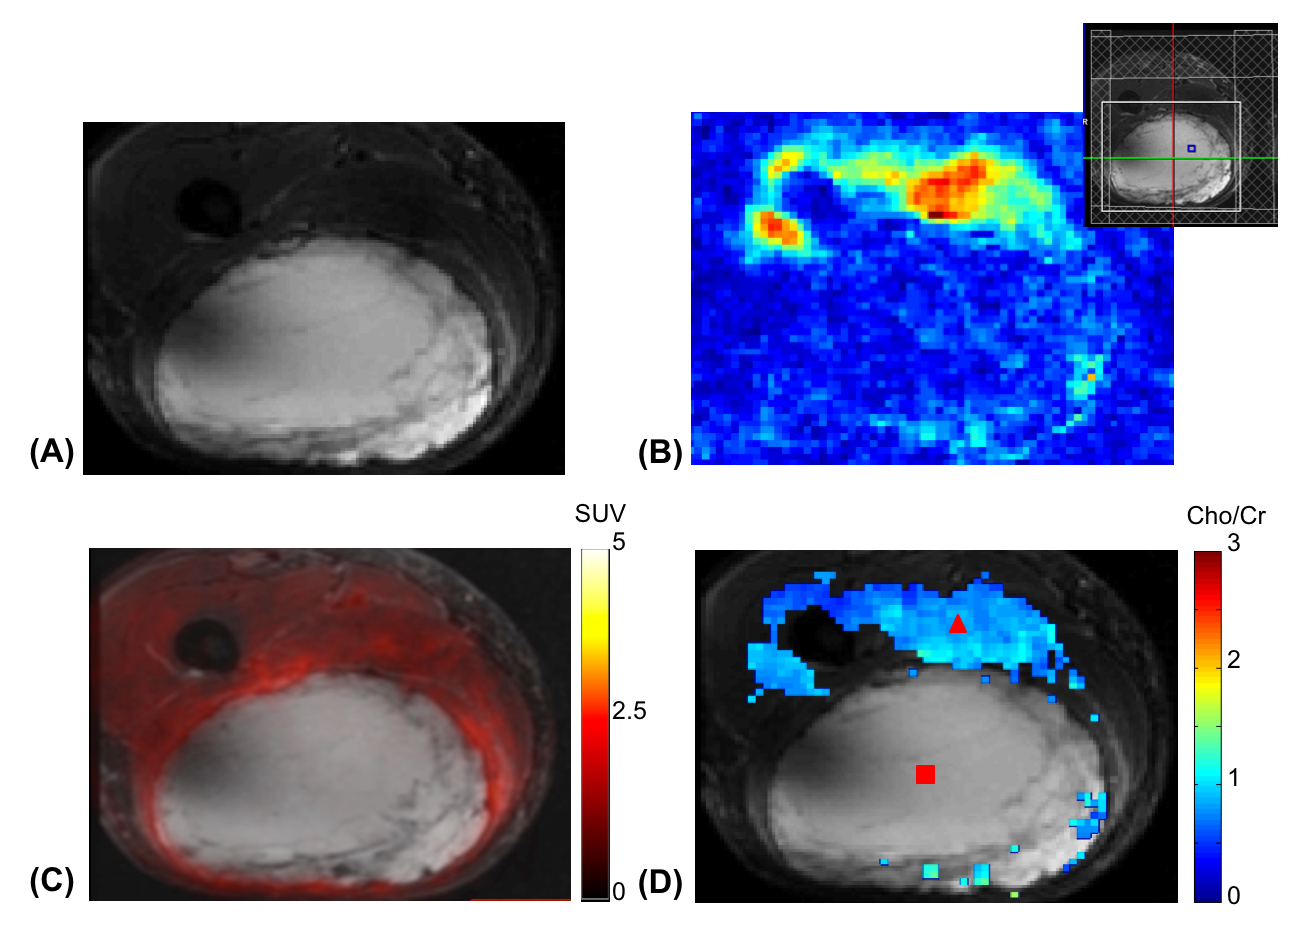
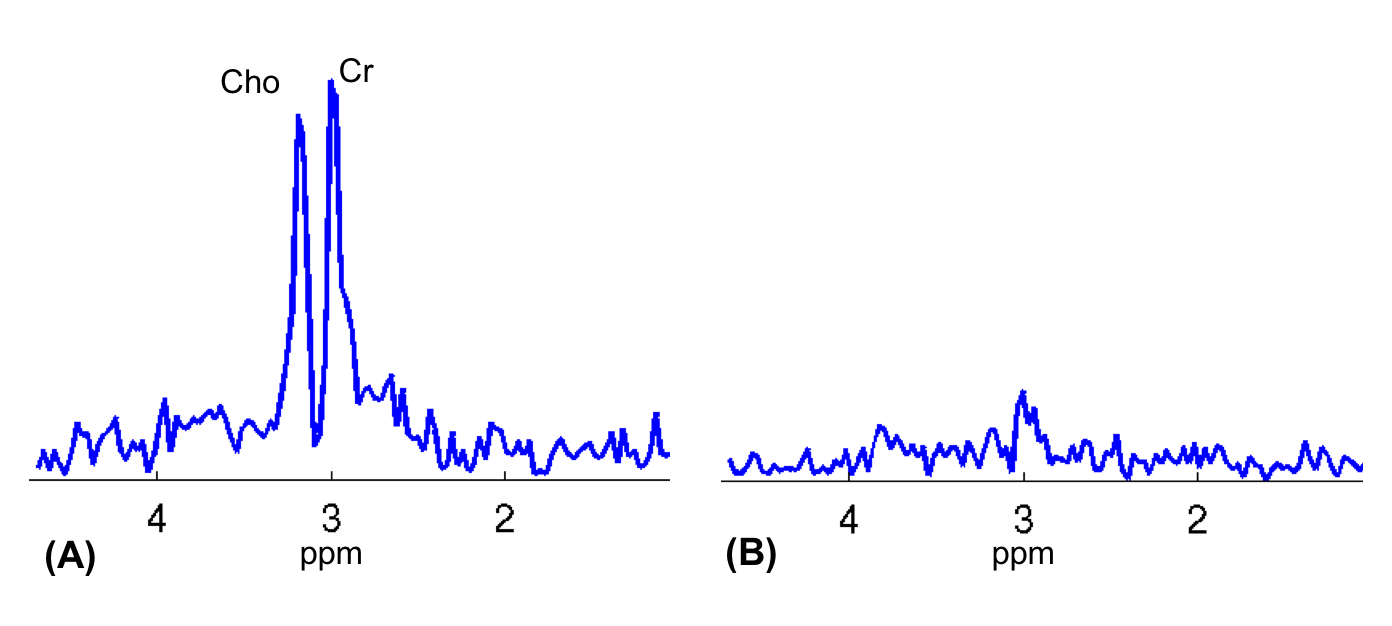
Single voxel spectra are shown in Fig. 1. While Cho and Cr signals were clearly seen in the spectrum from the normal tissue (Fig. 1A) with a ratio close to 1, they were near the noise floor in the spectrum from the tumor (Fig. 1B), indicating necrosis. Figures 2 and 3 show high-resolution MRSI images obtained by SPICE. The total Cho+Cr and Cho/Cr ratio images are shown in Fig. 2B and 2D (fused with the STIR image in Fig. 2A). As can be seen, the total Cho+Cr signals were at the normal level and showing Cho/Cr ratio (~1) of normal tissue outside the tumor region, while the total Cho+Cr signals in the tumor were near the noise floor, showing typical MR spectral signatures of necrosis. Representative spectra from the normal tissue and tumor are shown in Fig. 3, matching well with the single voxel spectra in Fig. 1. The findings from SPICE were consistent with the 18F-FDG-PET results in Fig. 2C. Very low FDG uptakes were shown in the tumor region, indicating no remaining vial tumor after the treatment, while the FDG uptakes outside the tumor were in the normal range (< 3). The pathology results (not shown) of the tissue samples obtained after the patient’s surgery found no residual tumor and more than 90% of the original tumor became necrosis after RT.Conclusions
We performed a pilot study to test the feasibility of using high-resolution MRSI obtained by SPICE to access response to radiation therapy in STS patients. We validated our MRSI results using simultaneously acquired 18F-FDG-PET data and pathology results after surgery.Acknowledgements
This work was support in part by the National Institutes of Health; Grants: R01CA165221 and R21EB021710, and by Federal Share of program income earned by MGH on C06 CA059267.References
1. Delaney TF, Trofimov A. Advanced-technology radiation therapy in the management of bone and soft tissue sarcomas. Cancer control 2005;12:27-35.
2. Zhang X, Chen YL, Lim R, Chuan Huang, Chebib IA, El Fakhri G. Synergistic role of simultaneous PET/MRI-MRS in soft tissue sarcoma metabolism imaging, Magn Reson Imaging 2016;34:276-279.
3. Lam F, Liang ZP. A subspace approach to high-resolution spectroscopic imaging. Magn Reson Med 2014;71:1349–1357.
4. Lam F, Ma C, Clifford B, Johnson CL, Liang ZP. High-Resolution 1H- MRSI of the Brain Using SPICE: data Acquisition and Image Reconstruction. Magn Reson Med 2016;76:1059-1070.
5. Ma C, Lam F, Ning Q, Johnson CL, Liang ZP. High-resolution 1H-MRSI of the brain using short-TE SPICE. Magn Reson Med 2016, doi: 10.1002/mrm.26130.
6. Ma C, Lam F, Johnson CL, Liang ZP. Removal of nuisance signals from limited and sparse 1H MRSI data using a union-of-subspaces model. Magn Reson Med 2016;75:488–497.
Figures