2966
Metabolite levels in hippocampus and temporal lobe using long TE magnetic resonance spectroscopic imaging for epilepsy diagnostics1Radiology and Medical Informatics, University of Geneva, Geneva, Switzerland
Synopsis
The aim of this study is to obtain normative reference 1H-MRSI data on the ratio of total NAA to total Cho in healthy subjects for subsequent use for clinical diagnosis of epileptic patients. Furthermore, we studied the effect of voxel content, primarily white matter and regional gray matter on metabolic levels.
Introduction
Resistant epilepsy is often characterized by normal appearance of structural MRI. It has been shown that 1H-MRS represents a valuable adjunct to detect abnormal parenchyma reflecting gray and white matter dysfunction due to epileptic activity [1,2]. Metabolic changes include decrease of NAA level and moderate increase or unchanged Cho level. In clinical setting, NAA/Cho ratio provides valuable metric to detect epileptic focus and the degree of asymmetry of NAA/Cho between left and right hemispheres may be used to lateralize the epilepsy focus. In the case of mesio-temporal epilepsy, both hippocampus and temporal neocortex are usually sampled. In practice however, NAA/Cho shows important degree of variability. This variability is observed in normal subjects, and may reflect variable tissue content in the region of interest due to difficulties to place the 1H-MRS voxel accurately. In this work, we report data using 1H-MRSI on hippocampus and temporal lobe cortex on healthy subjects looking at the effect of voxel tissue content.Methods
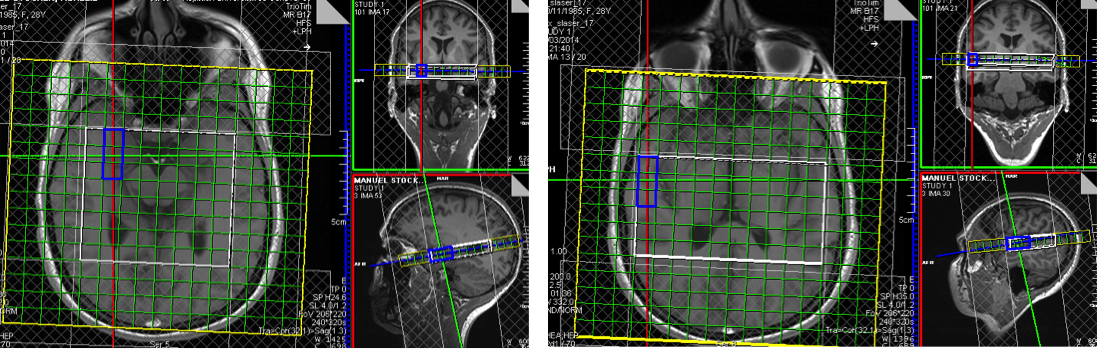
Acquisition. MRI/MRS examination was performed on 20 healthy volunteers at 3T (Siemens TIM-Trio). 1H-MRSI was acquired using semiLASER with 4 outer volume saturation slices. Acquisition parameters were TR 1600ms, TE 288ms, 3 averages, bw 1200 Hz, 1024 data points, matrix 16x16, voxel size of 1.24 cc, weighted sampling, AT 6.88 min (figure 1). The MRSI results were compared with single volume spectroscopy (SVS) obtained using PRESS (TR 2700ms, TE 288ms, 256 averages, AT 7.25 min). MRI protocol consisted of 3D MPRAGE 1mm isotropic acquisition.
Analysis. MRS data were processed with Siemens spectroscopy application. FSL was used to segment MP2RAGE images in subcortical regions. Further labeling of cortical regions was performed by realigning Neuromorphometrics 1.0 atlas [3] on individual MPRAGE images. Realigned labels and subcortical segmentation were fused and aligned on the MRSI slice in order to determine tissue content of individual voxels. General linear model (R-studio) was built in order to express NAA/Cho of voxels containing hippocampus, respectively temporal cortex with respect to different tissue class as follows:
$$\frac{NAA }{Cho_{hip}}=\beta_0+\beta_1\times Hip+\beta_2\times Thal+\beta_3\times GFR+\beta_4\times Temp+\beta_5\times PostCing+\beta_6\times WM $$
$$\frac{NAA }{Cho_{temp}}=\beta_0+\beta_1\times Temp+\beta_2\times Ins+\beta_3\times BG+\beta_4\times Occip+\beta_5\times WM$$
Where Hip=hippocampus, Thal=thalamus, GFR=gyrus fornicatus retrospinal (entorhinal and parahippocampus gyri), Temp=temporal cortex, PostCing=posterior cingulate cortex, Ins=insula, BG=basal ganglia, Occip=occipital cortex and WM=white matter.Results
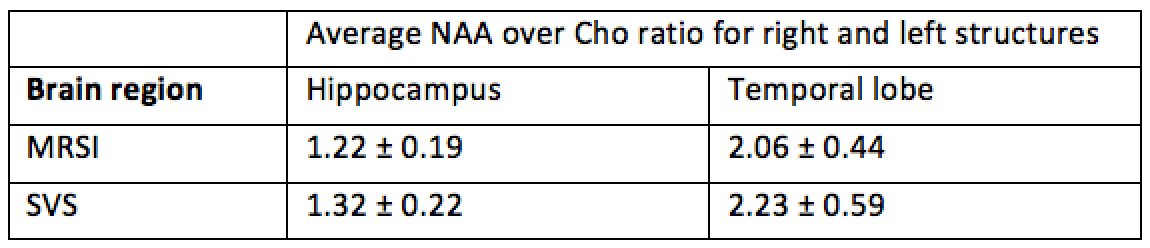
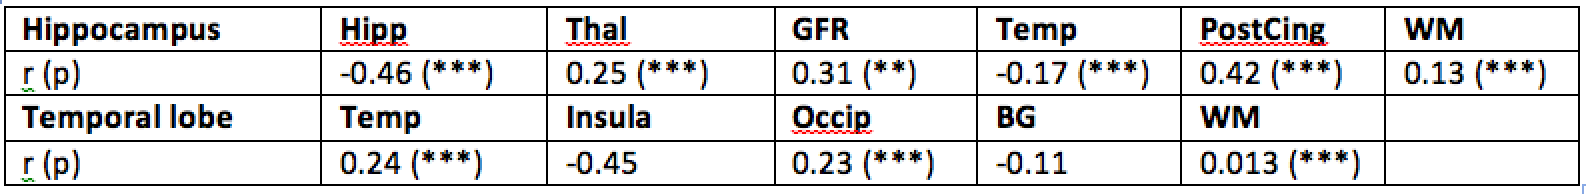
Table 1 shows NAA/Cho ratio of the hippocampus and the temporal cortex by a posteriori averaging hippocampus, resp. temporal lobe voxels (3 voxels) as well as by SVS acquisition. SVS showed systematic higher values and lower precision than MRSI (16.5% vs. 15% for hippocampus and 26.5% vs. 21% for temporal lobe). Temporal lobe showed more variable results that can be explained in part by chemical shift displacement error. Another source of variability comes from tissue content as the linear model demonstrates in tables 2. For the hippocampus, the major source of NAA/Cho variance is the posterior cingulate (r=0.42, p=0.001) followed by GFR (r=0.31, p<0.001). Thalamus has a weak effect (r=0.25, p=0.001), and WM has almost no effect (r=0.13, p=0.001). For the temporal cortex, linear model shows moderate correlation with insula (r=-0.45), but was not statistically significant, weather occipital cortex was only weakly correlated (r=0.23, p=0.001). Of note is the lack of relationship with white matter content (r=0.013, p=0.001).
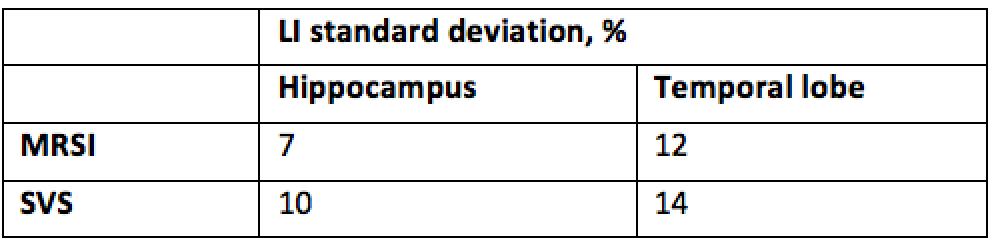
Finally, lateralization index derived from the right vs. left NAA/Cho levels showed also higher variability with SVS than with MRSI acquisition and in temporal lobe than in hippocampus as shown in table 3.
Discussion & Conclusion
Our results demonstrate that a posteriori voxel averaging can replace advantageously SVS acquisition in term of precision. In addition, MRSI is faster and provides direct metabolite comparison between right and left. Variability of NAA/Cho ratio could be partially explained by tissue content. One of the most pronounced effect for the hippocampus was GFR, which contains parahippocampus cortex. Other tissue such as thalamus has also significant effect on metabolite variance. For the temporal cortex, effect of tissue content is less clear. It is quite possible that metabolite distribution within the temporal lobe is highly heterogeneous, which exceeds the effect of other tissue. Further study should segment temporal lobe in smaller sub-regions to clarify this point. Finally, white matter content does not seem to explain the variance observed in mesiotemporal structures. It is quite possible that white matter demonstrates a high degree of heterogeneity, which was not included in our model.Acknowledgements
This work was supported by the Centre for Biomedical Imaging (CIBM) of the Universities and Hospitals of Geneva and Lausanne, and the EPFL.References
1 Connelly et al. Proton magnetic resonance in MRI-negative temporal lobe epilepsy. Neurology (1998) 1:61-66
2 Ng TC et al. Temporal lobe epilepsy: presurgical localizazion with proton chemical shift imaging. Radiology (1994) 2:465-472
3 Maximum probability tissue labels derived from the ``MICCAI 2012 Grand Challenge and Workshop on Multi-Atlas Labeling'' (https://masi.vuse.vanderbilt.edu/workshop2012/index.php/Challenge_Details).
Figures
Table
3: Standard
deviation of lateralization index defined as: $$$ LI = \frac{NAA/Cho_{right}-NAA/Cho_{left} }{NAA/Cho_{right}+NAA/Cho_{left}}\cdot 2$$$