2965
Quantitative Sodium MRI of the Human Kidney at 3T1Radiology, University of Cambridge, Cambridge, United Kingdom, 2University of Cambridge, Cambridge, United Kingdom, 3MR Research Center, Aarhus University, 4Cambridge Institute, Cancer Research UK, 5MRI, Addenbrooke's Hospital, Cambridge, United Kingdom
Synopsis
Imaging of the renal system with sodium MRI has gained interest in the past few years, especially in using the technique to quantify, and assess for, changes in the cortio-medullary sodium gradient.
The main hindrance for previous work has been the lengthy scan time required to obtain sodium images. However, utilizing a 3D cones trajectory, the work presented here shows good detection of the cortio-medullary sodium gradient, in a clinically feasible scan time, in a sample of six healthy controls.
Introduction
The intra-renal osmolality gradient is essential to renal function and as such imaging of the renal sodium handling has previously been performed in both clinical and preclinical MR studies i,ii,iii. Imaging of the cortico-medullary sodium gradient has been shown to allow differentiation of physiological and pathological alterations in relation renal functional and disease changes iii, iv. One limiting factor so far been the length of scan time required to image the fast relaxing quadrupolar 23Na distribution in the kidneys. This work investigates a novel fast and quantitative renal sodium distribution imaging in a clinically acceptable scan time, using a 3D cones trajectory [5].Methods
6 healthy volunteers (mean age 28 +- 4.5 years) were imaged on a 3T GE HDx (GE Healthcare, Waukesha, WI).
Subjects were placed in a supine position in the magnet. Proton images of the kidneys were acquired with an 8 channel abdominal array coil. T1 and T2 FLAIR weighted images were collected for image analysis (T1 acquisition: 2mm Slice Thickness, 3.26ms Repetition Time (TR), 1.1ms Echo time (TE), 38cm Field of View (FOV), 288x288 matrix size, Flip Angle (FA) 12 degrees. T2 FLAIR acquisition:2mm slice thickness, TR = 8652ms, Inversion Time = 2250, 2 Averages, 6mm Slice Spacing, 32cm FOV, 256x256 Matrix Size, Flip Angle = 90 degrees).
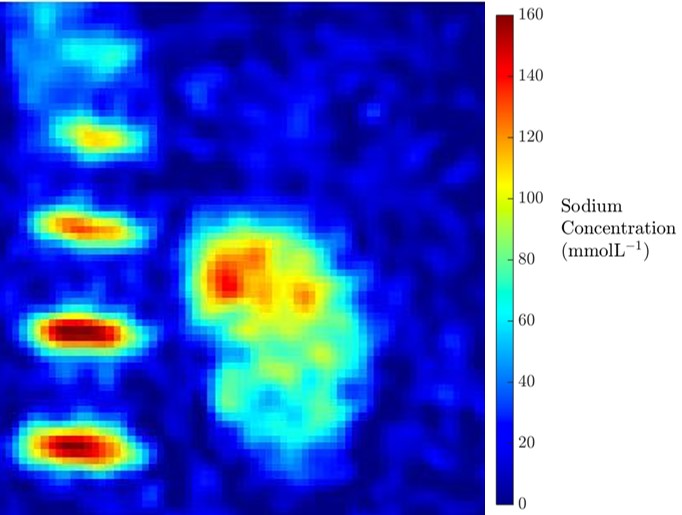
Sodium imaging was performed with two parallel loop coils placed anteriorly and posteriorly over the kidneys. Sodium concentration phantoms of 30mmolL and 80mmolL in 4% agar, were placed inside of the coils’ field of view as concentration calibrants. Imaging was performed using a 500us hard excitation pulse and a 3D cones readout, with scan time taking five minutes in total for the sodium acquisition (Respiratory gated, 24cm FOV, Slice Thickness = 4.5mm interpolated to 2mm, In-plane resolution = 4.5mm2 interpolated to 2mm2, Flip Angle = 90, TE = 0.5ms, TR = 150ms, Number of excitations per average = 197, Number of Averages = 10, Readout length = 30ms).
Sodium concentration maps were created by fitting each voxel against the calibration curve formed by the sodium standards vi. All image analysis was performed in Matlab (The MathWorks, MA). For each volunteer the Medulla, Cortex, and whole kidney regions were segmented by hand, for both kidneys, and the average sodium concentration in the regions, was calculated. Further segmentation of the medulla and cortex was performed per slice as previously described vii.
To test for difference in concentration between segmented regions a two-tailed p-test was performed, with significance defined as p<0.05.
Results
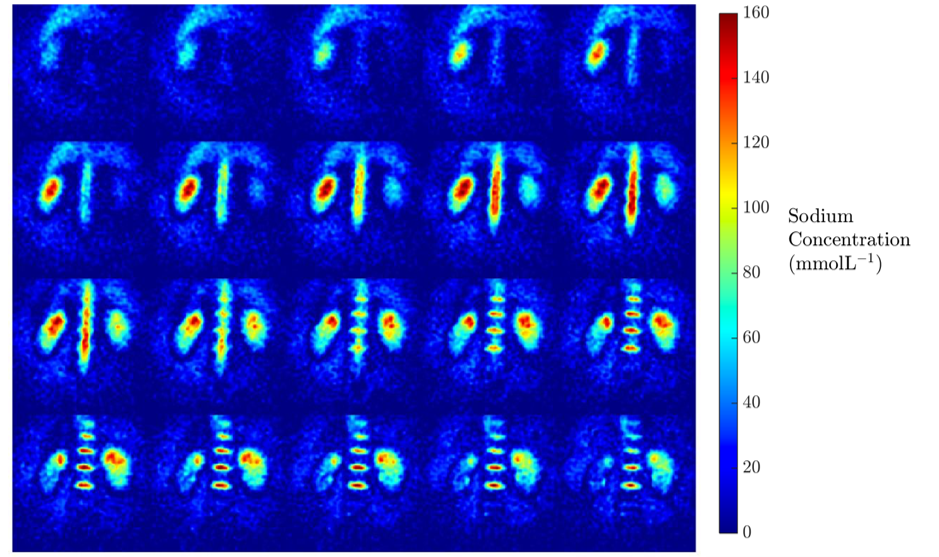
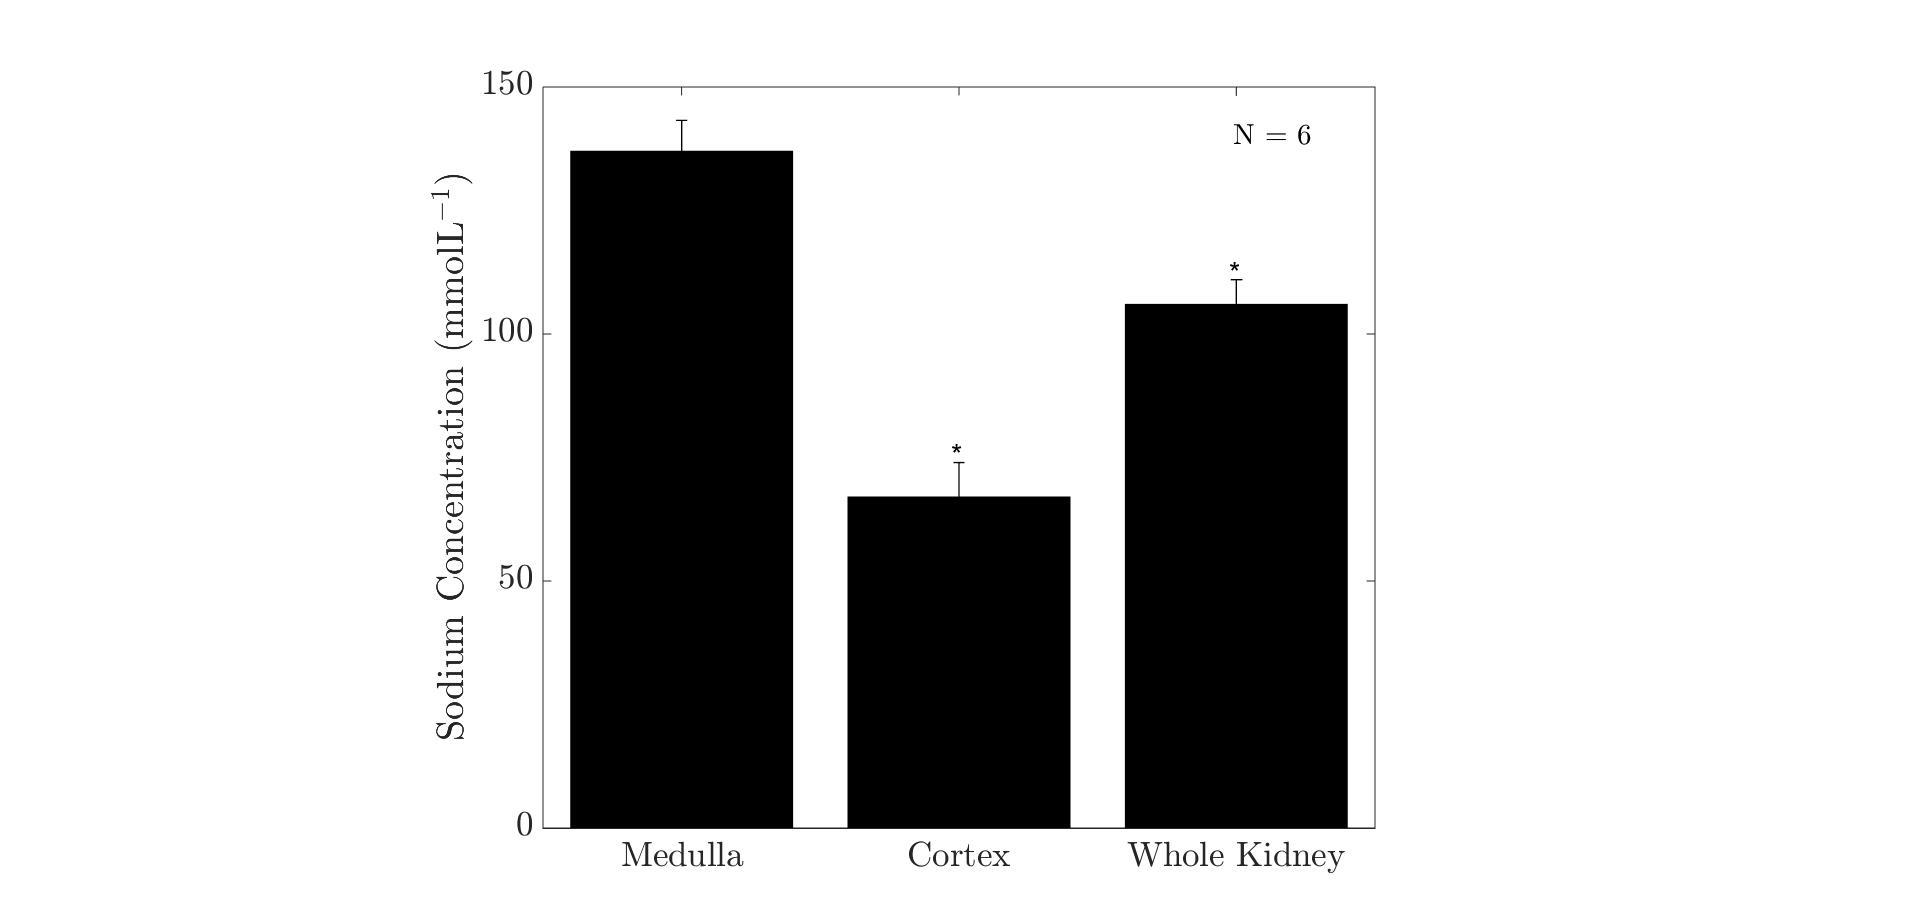
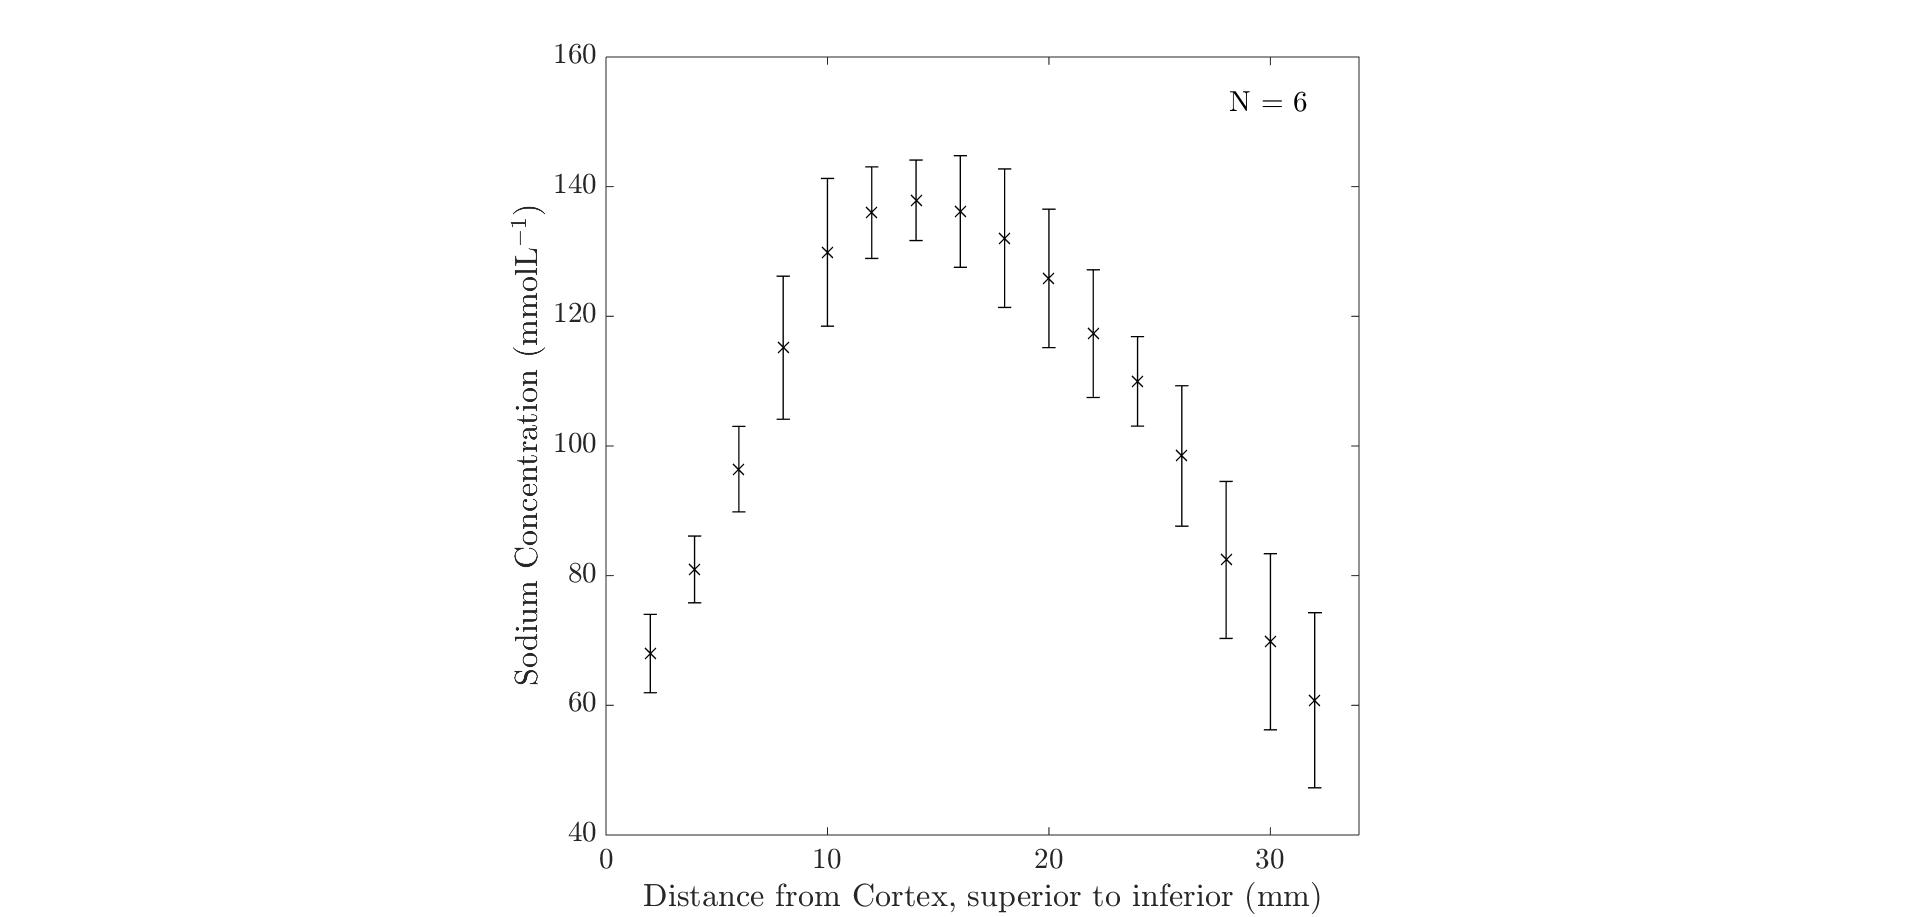
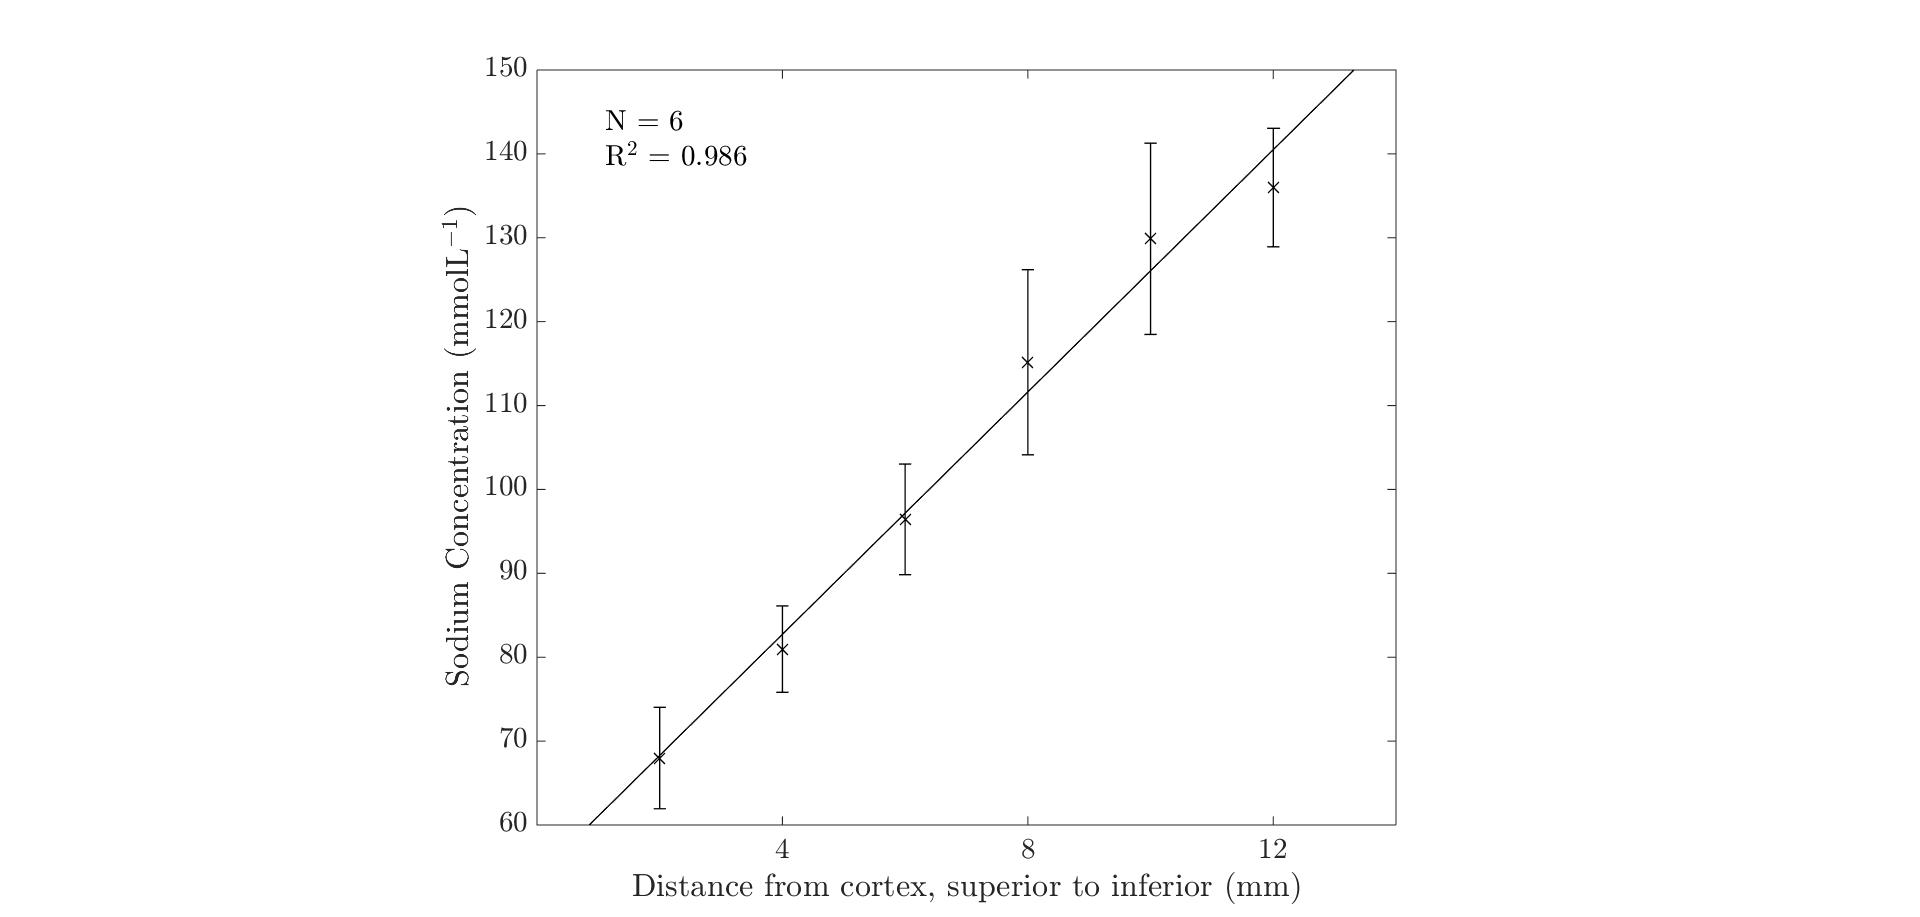
Results from the kidney segmentation can be seen in figures 1, 2, and 3. Figure 1, below, shows the non-interpolated kidney acquired in 5 minutes, with each image processed to produce a sodium concentration map. Figure 2 shows the distinct difference in total sodium concentration between the medulla and cortex (p<0.05). Further analysis showed an increase in sodium concentration in the kidney moving from the cortex to the medulla, shown in figure 3, moving from 68 ± 6 mmolL-1 in the cortex to 135 ± 7 mmolL-1 in the medulla. Fitting a linear model to the data revealed that there is a concentration gradient from the cortex to the medulla, as demonstrated in figure 4. Finally, an example kidney image is seen in figure 5, with two renal pyramids visible.Discussion
The results shown are in line with previously described literature showing a cortico-medullary osmolality gradient from the cortex to medulla in a linear manner in acceptable scan times [5]. The steepness of this gradient has been associated with several functional and pathological states and thus the quantitative sodium concentration gradient assessment support the use for even more detailed investigations of kidney diseases.Conclusion
In conclusion, the study has presented a novel quantitative 3D renal 23Na concentration mapping method for human kidney investigations. Furthermore, this study has shown that a rapid acquisition scan using a 3D cones trajectory allows for acceptable sodium images to be acquired, in a clinically feasible time. Finally, this study presents a baseline from which to perform further study in to pathologies where the cortico-medullary sodium gradient is impaired.Acknowledgements
Funding:This study was supported by Aarhus University.References
i G. Madelin and R. R. Regatte, “Biomedical applications of sodium MRI in vivo.,” J. Magn. Reson. Imaging, vol. 38, no. 3, pp. 511–29, Sep. 2013.
ii N. Maril, R. Margalit, J. Mispelter, and H. Degani, “Sodium magnetic resonance imaging of diuresis: Spatial and kinetic response,” Magn. Reson. Med., vol. 53, no. 3, pp. 545–552, 2005.
iii N. Maril, R. Margalit, J. Mispelter, and H. Degani, “Functional sodium magnetic resonance imaging of the intact rat kidney,” Kidney Int., vol. 65, no. 3, pp. 927–935, 2004.
iv N. Maril, R. Margalit, S. Rosen, S. N. Heyman, and H. Degani, “Detection of evolving acute tubular necrosis with renal 23Na MRI: studies in rats.,” Kidney Int., vol. 69, no. 4, pp. 765–768, 2006.
v F. Riemer, B. S. Solanky, C. Stehning, M. Clemence, C. a M. Wheeler-Kingshott, and X. Golay, “Sodium (23Na) ultra-short echo time imaging in the human brain using a 3D-Cones trajectory,” Magn. Reson. Mater. Physics, Biol. Med., vol. 27, pp. 35–46, 2014.
vi J. D. Christensen, B. J. Barrère, F. E. Boada, J. M. Vevea, and K. R. Thulborn, “Quantitative tissue sodium concentration mapping of normal rat brain,” Magn. Reson. Med., vol. 36, no. 1, pp. 83–89, 1996.
vii N. Maril, Y. Rosen, G. H. Reynolds, A. Ivanishev, L. Ngo, and R. E. Lenkinski, “Sodium MRI of the human kidney at 3 tesla,” Magn. Reson. Med., vol. 56, pp. 1229–1234, 2006.
Figures