2963
Relaxation in Simultaneously Acquired Single and Triple Quantum Filtered Sodium Imaging1Institut of Neuroscience and Medicine - 4, Forschungszentrum Jülich GmbH, Jülich, Germany, 2Department of Neurology, Faculty of Medicine, JARA, RWTH Aachen University, Aachen, Germany
Synopsis
Sodium imaging delivers valuable information about metabolism and disease. The spin dynamics of sodium are significantly impacted by the environment of the nuclei, multiple quantum coherences might develop via the quadrupole interaction. This allows imaging with multi quantum filters (MQF) to achieve weightings towards different sodium compartments. MQF sodium signals are detected with three consecutive RF pulses, by placing a readout train between the first and second RF pulse, a fully quantitative characterisation of relaxation properties in a two-compartment model is possible from measurements within a single sequence.
Purpose
Sodium plays a vital role in metabolism and can be measured non-invasively in vivo via MRI. Metabolic imaging based on the sodium nucleus is of great interest for the scientific and clinical community studying healthy biological processes and pathology. In tissue, sodium is present in different environments, e.g. in intra- and extracellular space. Each compartment has a tightly regulated sodium concentration and significantly different spin dynamics. In an isotropic environment, such as cerebrospinal fluid (CSF), with non-restricted sodium ions, where the correlation time between homogeneously distributed electric field gradients and the sodium quadrupole moment is short, the signal decays monoexponentially with relaxation time Tex. In a restricted environment, sodium relaxes biexponentially with two relaxation constants: fast component T2f, slow component T2s and evolves triple quantum coherences (TQCs) from single quantum coherences (SQCs), if an appropriate sequence is applied.Methods
Two-Compartment Model of The Brain
Brain tissue can be described as a two-compartment model of extracellular sodium relaxing purely monoexponentially and intracellular sodium relaxing biexponentially1. A high single quantum (SQ) weighted signal is expected from CSF in ventricles, vitreous humour, subarachnoid space, and central canal and a high triple quantum (TQ) weighted signal is to be found in tissue, where intracellular signal dominates, i.e. grey and white matter.
Multiple Quantum Filtered Relaxometry
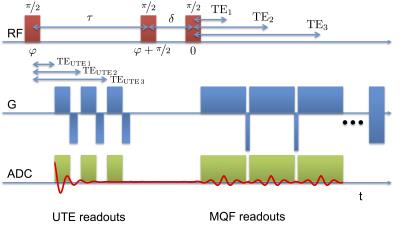
A common method to excite multiple quantum coherences is via a sequence of three pulses, separated by a preparatory time τ and mixing time δ. This, paired with the appropriate multiplex phase cycling2, allows the signal from multiple quantum (MQ) coherences to be separated. It has been shown that an additional UTE readout can be placed after the first pulse to give information on the total sodium distribution3. In order to quantify the relaxation characteristics of different sodium compartments, i.e. Tex, T2s, T2f as well as intra-/extracellular sodium concentration and intracellular sodium molar fraction can be measured within a single sequence. By placing a “UTE” readout train after the first RF pulse, information in particular on the fast relaxation component can be obtained simultaneously, otherwise requiring additional measurements (Fig. 1). Imposing the relationship between the SQ and TQ signals allows the set of signal equations to be solved for the relevant relaxation rates and concentrations.
Experimental Conditions and Measurement Parameters
Phantom experiments were carried out on a custom 4T Siemens scanner with a dual tuned Na/H birdcage coil (Rapid Biomedical, Germany), using a 320x240x160cm3 field of view with 1cm isotropic resolution. A 12 step phase cycle was implemented with 2 averages and a repetition time of TR=150ms yielding a measurement time of approx. 22min. A preparatory time τ=7000µs allows for a “UTE” readout train consisting of 5 radial acquisitions with a base resolution of 22 and bandwidth of 1kHz/pixel sampled at TEute= 0.36ms; 1.75ms; 3.14ms; 4.53ms; 5.92ms. DISCOBALL4 was used as a radial acquisition scheme, mixing time δ was 40 µs. MQ filtered images were acquired using Cartesian sampling of monopolar gradient echoes (mGRE) at 5.92ms; 15.10ms; 25.32ms; 34.48ms; 43.64ms; 52.80ms after the third RF pulse using a bandwith of 120Hz/pixel. Subjects were measured on the same scanner with the similar parameters, after informed consent was granted.
Results
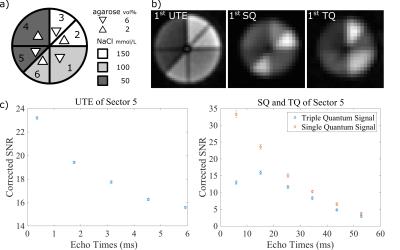
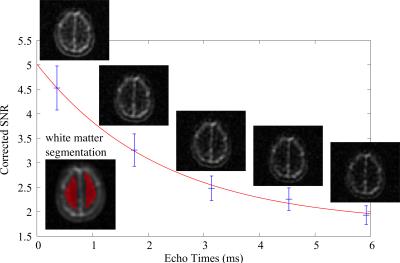
Phantom measurements of a segmented cylinder holding different concentrations of NaCl and agarose demonstrate well the performance of the sequence. Fig. 2 shows the first UTE, SQ and TQ images and the corresponding signal relaxation, each compartment has its own characteristic relaxation dynamics. An example in vivo measurement of a healthy volunteer can be seen in Fig. 3. The images from the “UTE” readout train are segmented manually to isolate the white matter contribution. In this case a value of 2.24±0.31ms can be deduced for the fast relaxation rate T2f in white matter, which compares well to what is reported in literature5.Conclusion
Intra-/extracellular relaxation can be successfully characterised and quantified in a single MQ filtered sequence in a clinically relevant time frame. Since the initial readout train effectively persists during most of the preparatory time, the data acquisition makes best possible use of time, which would otherwise be scanner dead time, thus increasing the effective data yield of the sequence significantly. Also, the method is, due to its nature, less effected by B0 and B1 inhomogeneity compared to methods solely based on phase cycling and mGRE readout after the third RF pulse.Acknowledgements
The authors express their sincere gratitude to Nadine Rosen, Johannes Lindemeyer, Klaus Möllenhoff and Nuno Da Silva for their kind support.References
1. Woessner DE. NMR relaxation of spin-3/2 nuclei: Effects of structure, order, and dynamics in aqueous heterogeneous systems. Concepts Magn Reson. 2001; 13(5):294–325.
2. Ivchenko N et al. Multiplex Phase Cycling. J Magn Reson Imaging. 2003; 160:52–58.
3. Fiege DP et al. Simultaneous Single-Quantum and Triple-Quantum-Filtered MRI of 23Na (SISTINA). Magn Reson Med. 2013; 69:1691–1696.
4. Stirnberg R et al. A new and versatile gradient encoding scheme for DTI: a direct comparison with the Jones scheme. Proc Int Soc Mag Reson Med. 2009; 17:3574.
5. Bartha R et al. Long component time constant of 23Na T2* image relaxation in healthy human brain. Magn Reson Med. 2004; 52(2):407–410.
Figures


