2962
Influences of MRI proton contrast agent on sodium MRI at clinical 3T field strengths1Computer Assisted Clinical Medicine, Medical Faculty Mannheim, Heidelberg University, Mannheim, Germany
Synopsis
Sodium MRI enables to measure tissue sodium content (TSC) non-invasively, which provides additional cellular information and can serve as biomarker e.g. for tumor imaging. Thus, sodium imaging can complement standard clinical protocols. Many clinical routine protocols include perfusion scans with proton contrast agents but the influences on sodium relaxation times and therefore quantification accuracies of TSC are unknown. Our preliminary results showed no significant changes in sodium T1 and only small reductions of T2 with clinically relevant concentrations of contrast agents. Therefore, proton contrast agents are not expected to influence the TSC quantification in UTE sodium sequences.
Purpose
Sodium MRI enables to measure tissue sodium content (TSC) non-invasively and can thus provide additional cellular information complementing standard clinical MR protocols1,2. Many clinical routine protocols include perfusion scans with a waiting time of up to 20 min in between to obtain an early and late enhancement contrast e.g. in liver or cardiac MRI3. This idle time could be used to acquire sodium MR images. However, clinical contrast agents are designed for proton MRI and the influences of remaining contrast agent in blood and tissue on sodium imaging is unknown. This study investigates the quantitative changes due to contrast agents in image parameters T1 and T2 and evaluate whether absolute quantification of TSC will still be possible.Materials and Methods
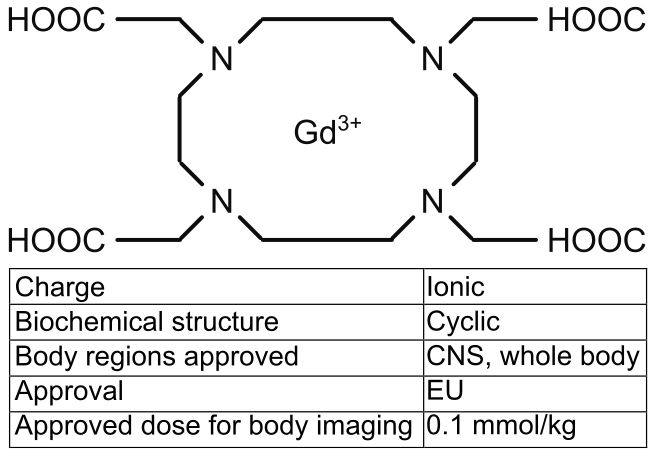
We investigated the gadoterate meglumine-based contrast agent Dotarem® (0.5 mmol/ml, Guerbet, France) which is a frequently used proton MR contrast agent for abdominal applications. Dotarem® is a gadolinium chelate with a macrocyclic biochemical structure and an ionic charge of 3+ (Fig. 1)4. Gadolinium is a paramagnetic ion with seven unpaired electrons in the F-shell, resulting in shorter proton MR relaxation times.
In patient examinations, the contrast agent is administered intravenously with a clinical dose of 0.1 mmol/kg for abdominal examinations4. Assuming blood pool volume and organ weights of a standard man (total mass 70 kg)5, 0.9 mmol/L to 1.3 mmol/L contrast agent would approximately concentrate in the blood pool, liver, kidney and spleen after a uniform distribution6.
Twelve samples of saline solution with contrast agent concentrations ranging from 0.0 mmol/L to 5.2 mmol/L were tested during this study. MR proton imaging was performed on a 3T whole-body scanner (Magnetom Skyra, Siemens, Germany) with a 16-channel body-coil using turbo spin echo sequences. For T1 and T2 measurements, inversion recovery pulses with varying inversion times (TI) and different echo times (TE) were included, respectively. MR sodium imaging at a 3T whole-body scanner (Magnetom Trio, Siemens, Germany) with a dual-tuned birdcage head-coil (Rapid Biomedical GmbH, Germany) was conducted with a 2D UTE sequence7 with inversion recovery pulse and several TIs and a 3D UTE sequence8 with spin echo pulses and several TEs (for all sequence parameters and fits see Fig. 2).
A possible signal reduction in a UTE sodium sequence with large TR for quantification ( $$$S\sim\exp\left(\begin{array}{c}-\frac{TE}{T_2}\end{array}\right)$$$) can be estimated as follows (acquisitions with contrast agent (CA) and without (noCA)):
$$\Delta S=1-\frac{S_{\text{CA}}}{S_{\text{noCA}}}=1-\frac{\exp\left(\begin{array}{c}-\frac{TE}{T_{2\text{CA}}}\end{array}\right)}{\exp\left(\begin{array}{c}-\frac{TE}{T_{2\text{noCA}}}\end{array}\right)}$$
Results
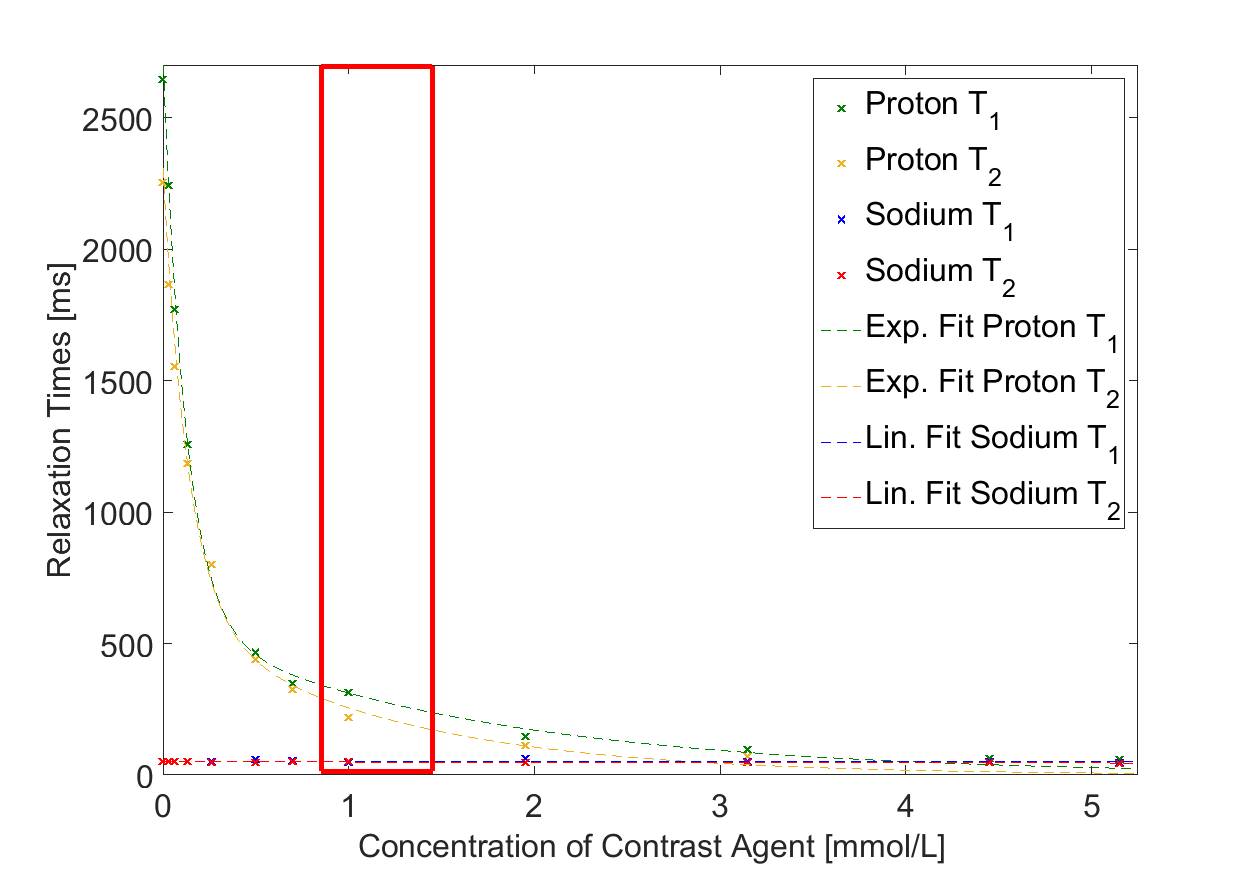
For proton imaging, increasing concentrations of contrast agent reduced the T1 and T2 relaxation times as expected exponentially from T1=2646 ms, T2=2255 ms (0.0 mmol/L Dotarem®) to T1=147 ms, T2=112 ms (5.2 mmol/L Dotarem®)(Fig. 3).
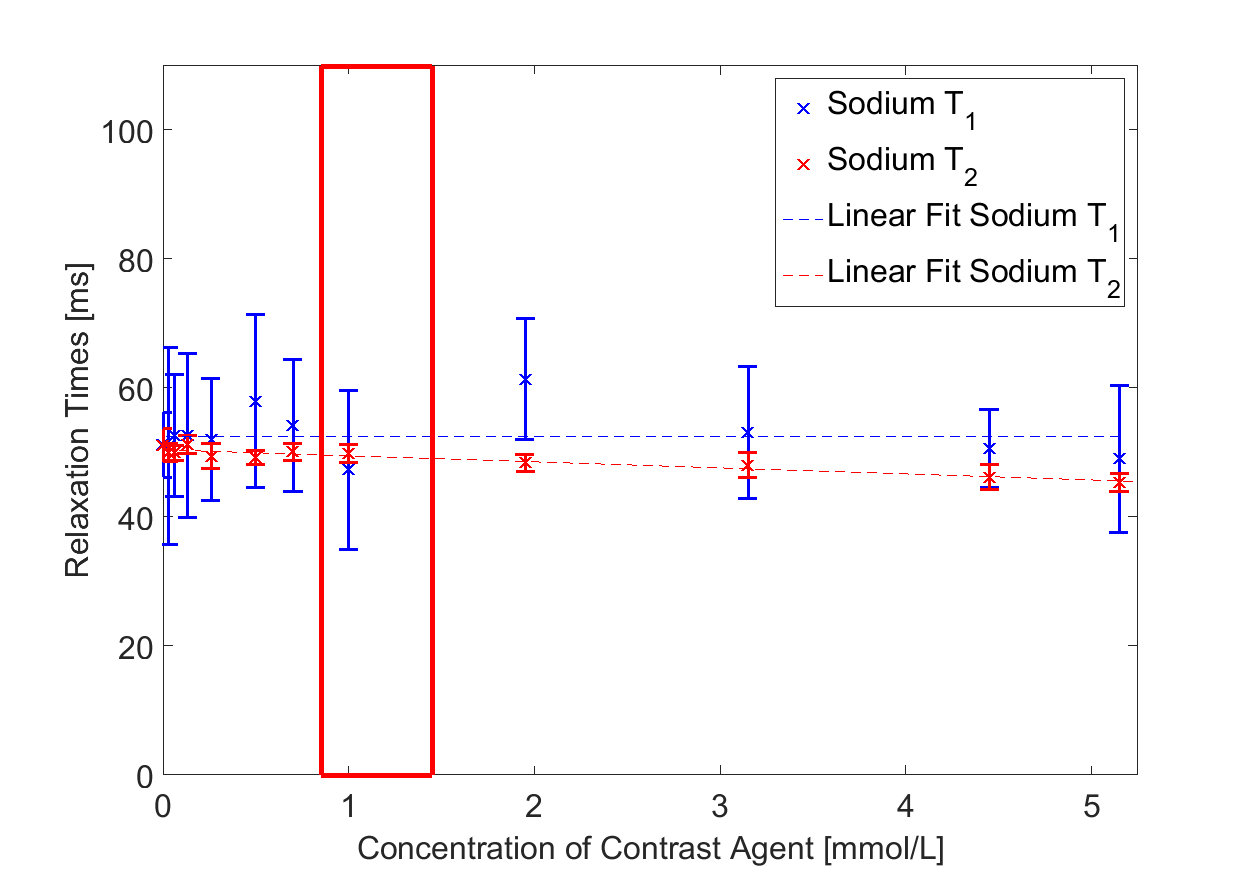
Sodium relaxation times were fitted with a mono-exponential decay since bi-exponential fits9 did not converge properly. Sodium mono-exponential relaxation times were influenced only slightly by proton contrast agent (Fig. 3 and Fig. 4). Variations in T1 were within the 95% confidence interval of fit accuracies. A linear regression for sodium T2 resulted in a negative slope of 0.94 ms/(mmol/L). For a mean clinical dose of 1.0 mmol/L contrast agent, T2 is reduced from 50.39 ms to 49.99 ms. A reduction in signal intensity due to the injection of Dotarem® can be expected to be 0.026% for a feasible TE of 0.7 ms.
Discussion
In clinical routine, contrast agents are used for a better distinction of different tissue types and dynamic examinations. The gadolinium based contrast agent Dotarem® reduces proton relaxation times exponentially. At the same time, sodium relaxation times are influenced little. Concerning quantitative sodium sequence design, a small reduction in T1 relaxation time has no clinical relevance, since TR is chosen three times larger than the largest T1 of tissue expected in the FOV. A decrease in T2 leads to a decrease in signal. However, the effect depends on the used TE and is small for typical TEs of a UTE sequence.
Conclusion
This study showed no significant change in sodium T1 and a reduction of 0.94 ms for sodium T2 caused by MR proton contrast agents in clinically relevant concentrations. Thus, sodium imaging is only slightly influenced and can be incorporated and interleaved with contrast enhanced 1H clinical sequence protocols. Even if the exact amount of contrast agent in blood and organs of interest is unknown, the low variations in sodium signal intensities of less than 0.026% are not expected to influence TSC quantification. To our best knowledge, this is the first study evaluating quantitative change in sodium relaxation times due to proton contrast agents.
Evaluations of other clinically used contrast agents and the
incorporation of agarose-based tissue-mimicking phantoms are in the scope of
our future work.
Acknowledgements
This research project is part of the Research Campus M²OLIE and funded by the German Federal Ministry of Education and Research (BMBF) within the framework “Forschungscampus: public-private partnership for Innovations” under the funding code 13GW0092D.
The MITIGATE project is co-funded by the European Union under grant no 602306.
References
[1] Madelin G and Regatte RR. Biomedical applications of sodium MRI in vivo. JMRI, 2013; 38(3): 511-2.
[2] Zöllner F, et al. Quantitative Sodium MRI of Kidney. NMR Biomed, 2016; 29(2): 197-205.
[3] Pandharipande PV, et al. Perfusion imaging of the liver: current challenges and future goals. Radiology, 2005; 234(3): 661-73.
[4] Bellin MF. MR contrast agents, the old and the new. Eur J Radiol., 2006; 60(3): 314-2.
[5] Task Group and Snyder WS. Report of the task group on reference man. ICRP 1975;23.
[6] Hendrick RE and Haacke EM. Basic physics of MR contrast agents and maximization of image contrast. JMRI, 1993; 3(1): 137-148.
[7] Konstandin S, et al. Two-dimensional radial acquisition technique with density adaption in sodium MRI. MRM, 2011; 65(4): 1090-96.
[8] Nagel AM, et al. Sodium MRI using a density-adapted 3D radial acquisition technique. MRM, 2009; 62: 1565-1573.
[9] Boada FE, et al. Quantitative in vivo tissue sodium concentration maps: the effects of biexponential relaxation. MRM, 1994; 32(2): 219-223.
Figures