2961
Optimizing the precision and accuracy of sampling schemes for T2* quantification of the fast biexponential decay of sodium MRI1Medical Physics in Radiology, German Cancer Research Center (DKFZ), Heidelberg, Germany, 2Institute of Radiology, University Hospital Erlangen, Erlangen, Germany
Synopsis
Sodium imaging is mainly performed with spin-density weighted sequences to quantify tissue sodium concentration. However, relaxation weighting can add additional specific information. We pursue appropriate sampling for low SNR and fast biexponential decay. The accuracy and precision of typical T2* measurements is determined for different sampling schemes by simulation and phantom measurements. We developed a dedicated sampling scheme for brain parenchyma employing numerical optimization. The results suggest that averaging is preferable to increase reliability compared to denser temporal sampling. In-vivo comparison confirmed the advantage of the optimized patter with increased separation of the decay components.
Introduction
Sodium (23Na) MRI is mainly performed with spin-density-weighted sequences to quantify tissue sodium concentration.1,2 However, relaxation weighting can add additional specific information.3 Due to the electrical quadrupole interaction of the spin 3/2-nucleus, T2 of 23Na is highly sensitive to the microscopic environment.4
In this work, we pursue appropriate sampling for the conditions of low SNR and fast biexponential decay. The accuracy and precision of typical T2* measurements is determined for different sampling schemes by simulation and phantom measurements. Additionally, we develop a dedicated sampling scheme for brain parenchyma employing numerical optimization.
Background
Conventional fast 1H sampling schemes,5,6 e.g. Carr-Purcell-Meiboom-Gill, are not applicable for 23Na MRI due to extremely low SNR, fast biexponential decay (60$$$\,$$$% short T2,s*$$$\,$$$=$$$\,$$$0.5-5$$$\,$$$ms/40$$$\,$$$% long T2,l*$$$\,$$$=$$$\,$$$15-30$$$\,$$$ms),1 and high specific absorption rates. Therefore, typically the apparent relaxation time T2* is detected.
The main constraint is low SNR, and long readout
durations compared to the decay are required (TRO$$$\,$$$=$$$\,$$$5-20$$$\,$$$ms). For
a sufficiently dense sampling of the decay, multiple repetitions (Nreps)
of a multiecho acquisition with minimal echo spacing ΔTE are
used. Sampling points are distributed by shifting the ith repetition
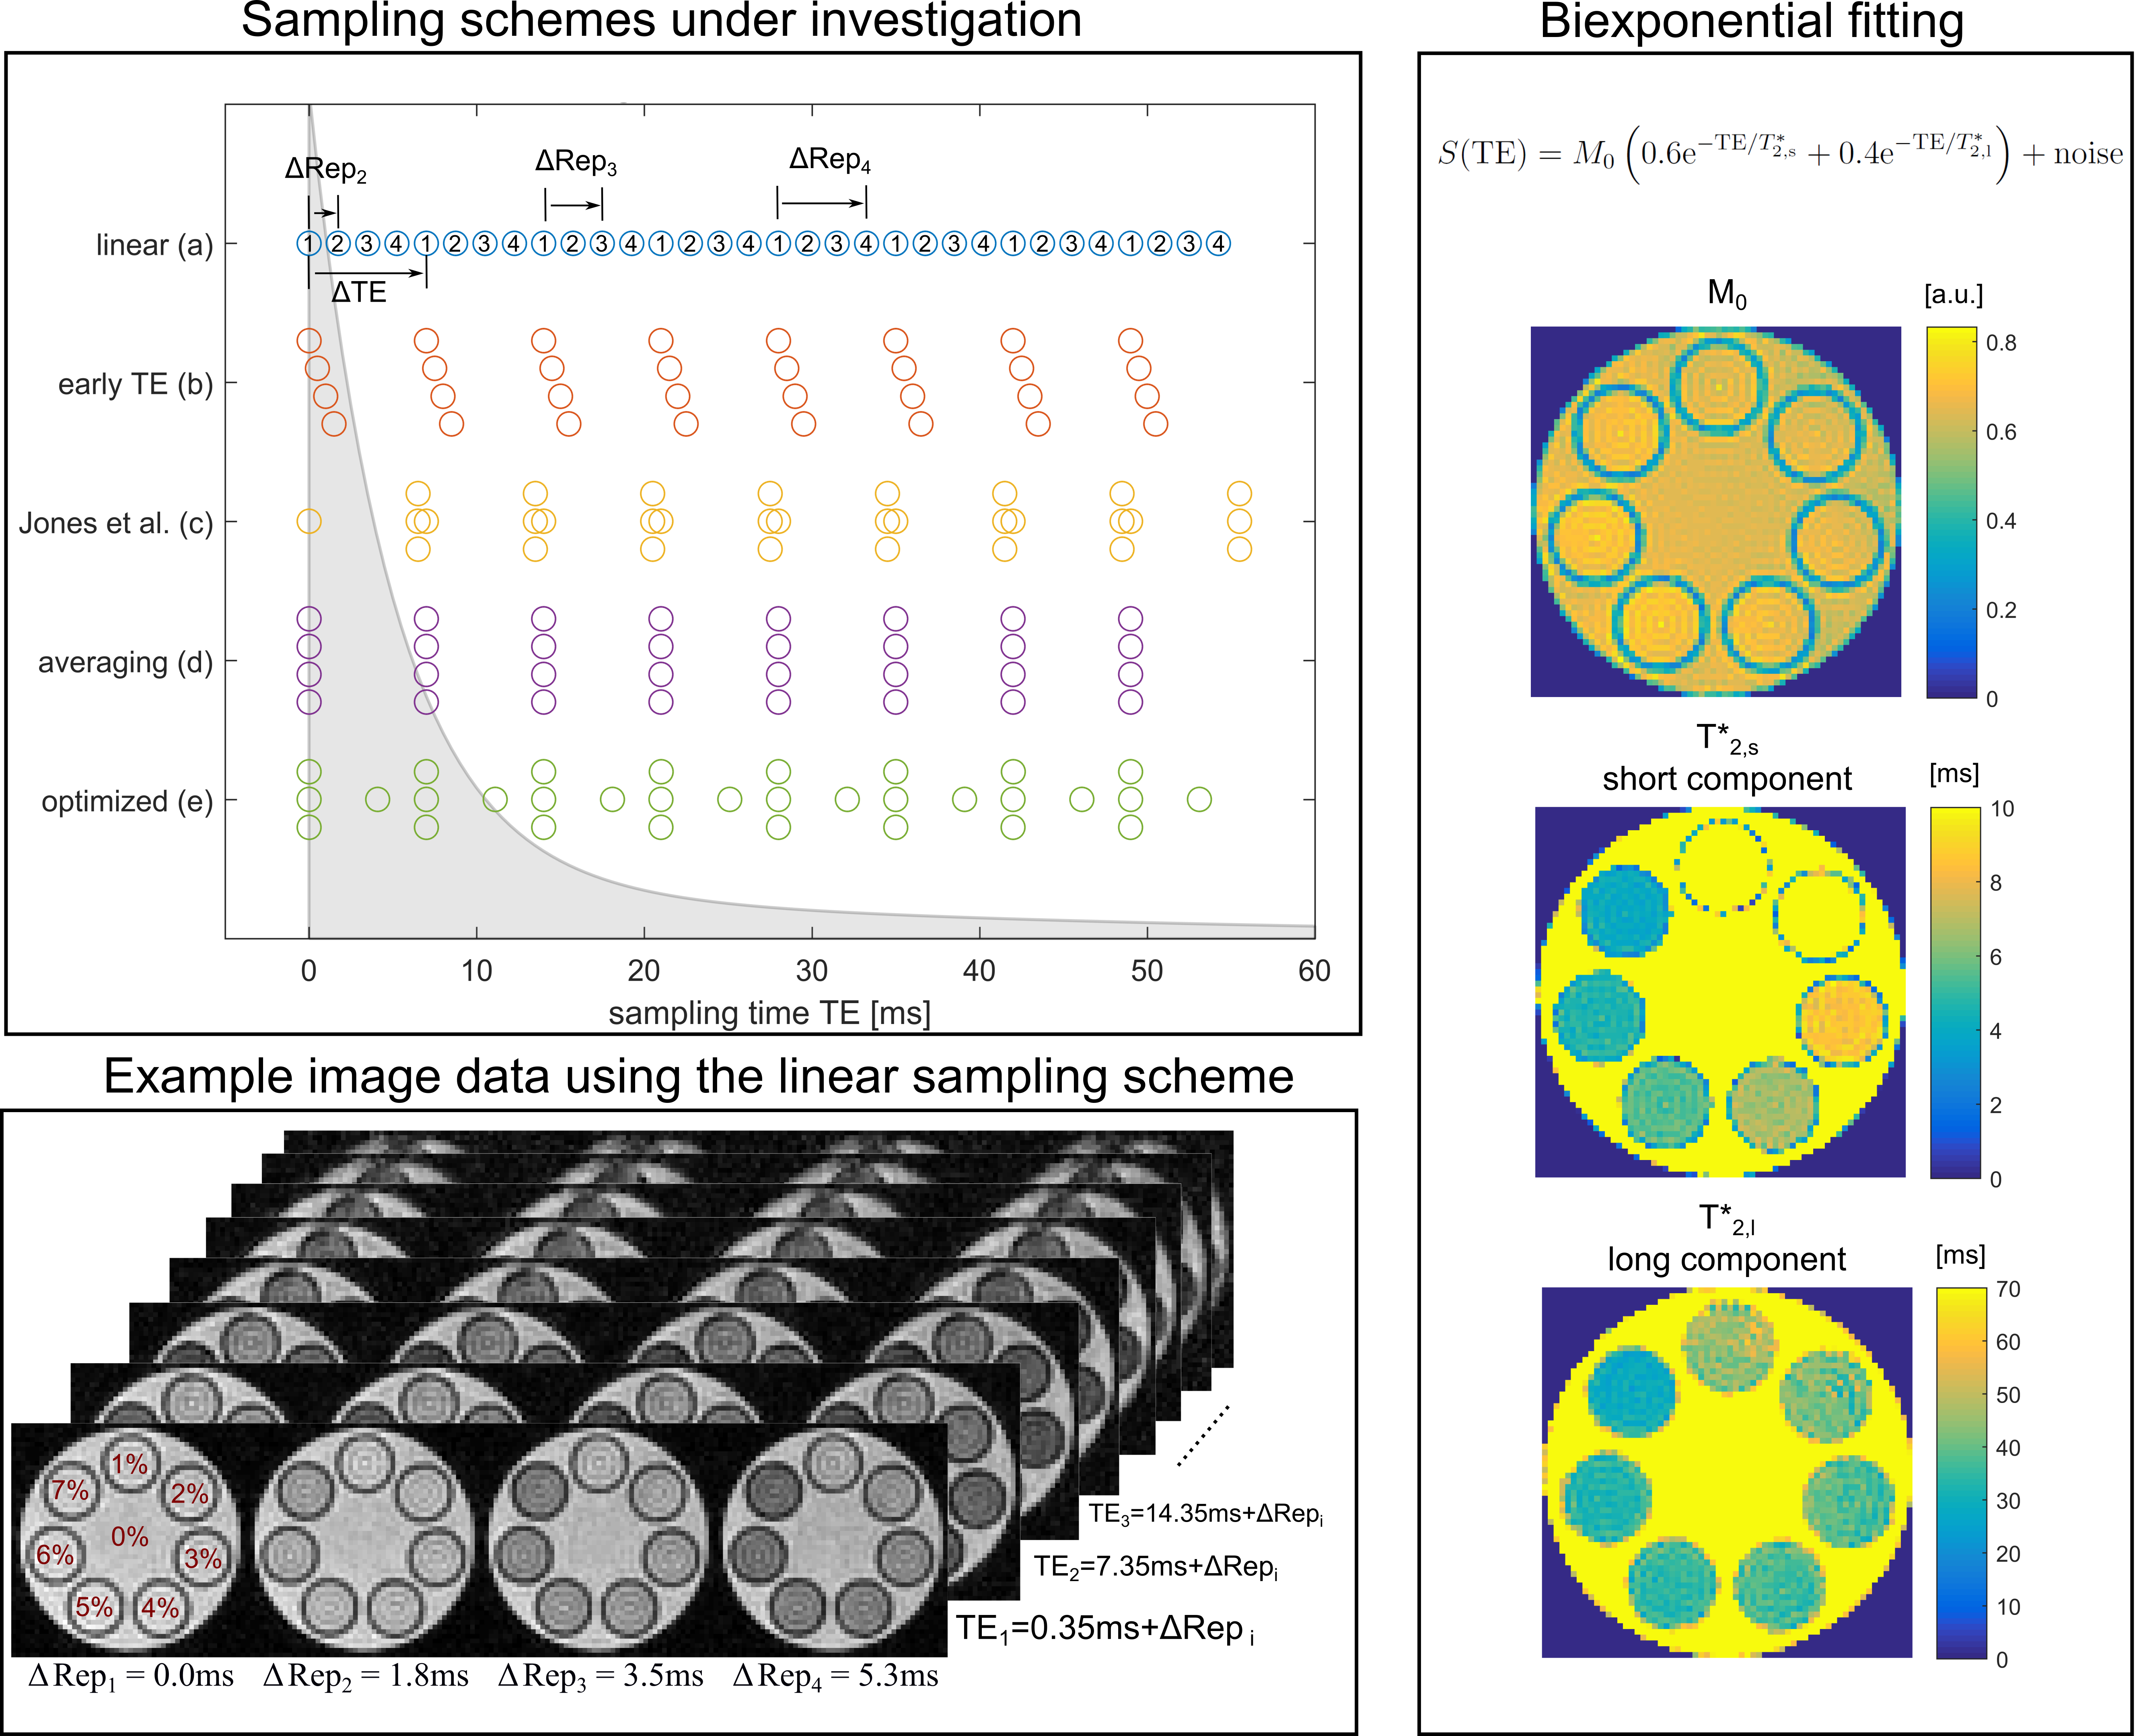
by a spacing ΔRepi (Figure$$$\,$$$1). Especially the accuracy of the short T2,s* depends on the
sampling scheme determined by ΔRepi.
For appropriate sampling, a trade-off has to be found between reliability of
sampling points, which can be achieved by averaging (ΔRepi$$$\,$$$=$$$\,$$$0$$$\,$$$ms), and sufficiently dense sampling, e.g. by linear
sampling (ΔRepi$$$\,$$$=$$$\,$$$TRO/Nreps). In a measurement, all shifts are delayed by TEmin determined by the pulse length.
Methods
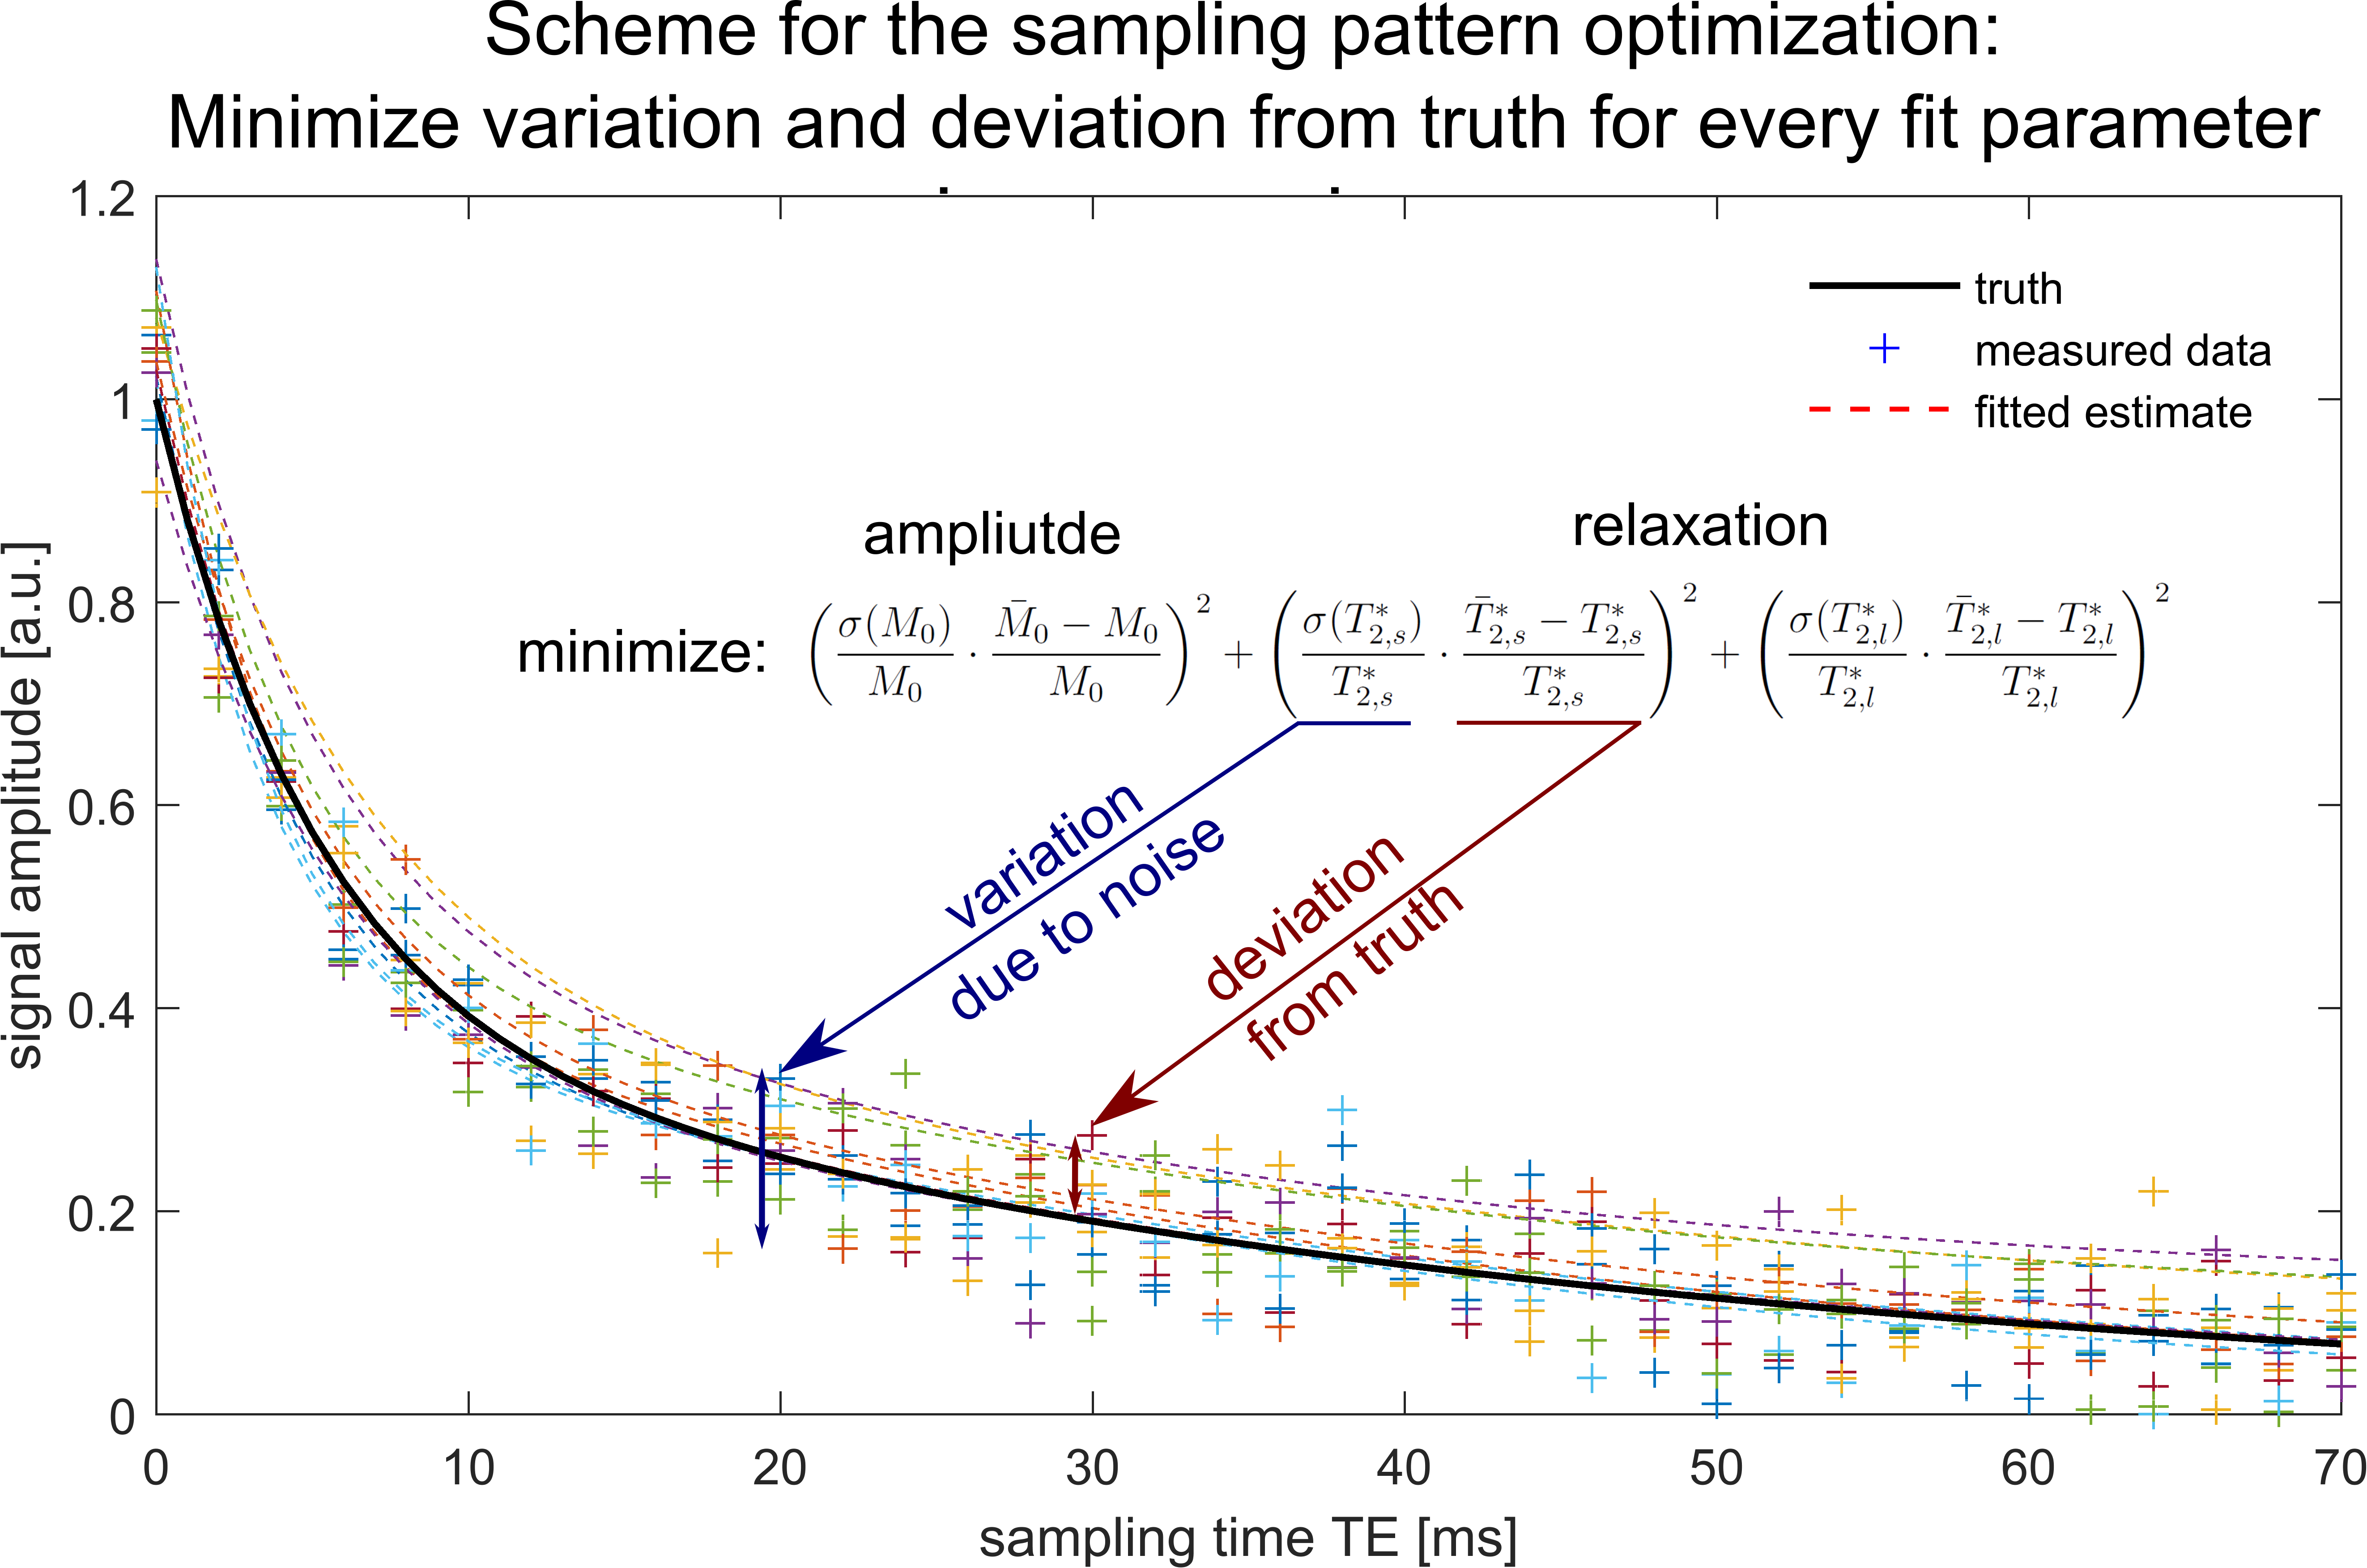
An optimization problem was formulated to solve for ΔRepi. In most 23Na$$$\,$$$applications, density weighting with long TR$$$\,$$$≥$$$\,$$$120$$$\,$$$ms is desired. Therefore, Nreps$$$\,$$$=$$$\,$$$4 repetitions was chosen to ensure applicable measurement duration$$$\,$$$<$$$\,$$$1$$$\,$$$h. We optimized for T2,s*/T2,l*$$$\,$$$=$$$\,$$$5/40$$$\,$$$ms as reported for brain parenchyma.3 The objective function was defined as the standard deviation multiplied with the relative error of a least-squares optimization of synthetic data (SNR$$$\,$$$=$$$\,$$$15) evaluated 30,000 times. This ensures correct parameter estimation while at the same time reducing the variability due to noise (Figure$$$\,$$$2). Optimization was carried out numerically using a multi-start approach.7
The resulting sampling scheme is compared to the following alternatives (Figure$$$\,$$$1): linear sampling, sampling at early TE, the scheme by Jones$$$\,$$$et$$$\,$$$al.8 focusing on T2,s*$$$\,$$$=$$$\,$$$5$$$\,$$$ms, and averaging.
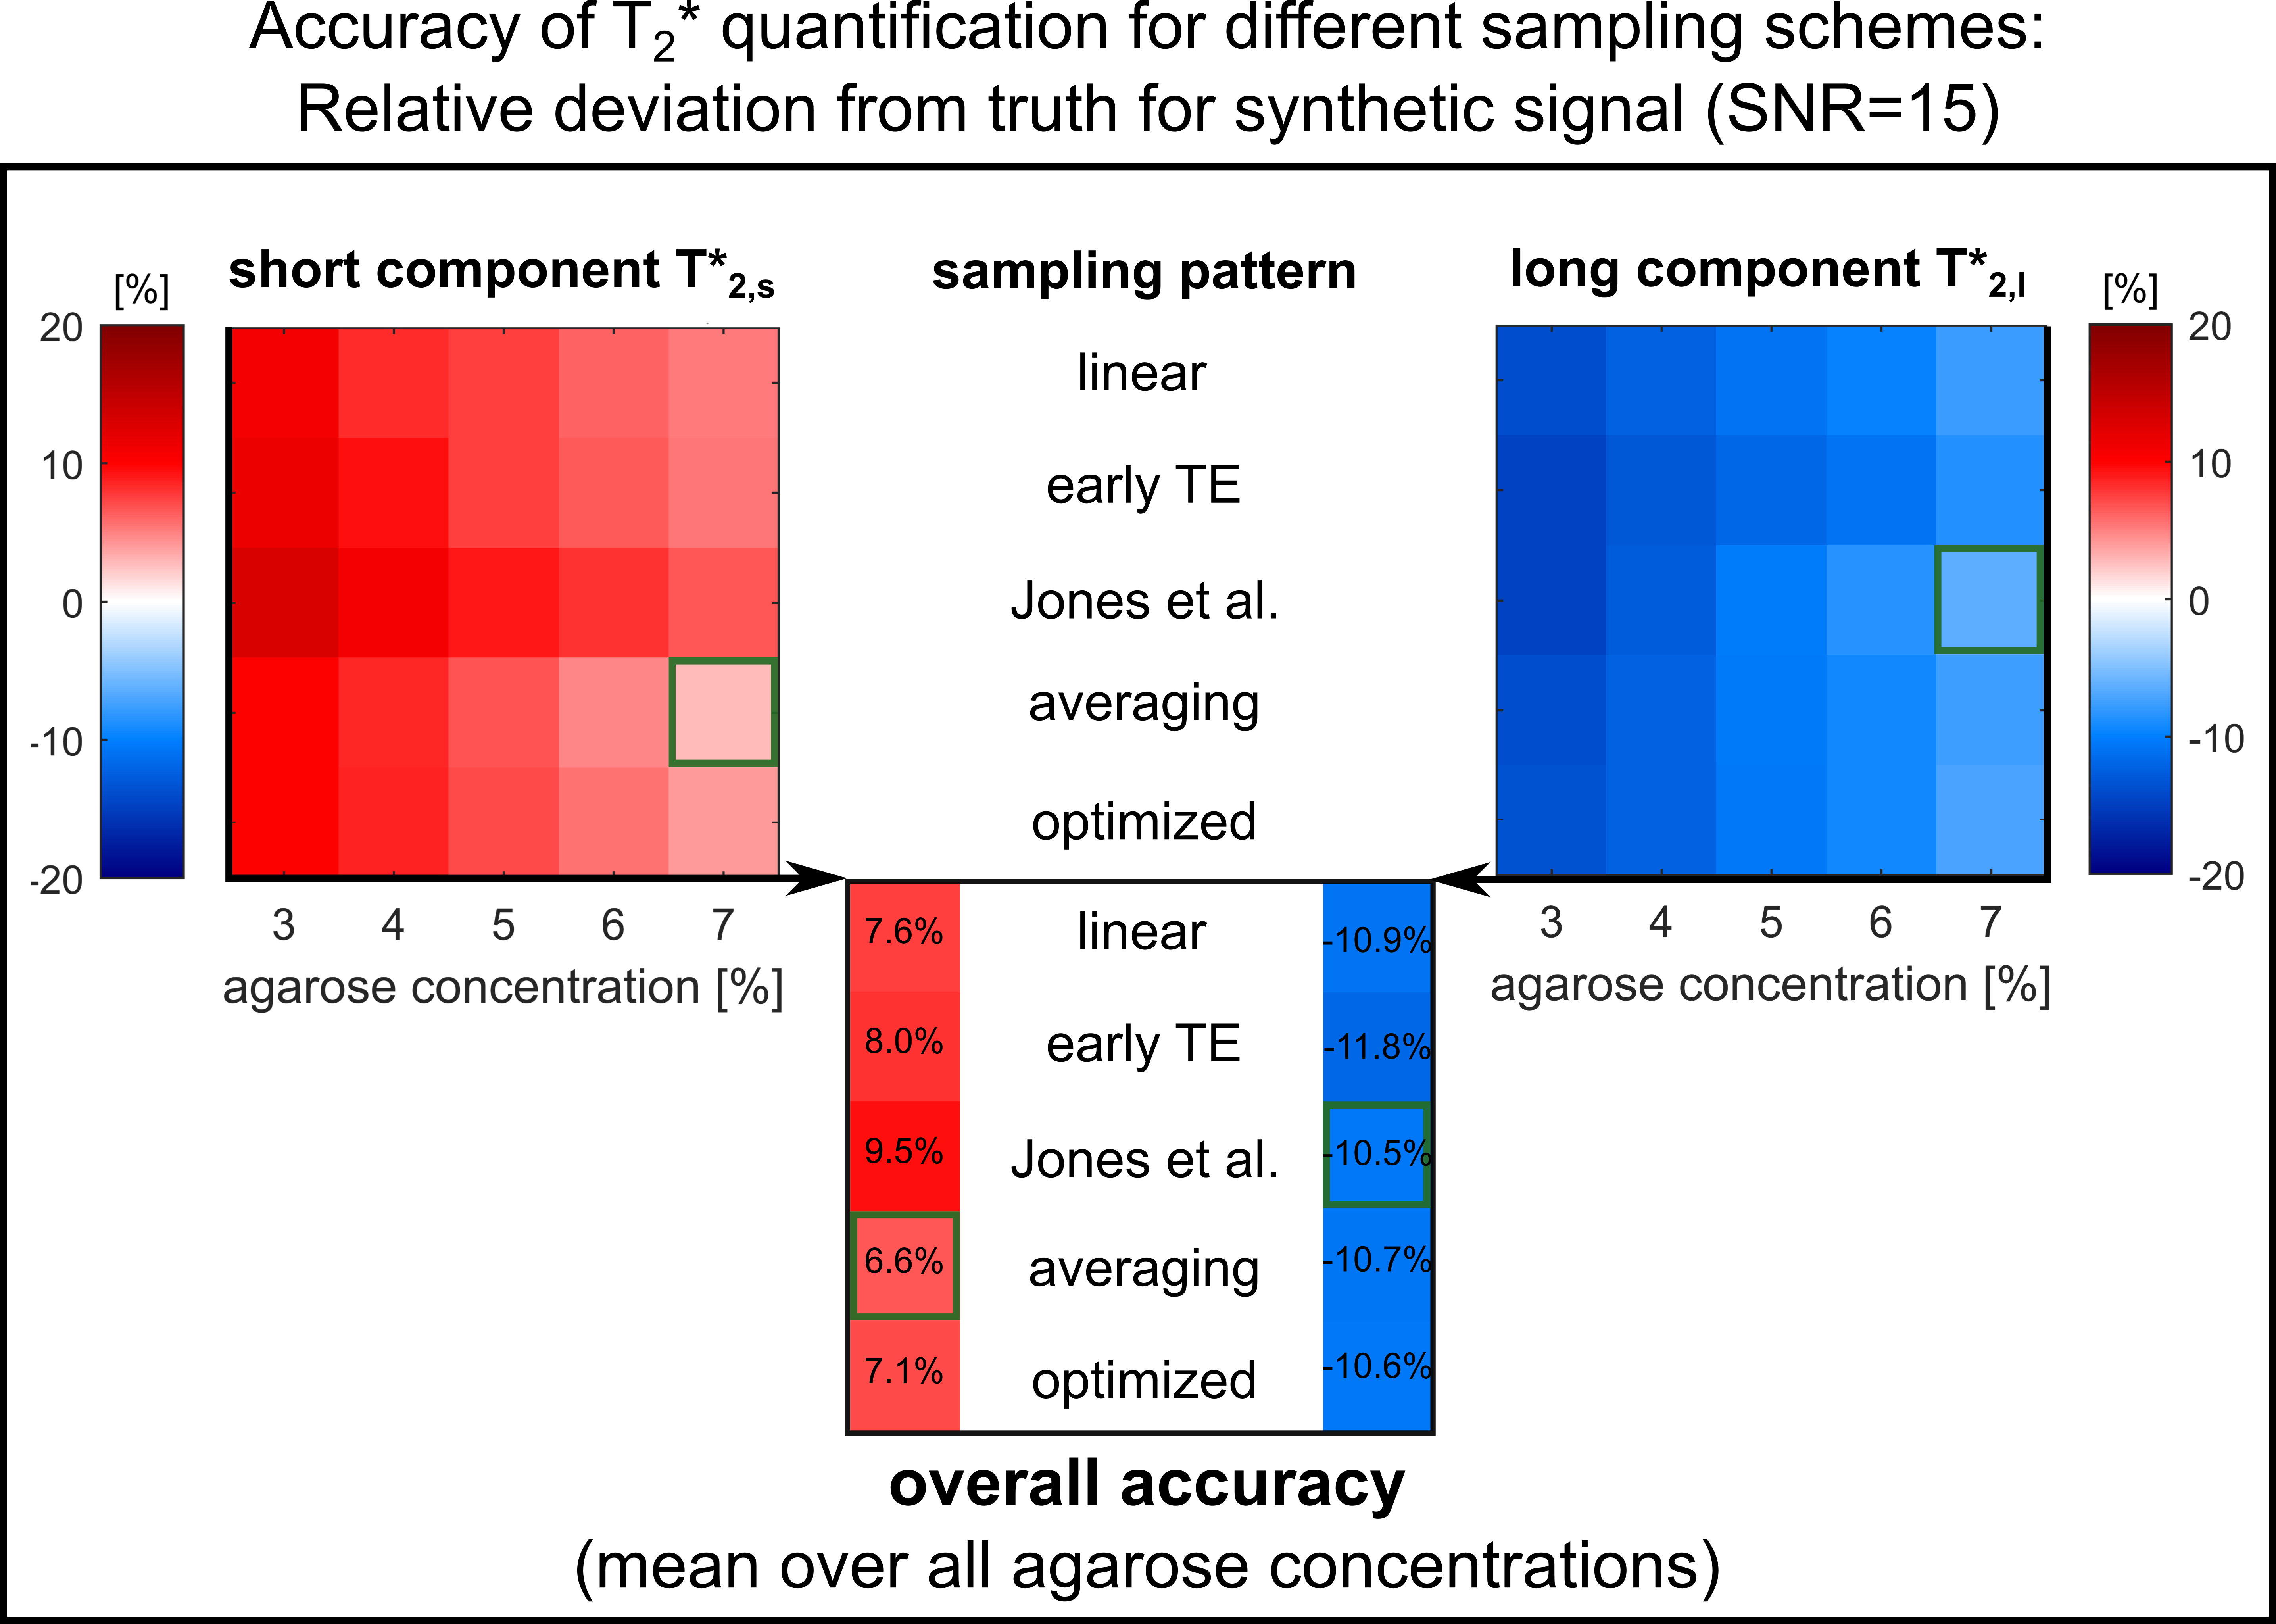
Systematic deviation in parameter estimation for each pattern was investigated by fitting a synthetic signal (SNR$$$\,$$$=$$$\,$$$15) with 30,000 repetitions. Additionally, phantom measurements were performed on a 7T whole-body scanner9 using a birdcage coil10 and a saline phantom (0.9$$$\,$$$%$$$\,$$$NaCl) with seven compartments of 1-7$$$\,$$$% agarose (Figure$$$\,$$$1). A radial readout scheme11 was employed with 8$$$\,$$$echoes, FA$$$\,$$$=$$$\,$$$90°, #Projections$$$\,$$$=$$$\,$$$7050, and nominal resolution of 3x3x3$$$\,$$$mm3.
Brain T2* quantification was performed using the linear and optimized sampling pattern with aforementioned parameters.
Results
The optimized sampling pattern consists of 3 averages at TEmin and an additional point at TE$$$\,$$$=$$$\,$$$TEmin$$$\,$$$+$$$\,$$$4.1$$$\,$$$ms for denser sampling (Figure$$$\,$$$1).
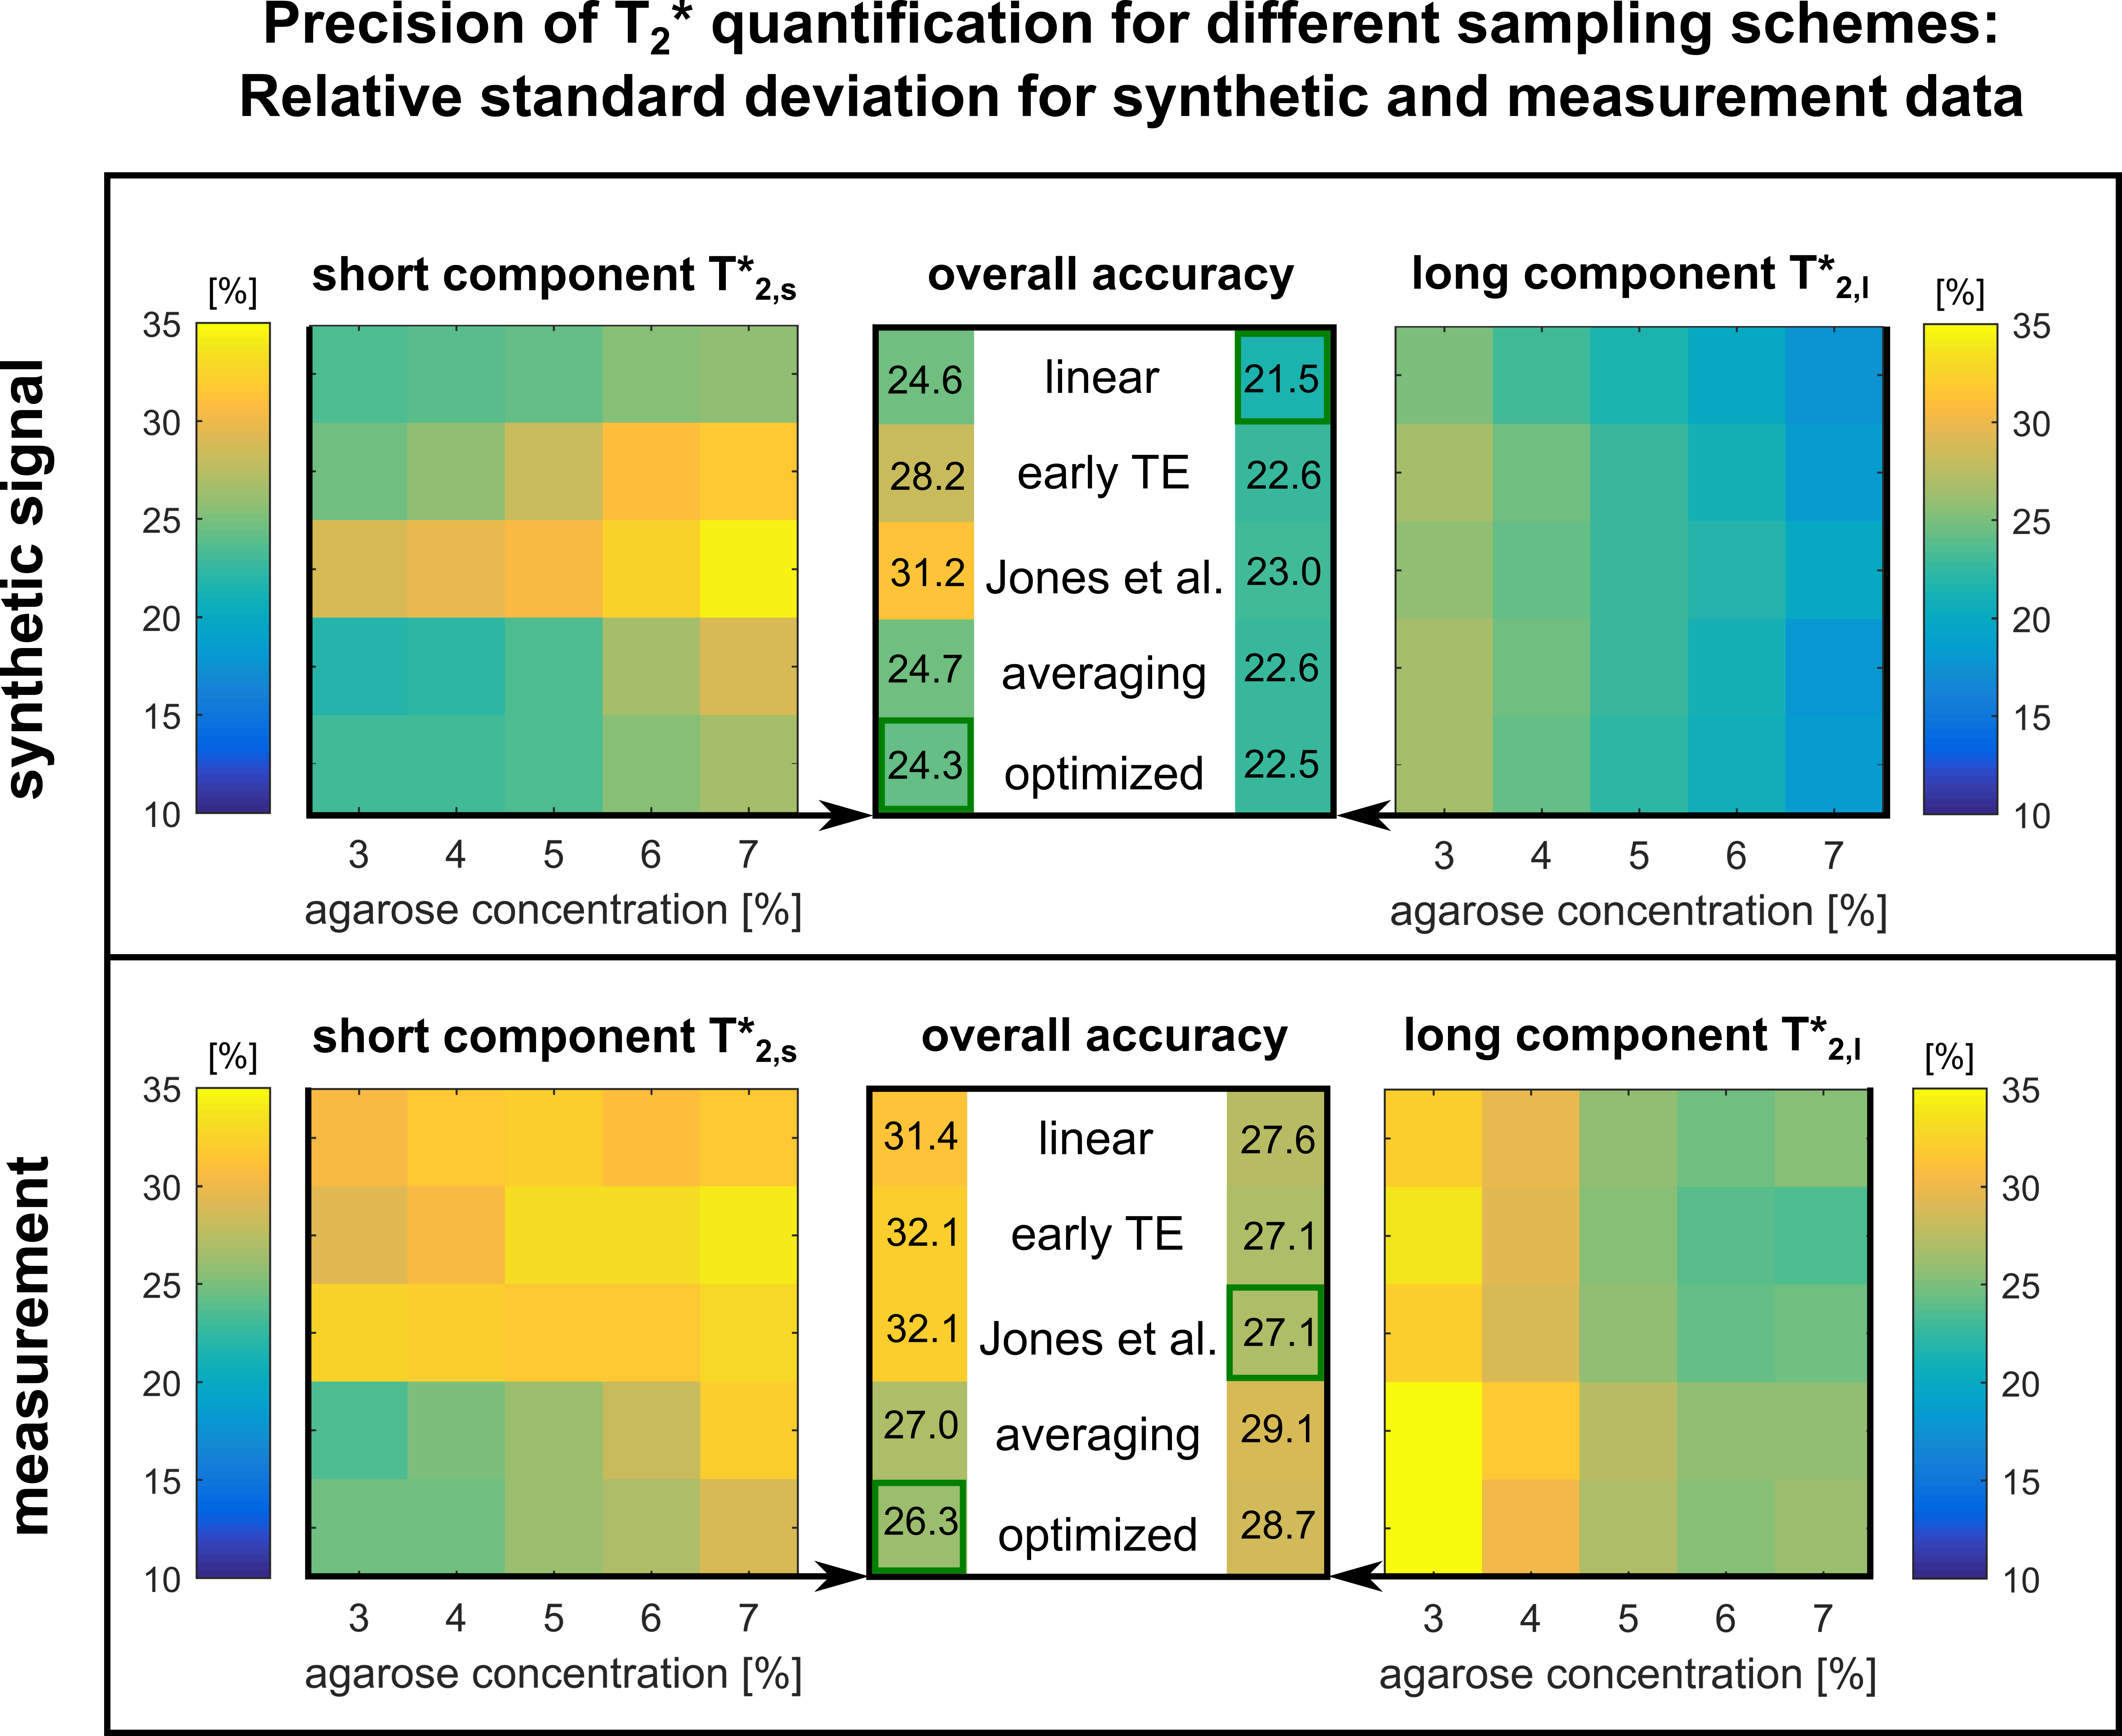
The mean deviations from the true relaxation times (Figure$$$\,$$$3) display a systematic overestimation of the short component (≈$$$\,$$$7$$$\,$$$%) and an underestimation of the long component (≈$$$\,$$$11$$$\,$$$%). Most accurate determination of T2,s* is found for averaging, whereas the pattern of Jones et al. performs best for T2,l*. Simulation and measurement show comparable noise behavior (Figure$$$\,$$$4). The optimized pattern exhibits smallest mean variation for the short component (26$$$\,$$$%). For T2,l*, the pattern of Jones$$$\,$$$et$$$\,$$$al. yields highest reliability (27$$$\,$$$%).
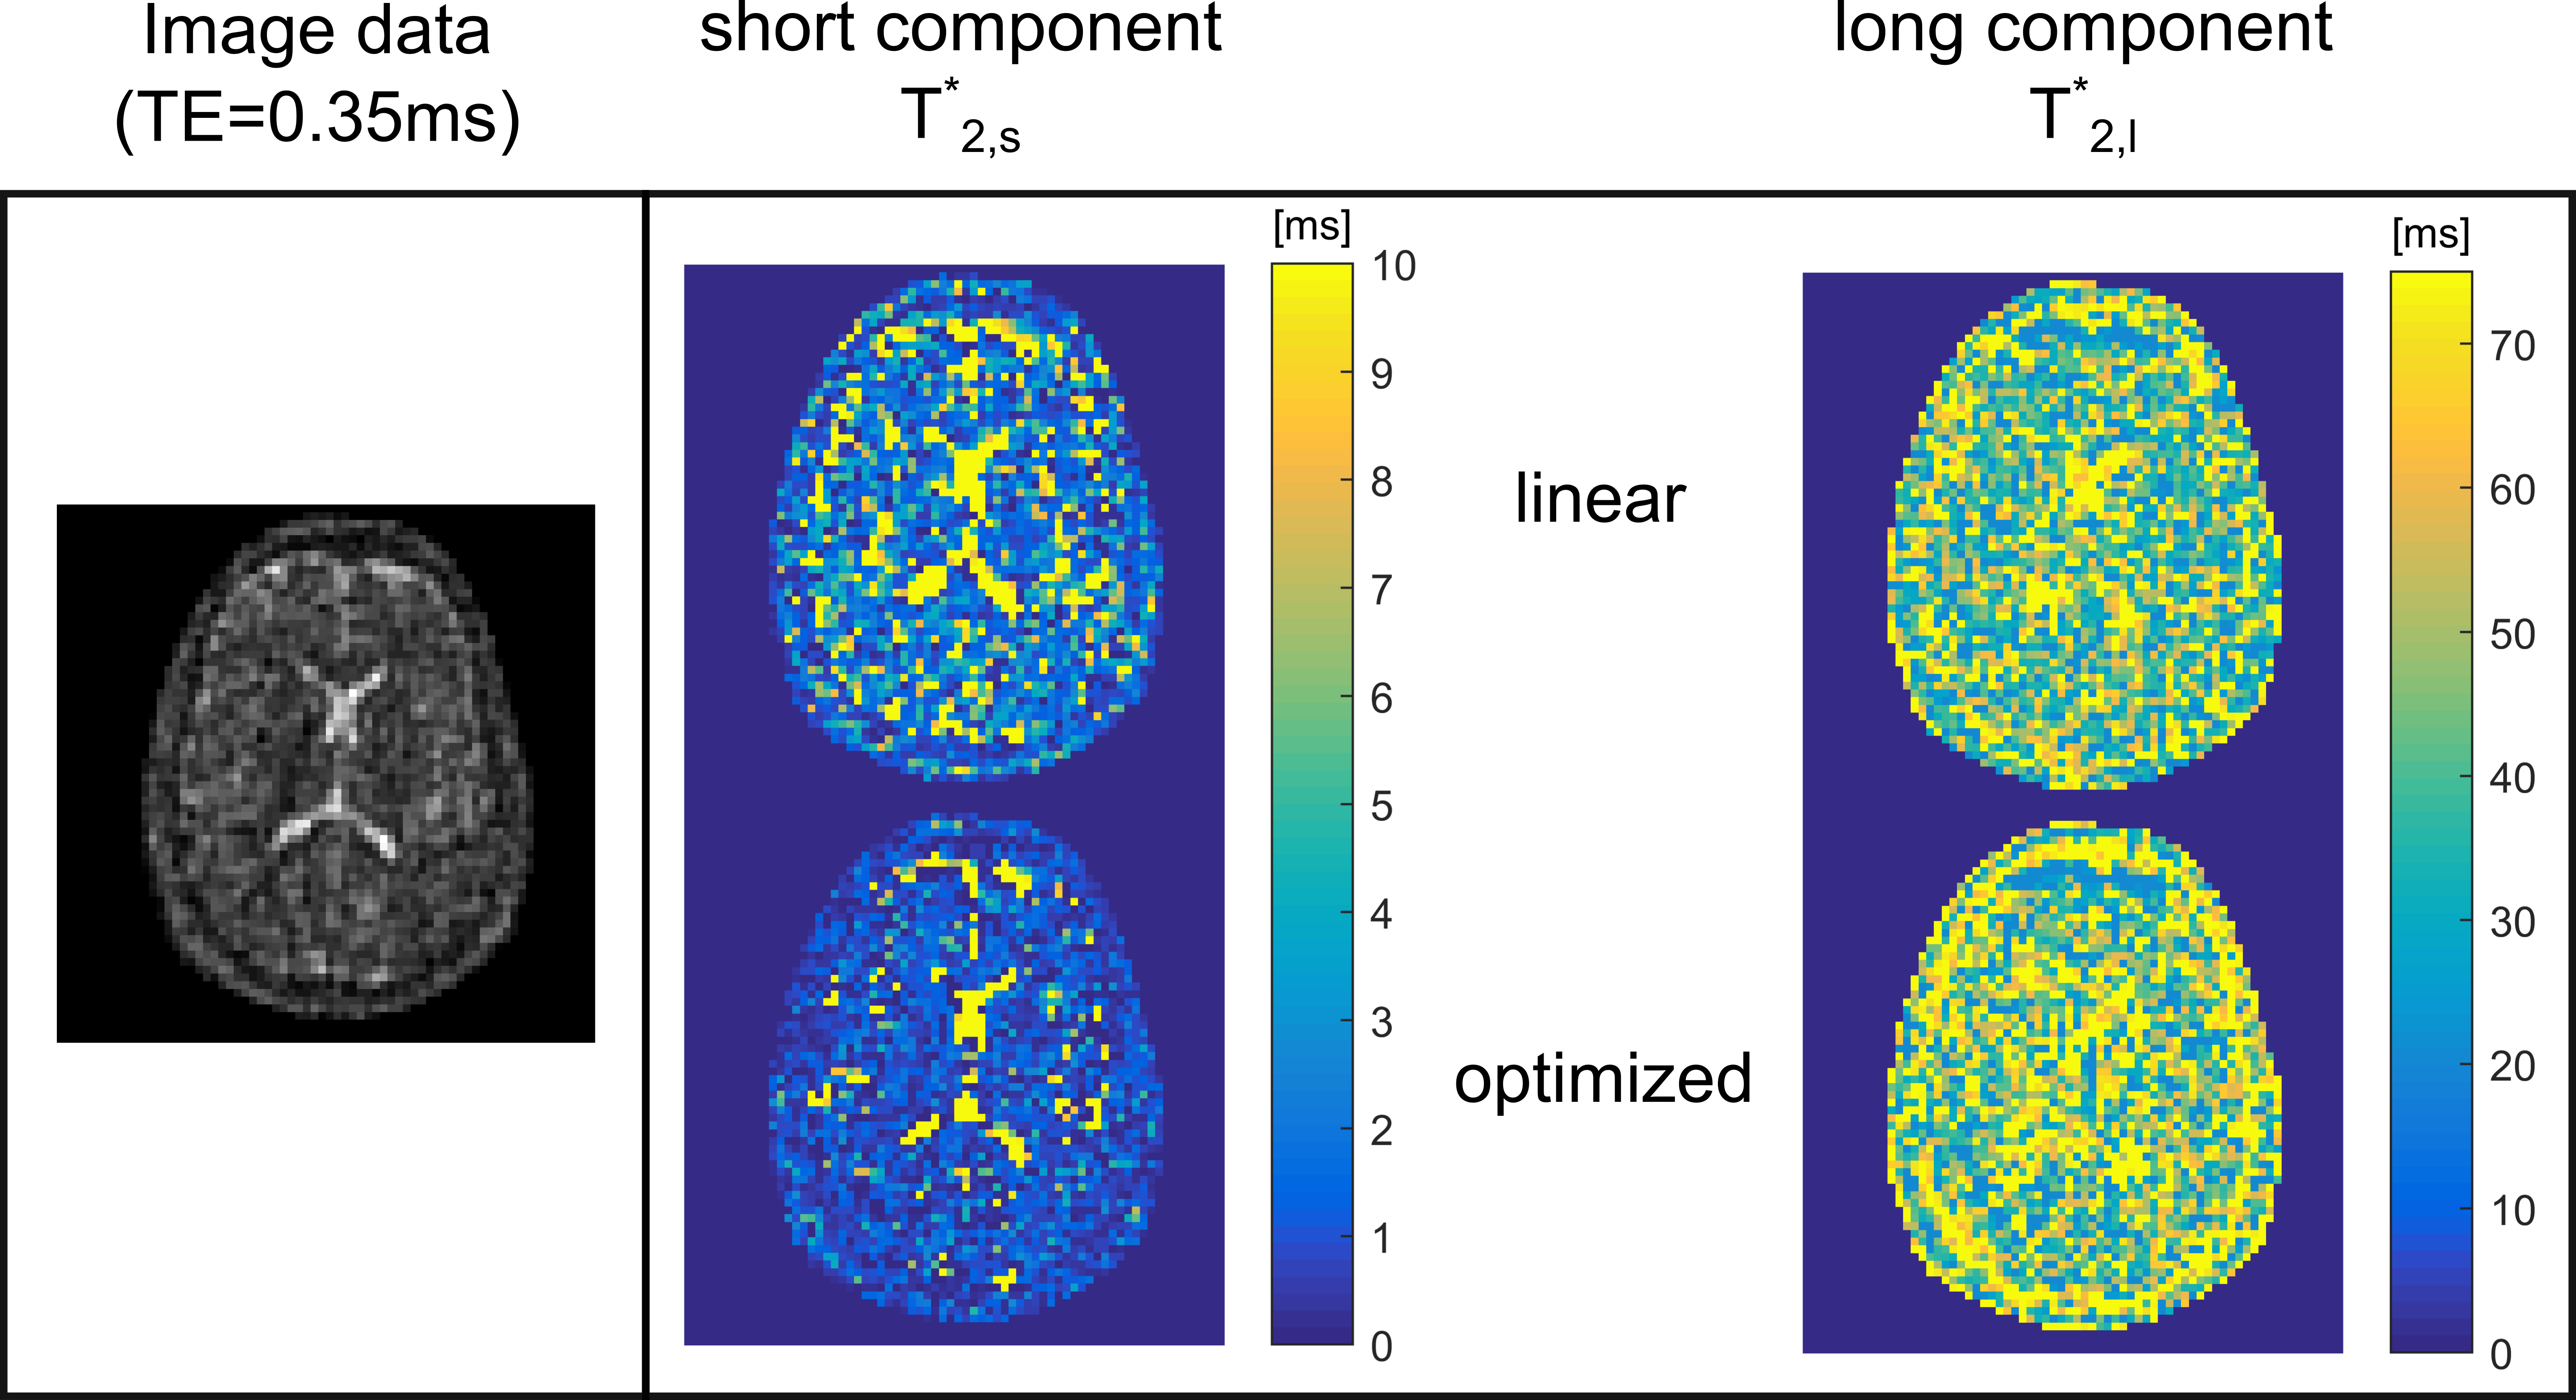
The in-vivo data exhibit lower T2,s* and higher T2,l* for the optimized pattern (Figure$$$\,$$$5).
Discussion and Summary
The obtained pattern matches previous findings8 in the sense that averaging is preferable to increase reliability compared to denser temporal sampling. At extremely low SNR, averaging at minimum TE is preferable since this achieves highest reliability.
Systematic bias in resolving two decay components is a typical problem when fitting multi-component exponentials with similar decay times.12 At low agarose concentration the ratio T2,s*/T2,l* becomes smaller and the fitting problem becomes more ambiguous.
The in-vivo comparison confirms the advantage of the optimized patter since the decay components are further separated. From this evaluation, we conclude that T2* values in brain may actually be shorter for T2,s* and longer for T2,l* than previously reported. However, absolute quantification is still limited by very low SNR.
The presented work focused on specific values for the$$$\,$$$brain. This can be extended by optimization over a range of T2* values. Furthermore, if only T2* quantification is pursued, shorter TR is favorable. In future, SNR/time can be increased by substitution of the rewinder by an additional readout.
The proposed approach can be generalized to a variety of SNR and decay environments and the obtained pattern can be applied to further studies of 23Na T2* decay to complement concentration measurements, e.g. for the brain or cartilage.
Acknowledgements
This work was funded in part by the Helmholtz Alliance ICEMED – Imaging and Curing Environmental Metabolic Diseases, through the Initiative and Networking Fund of the Helmholtz Association.References
1 Madelin G and Regatte RR. Biomedical applications of sodium MRI in vivo. Journal of Magnetic Resonance Imaging. 2013; 38: 511-529
2 Thulborn KR, Davis D, Adams H, et al. Quantitative tissue sodium concentration mapping of the growth of focal cerebral tumors with sodium magnetic resonance imaging. Magnetic Resonance in Medicine. 1999; 41: 351-359
3 Nagel AM, Bock M, Hartmann C, et al. The Potential of Relaxation-Weighted Sodium Magnetic Resonance Imaging as Demonstrated on Brain Tumors. Investigative Radiology. 2011; 46: 539-547
4 Rooney WD and Springer CS. A comprehensive approach to the analysis and interpretation of the resonances of spins 3/2 from living systems. NMR in Biomedicine. 1991; 4: 209-226
5 Pell GS, Briellmann RS, Waites AB, et al. Optimized clinical T2 relaxometry with a standard CPMG sequence. Journal of Magnetic Resonance Imaging. 2006; 23: 248-252
6 Poon CS and Henkelman RM. Practical T2 quantitation for clinical applications. Journal of Magnetic Resonance Imaging. 1992; 2: 541-553
7 MATLAB 2015b and Global Optimization Toolbox 3.3.2, The MathWorks, Inc., Natick, Massachusetts, United States: Global Search Algorith
8 Jones J, Hodgkinson P, Barker A, et al. Optimal Sampling Strategies for the Measurement of Spin-Spin Relaxation Times. Journal of Magnetic Resonance. 1996; 113: 25-34
9 Siemens, Erlangen, Germany
10 RAPID, Rimpar, Germany
11 Nagel AM, Laun FB, Weber MA, et al. Sodium MRI Using a Density-Adapted 3D Radial Acquisition Technique. Magnetic Resonance in Medicine. 2009; 62: 1565-1573
12 Papy JM, De Lathauwer L and Van Huffel S. Exponential data fitting using multilinear algebra: the decimative case. Journal of Chemometrics. 2009; 23: 341-351
Figures