2960
Variable Flip Angle Pipeline for in vivo Sodium Concentration Measurements (VaSCo)1NeuroSpin, CEA, Paris Saclay University, Gif-sur-Yvette, France, Paris, France, 2Center for Biomedical Imaging, Department of Radiology, New York University Langone Medical Center, New York, USA, 3Aachen University Clinic, Neurology Department, Aachen, Germany
Synopsis
This work presents a new method to measure Sodium concentration in human tissue using the Variable Flip Angle method with optimized acquisition parameters. Healthy volunteers were scanned and measures provided concentration values and T1 values in agreement with litterature values.
Introduction
Sodium is the second most concentrated NMR sensitive nuclei in the human body and is involved in cellular homeostasis. Therefore, studying its distribution in human tissues can provide insights about cellular viability. Here, we introduce a new method based on a variable flip angle (VFA)[1] approach, to simultaneously obtain T1 and [Na] maps, as well as T1-weighted sodium images, in vivo, in clinically feasible times (VaSCo). The acquisition pipeline has been previously validated for in vitro 31P MRI at 7 Tesla[2].Methods
Four healthy volunteers were recruited and scanned after providing informed consent.
All acquisitions were performed on a clinical 3T scanner (PRISMA, Siemens Healthcare, Erlangen, Germany). For sodium scans we used a non-Cartesian sequence FLORET[3] and a dual-tuned single channel 1H/23Na coil (Rapid Biomed, Rimpar, Germany). Anatomical images of the volunteers were acquired with a 64-channels proton coil provided with the scanner.
Two 3D steady-state spoiled gradient recalled echo (SPGR) scans of the whole brain with parameters: TR/TE/FA1/FA2=20ms/0.1ms/25°/55° (Ernst Angle in brain tissues) were acquired at a spatial isotropic resolution of 4mm. TR and FA were selected to maximize SNR in reconstructed images within SAR constraints and VFA working range.For comparison, a standard Total Sodium Concentration (TSC) approach was also acquired, with the same FOV and spatial resolution, and parameters TE/TR/FA=0.1/120ms/90°.
Both scanning approaches were performed using a fractioned paradigm to account for patient motion in long acquisitions. 3 three-minutes long scans were acquired for each FA in the VFA approach and 6 three-minutes long for the TSC scans. In both cases the total acquisition time was 18 minutes.
To correct for transmitter imperfections, we acquired a B1+ map in 4 minutes using a Double Angle Method[4] (DAM) with FA=60°/120°and a 6mm isotropic resolution.
Sodium raw data was reconstructed using the NUFFT[5] algorithm implemented in Matlab (The Mathworks, Natick, USA). Real and Imaginary parts of each reconstructed block image were corrected with a rigid motion correction using ANTs[6]. Homodyne phase reconstruction was then applied before averaging to obtain final images.
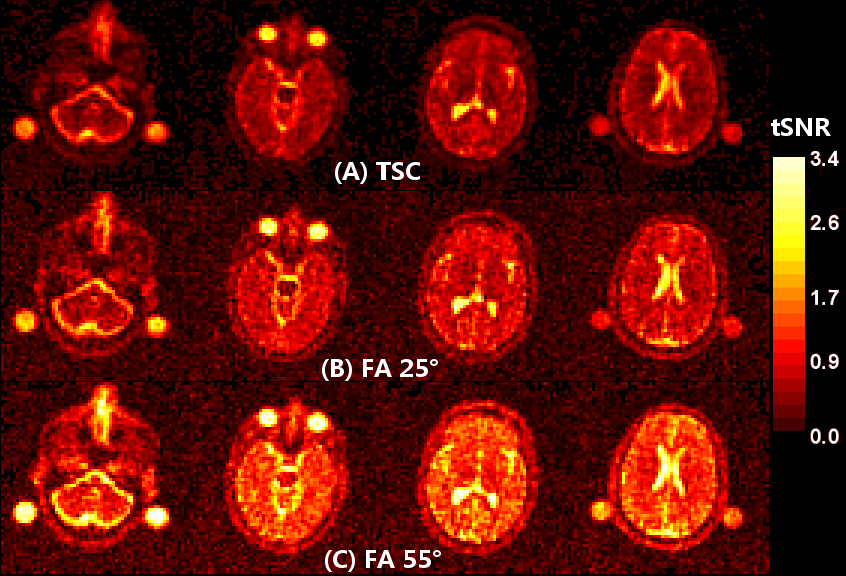
An acquisition efficiency comparison is presented on Figure 1, where images have been computed as $$ I_{eff}=\frac{SNR}{\sqrt{TA}}$$ showing VaSCo’s better efficiency.
All images were then registered to TSC’s images space prior to post-processing.
B1+ map was computed from DAM and interpolated using low order spatial polynomials. It was used in a regression pipeline to correct for transmission profile and simultaneously estimate T1 and M0 maps. Finally, the M0 image was corrected for reception sensitivity profile estimated using reciprocity principle to reach spin density estimation using: $$\rho=\frac{M_0}{B_{1}^{-}}$$.
A 3-points affine intensity calibration was performed using external references (2% agarose at 50mM and 100mM respectively, and noise deviation) placed in the acquisition FOV. TSC images were corrected for saturation effects (since TR<5T1) and underwent the same calibration method.
We used the two compartments model providing concentrations in the [36,39] mmol.L-1 range as computed with $$TSC=ICC\times CVF + ECC\times(1-CVF)$$ with ECC $$$\in$$$ [145,150] and ICC $$$\in $$$[10,12] and CVF≈0.81[7].
Results
As illustrated by Figure 1, having high SNR T1w Sodium images is of high interest for pathological condition studies of stroke for instance[8-9].
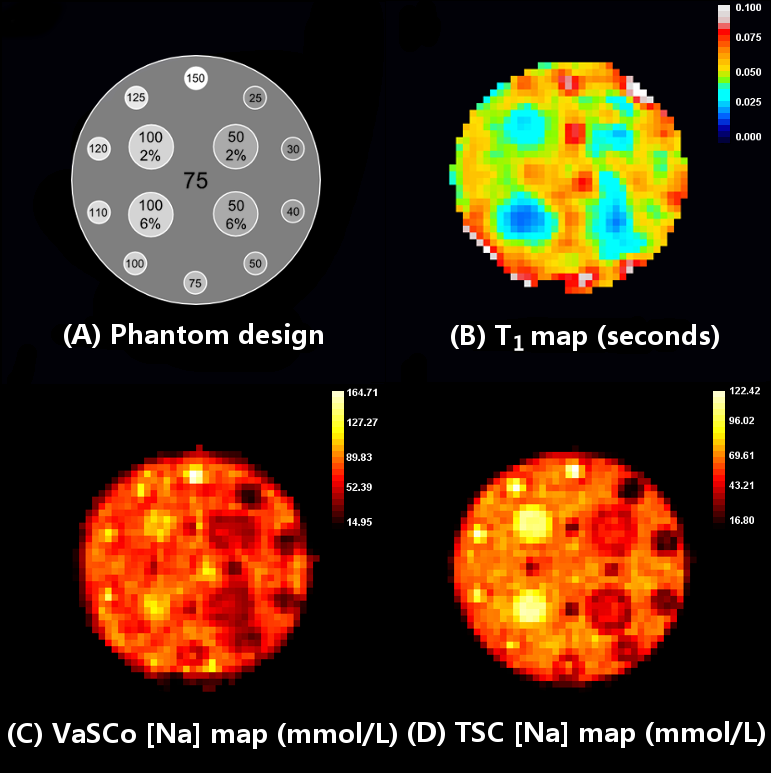
Measurements were first performed on a phantom to validate the acquisition method and the robustness of the concentration assessment pipeline. Measured concentrations were in agreement with theoretical values and measured T1 values reflected well the different agarose concentrations as illustrated in Figure 2.
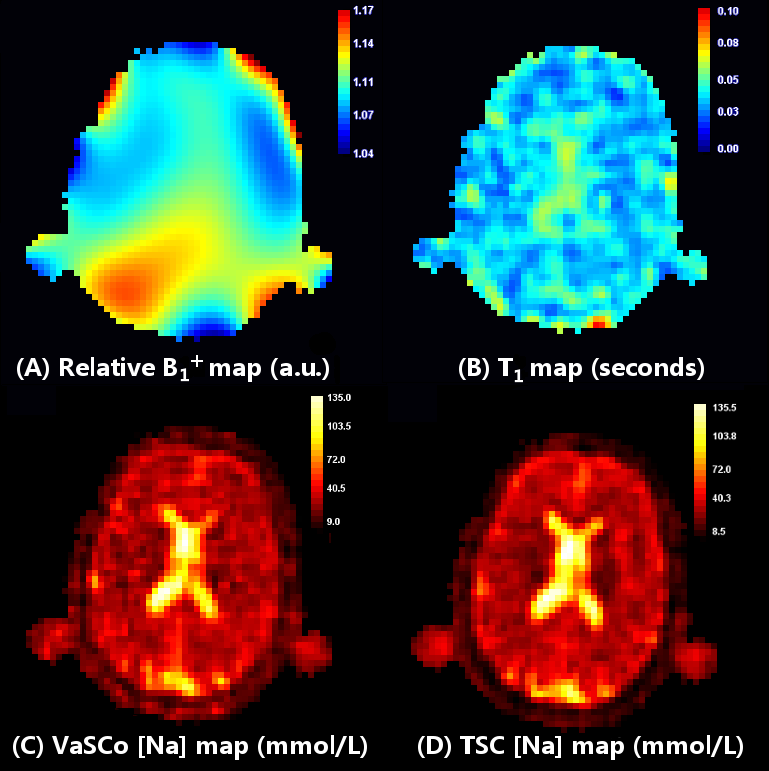
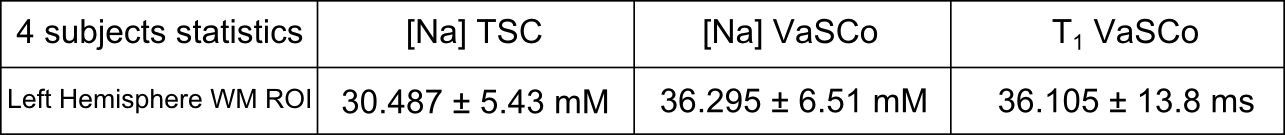
Figure 3 illustrates an in vivo application of VaSCo’s pipeline: the interpolated B1+ map (a), the computed T1 (b) and concentration (c) maps and the TSC concentration map (panel d) for comparison. Tissue segmentation obtained from the anatomical image was used for tissue specific concentration measurements to compare our method with TSC. T1 map (b) provides a mean value in CSF of 50.3±7ms and 34.6±7.5ms in brain tissue which is in agreement with literature values[10]. Measurements for the four volunteers are presented in Table 1. Results from VaSCo are higher than TSC, however they are closer to the theoretical concentration values.
Conclusion
In this work, we demonstrate the validity of the VFA method to estimate [Na] concentration and T1 maps in a clinical setting. Compared to the standard TSC approach, this method allows us to extract more information while preserving accuracy. Results are consistent with previously reported values. The use of fractioned acquisitions allows to compensate for possible patient motion as sodium acquisitions are quite long. The whole pipeline, i.e. the sum of VaSCo and the T1w acquisition, lasts less than 25 minutes which fits clinical constrains. Explorations are pursued to further improve the protocol and reduce its duration.Acknowledgements
We Acknowledge J. Bernard for making the phantom used for tests.References
[1] Fram et al. Magn. Reson. Imaging, 5(3):201-8, 1987.
[2] Coste et al. Proc. ISMRM 24, 2016.
[3] Pipe et al. MRM 66:1303–1311, 2011.
[4] Stollberger, MRM 35246-251, 1996.
[5] Fessler et al. JMR 188(2), 191–195, 2007.
[6] Avants et al. Neuroimage. 54(3):2033-44, 2011.
[7] Thulborn et al. NMR Biomed 29(2):137–143, 2016.
[8] Hussain et al. Ann Neurol. 66:55– 62, 2009.
[9] Tsang et al. JMRI 33:41–47, 2011.
[10] Shah et al. NMR Biomed 29 (2):162–174, 2016.
Figures