2957
3D Multi-Echo Radial Imaging of $$$^{23}$$$Na (3D-MERINA) for time-efficient multi-parameter mapping1Electrical & Electronic Engineering, University of Melbourne, Melbourne, Australia, 2Siemens Healthcare, Melbourne, Australia, 3Anatomy & Neuroscience, University of Melbourne, Melbourne, Australia, 4joint senior authors
Synopsis
Challenging imaging characteristics (low SNR, fast bi-exponential decay) have so far limited the application of 23Na-MRI in clinical environments. This work presents 3D Multi-Echo Radial Imaging of 23NA (3D-MERINA), a time-efficient acquisition protocol from which multiple parameter maps (sodium-density, T2*slow and T2*fast, free 23NA) can be derived in a single acquisition. Phantom and in-vivo measurements were analysed for the evaluation of parameter mapping and the inference of tissue characteristic based on decay behaviour. All parameters were acquired in a single sodium-density-weighted acquisition under relatively low SAR. Future investigation will exploit 3D-MERINA for SQF-SNR enhancement and the detection of MQF contrasts.
Purpose
Sodium is the second most abundant MR detectable nucleus in biological tissue and is anticipated to give valuable insight into tissue viability and cell physiology – hence, offers potential as a biomarker across a variety of diseases1,2,3,7,15. Challenging imaging characteristics (low SNR and fast bi-exponential decay) have, however, limited its use in clinical environments. This work presents 3D Multi-Echo Radial Imaging of 23NA (3D-MERINA), a time-efficient acquisition protocol from which multiple parameter maps (sodium-density, T2*slow and T2*fast, free 23NA) can be derived in a single acquisition.Methods
Imaging was performed on a research 7T MRI scanner (Siemens Healthcare, Erlangen, Germany) with a transmit/receive dual-tuned 1H-23Na head coil (QED, USA). Data was collected with a custom-built radial sequence based on Saff and Kuijaars4 algorithm for homogeneous projection placement. TE0 is based on centre-out half-projections, following echoes are reconstructed from full-projections along the same angle (Figure 1). Reconstruction was performed via re-gridding onto an isotropic 3.1mm resolution grid in Matlab. A Hann-filter was applied for density-compensation; the weighting on full-projection echoes was halved to account for the higher number of sampling points compared to TE0.
Phantom:
The phantom (Figure 2) consisted of 16 vials (3cm diameter) of varied saline-concentrations (30, 70, 110 and 150mMol/l) and agarose-level (liquid, 1, 3 and 6%). Sodium imaging protocol parameters were: TR=160ms, FA=90°, 10,000 projections, FOV=20cm-iso, TA=26min40s. TE0 was set to 0.4ms, consecutive TEs depended on the readout duration (TRO). For TRO evaluation 10 acquisitions with TRO=[1,...,10ms] were collected. The dwell time was set to the hardware limit of 5$$$\mu$$$s.
In-vivo:
Human in-vivo data was acquired on a healthy female volunteer. Sodium imaging parameters were kept as above, TRO was set to 2ms, 31 echoes were recorded. Additionally, a 1H-FLASH image (TR=11ms, TE=3.06ms, FA=14°, TA=6min12s, 1mm-iso) was acquired for registration to a 1H-MP2RAGE image (TI=700ms/2700ms, GRAPPA-factor=4, TR=4900ms, TE=2.94ms, TA=6min, FA=5°/6°, 0.9mm-iso, 32-channel head-coil (Nova Medical Inc., Wilmington MA, USA)) for tissue segmentation.
Results
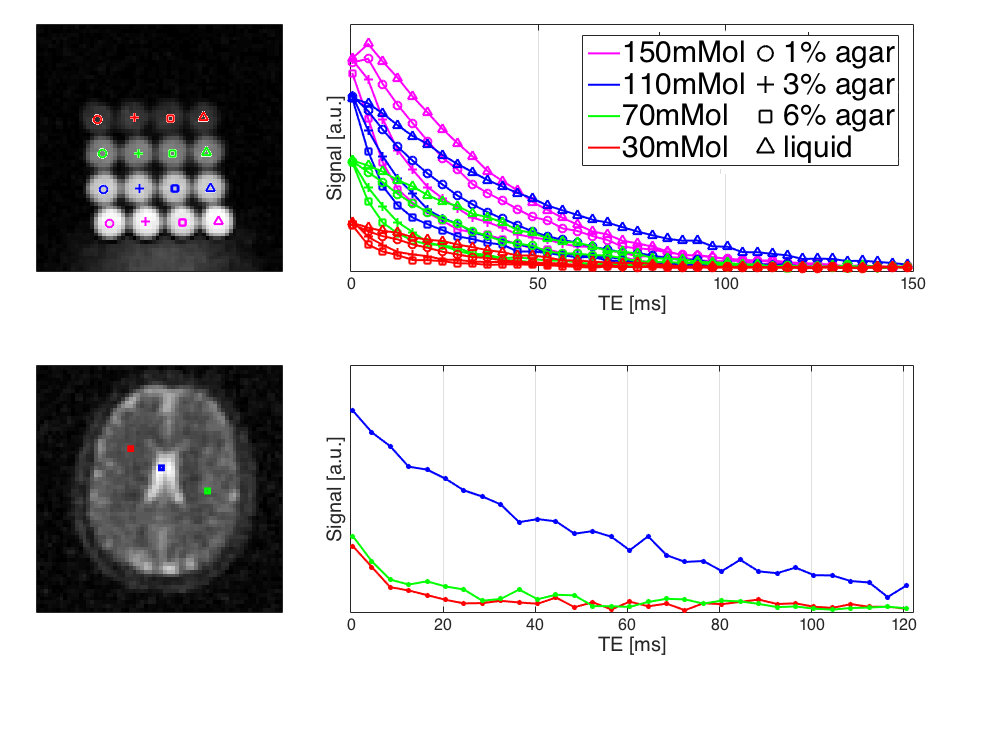
Figure 2 depicts the first 9 echo reconstructions in phantom and in-vivo measurements. TE0 gives the typically acquired sodium-density-weighted image; subsequent TEs show decay behaviour dependent on the media. The phantom echoes reveal faster decay for more solid solutions; in-vivo, CSF and tissue show different signal decay characteristics (Figure 3). The reconstruction of up to 5 signal echoes show tissue contrast above noise level.
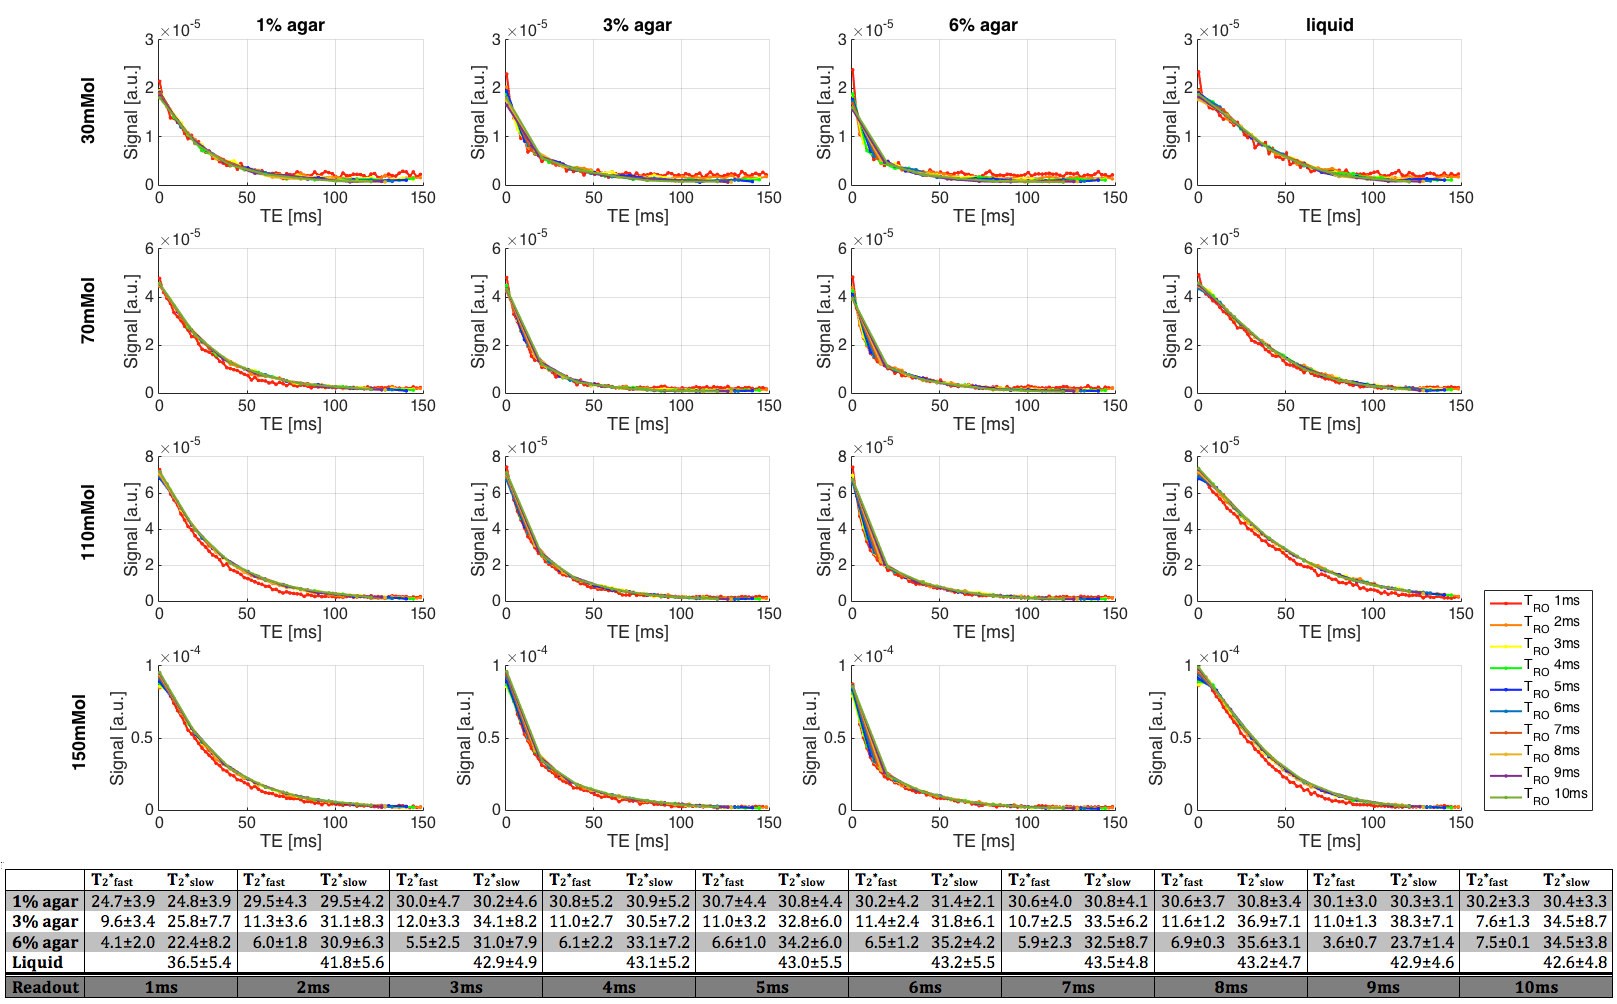
The optimisation of TRO reveals a trade-off between the number of recorded echoes and the acquired bandwidth/sampling point (higher gradients in shorter TRO, constant dwell time). Figure 4 displays the signal decay of the mean signal in each vial at all different TRO. All measurements show very consistent results. However, TRO=1ms decay shows a stronger noise effect. Fitting results of mono- and bi-exponential decays to the liquid and agar-doped phantoms, respectively, indicate an underestimation of the decay parameter in the TRO=1ms measurement due to the lower SNR. Hence, TRO was fixed to 2ms for the in-vivo measurement allowing robust fits while maintaining a high number of echoes. The fitting procedure included an offset to account for noise bias.
The in-vivo decay information was analysed to produce T2*fast and T2*slow component maps (Figure 5) by applying the same bi-exponential fitting routine. Voxel with a T2*slow>30ms were classified as ‘free sodium’ and re-fit by a mono-exponential decay. The ‘free sodium’ mask showed good agreement with the CSF mask segmentation obtained from the MP2RAGE image (bottom row Figure 5). Mean fitting parameters for T2*slow and T2*fast for segmented brain tissue regions were in agreement with reported values5,6,7,14.
Discussion and Conclusion
This work demonstrated the application and analysis of 3D Multi-Echo Radial Imaging in 23NA (3D-MERINA) allowing for a more efficient use of measurement time. The effect of TRO investigated; at an optimised TRO of 2ms, the analysis of CSF and brain tissue showed 29 and 5 echo signals above noise level, respectively. Potential SNR enhancement through the use of T2*-corrected averaging of these additional signals will be investigated in the future.
Phantom and in-vivo measurements revealed additional information in the analysis of later TEs offering the inference of details about the underlying media and, hence, potentially featuring similar contrast as achieved in multi-quantum filtered 23Na-MRI8,9, or double-echo bi-exponentially weighted 23NA imaging10,11. The analysis of multi-echo signal decay data furthermore provides T2* maps; through fast 3D radial acquisition T2*slow and T2*fast components were detected. It should be noted that these additional contrasts were achieved in a standard sodium-density-weighted acquisition time-frame with relatively low SAR due to single 90°-RF-pulses.
Enhanced PSF and SNR are anticipated through the application of density-adapted radial trajectories12,13.
Acknowledgements
We acknowledge the facilities, and the scientific and technical assistance of the Australian National Imaging Facility at the Melbourne Brain Centre Imaging Unit. The work was also supported by a research collaboration agreement with Siemens Healthcare. The MP2RAGE data was acquired with a prototype sequence provided by Siemens Healthcare.
Jon Cleary is funded by a University of Melbourne McKenzie fellowship.
References
[1] Schepkin V D, Chenevert T L, Kuszpit K, et al. Sodium and Proton Diffusion MRI as Biomarkers for Early Therapeutic Response in Subcutaneous Tumors. Magn Reson Imaging. 2006;24(3):273-278.
[2] Thulborn K R, Gindin T S, Davis D, et al. Comprehensive MR Imaging Protocol for Stroke Management: Tissue Sodium Concentration as a Measure of Tissue Viability in Nonhuman Primate Studies and in Clinical Studies. Radiology. 1999;213(1):156-166.
[3] Ouwerkerk R, Bleich K B, Gillen, et al. Tissue Sodium Concentration in Human Brain Tumors as Measured with 23Na MR Imaging. Radiology. 2003;227(2):529-537.
[4] Saff E B, & Kuijlaars A B. Distributing Many Points on a Sphere. Math Intell. 1997;19(1):5-11.
[5] Bartha, R, & Menon R S. Long Component Time Constant of 23Na T* 2 Relaxation in Healthy Human Brain. Magn Reson Med. 2004;52(2):407-410.
[6] Fleysher L, Oesingmann N, Stoeckel B., et al. Sodium Long-Component T* 2 Mapping in Human Brain at 7 Tesla. Magn Reson Med. 2009;62(5):1338-1341.
[7] Madelin G, Lee J S, Regatte R R, et al. Sodium MRI: Methods and Applications. Prog Nucl Mag Res Sp. 2014;79:14
[8] Fiege D P, Romanzetti S, Mirkes C C, et al. Simultaneous Single-Quantum and Triple-Quantum-Filtered MRI of 23Na (SISTINA). Magn Reson Med. 2013;69(6):1691-1696.
[9] Tsang A, Stobbe R W, & Beaulieu C. Triple-Quantum-Filtered Sodium Imaging of the Human Brain at 4.7 T. Magn Reson Med. 2012;67(6):1633-1643.
[10] Qian Y, Panigrahy A, Laymon C M, et al. Short-T2 Imaging for Quantifying Concentration of Sodium (23Na) of Bi-exponential T2 Relaxation. Magn Reson Med. 2015;74(1):162-174.
[11] Benkhedah N, Bachert P, & Nagel A M. Two-Pulse Biexponential-Weighted 23 Na Imaging. J Magn Reson. 2014;240:67-76.
[12] Nagel A M, Laun F B, Weber M A, et al. Sodium MRI Using a Density-Adapted 3D Radial Acquisition Technique. Magn Reson Med. 2009;62(6):1565-1573.
[13] Romanzetti S, Mirkes C C, Fiege D P, et al. Mapping Tissue Sodium Concentration in the Human Brain: a Comparison of MR Sequences at 9.4 Tesla. Neuroimage. 2014;96:44-53.
[14] Ra J B, Hilal S K & Cho Z H. A Method for In Vivo MR Imaging of the Short T2 Component of Sodium-23. Magn Reson Med. 1986;3(2):296-302.
[15] Paling D, Solanky B S, Riemer F, et al. Sodium Accumulation is Associated with Disability and a Progressive Course in Multiple Sclerosis. Brain. 2013;136(7):2305-2317.
Figures
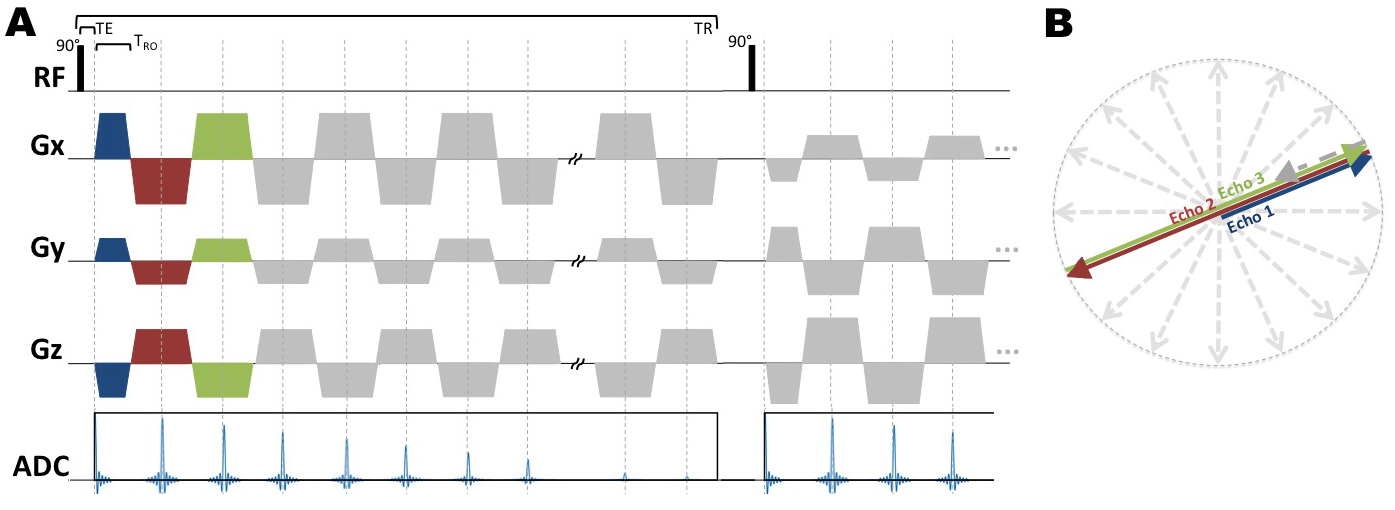
A: Pulse-sequence diagram of 3D-MERINA. First echo is acquired as half-projection, subsequent echos sampled as full-projections along the same angle. Echo acquisition is stretched over full TR. The number of detectable echos depends on TRO (at TR of 160ms: 75 echos for TRO=1ms, 7 echos for TRO=10ms).
B: Simplified 2D illustration of radial echo sampling.
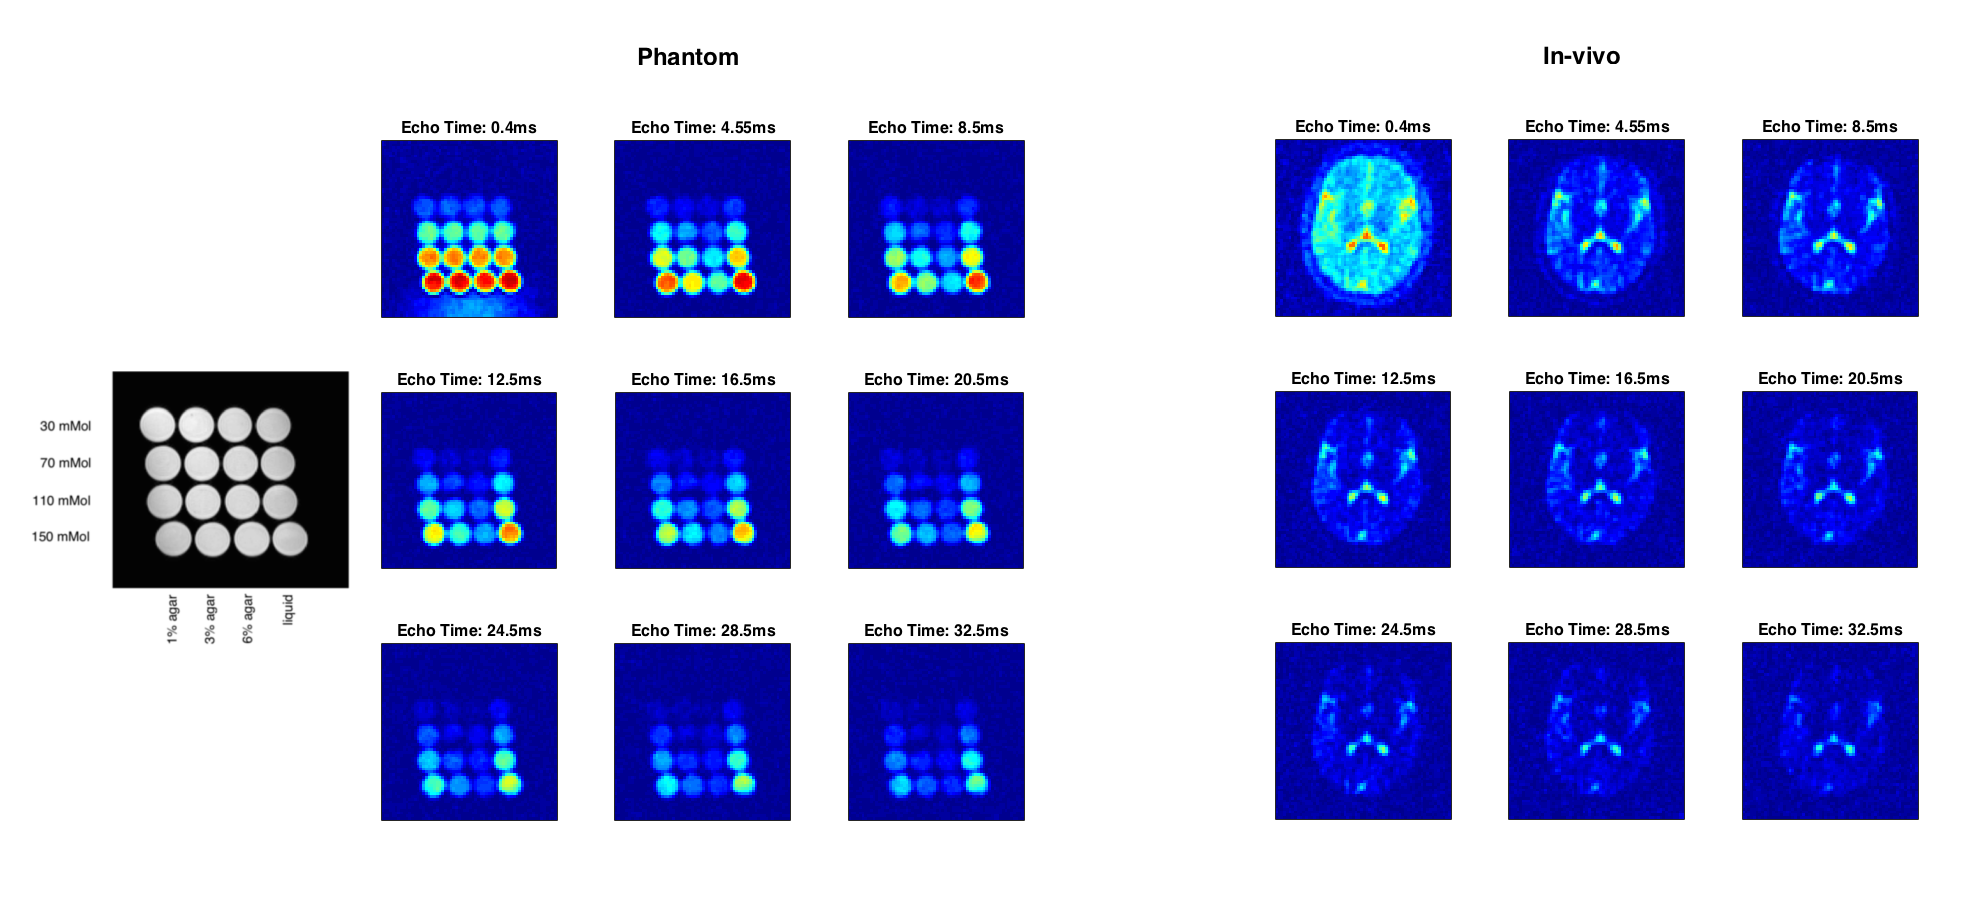
Reconstruction of first 9 echos of phantom and in-vivo measurements (TRO=2ms). The 1H-weighted FLASH image on the left indicates composition of individual phantom vials.
The initial echo (TE0=0.4ms) depicts the sodium-density weighted image, subsequent TE reconstructions reveal characteristics of the media. The signal below the phantom in the TE0 reconstruction originated from the cushion utilised for stabilisation.
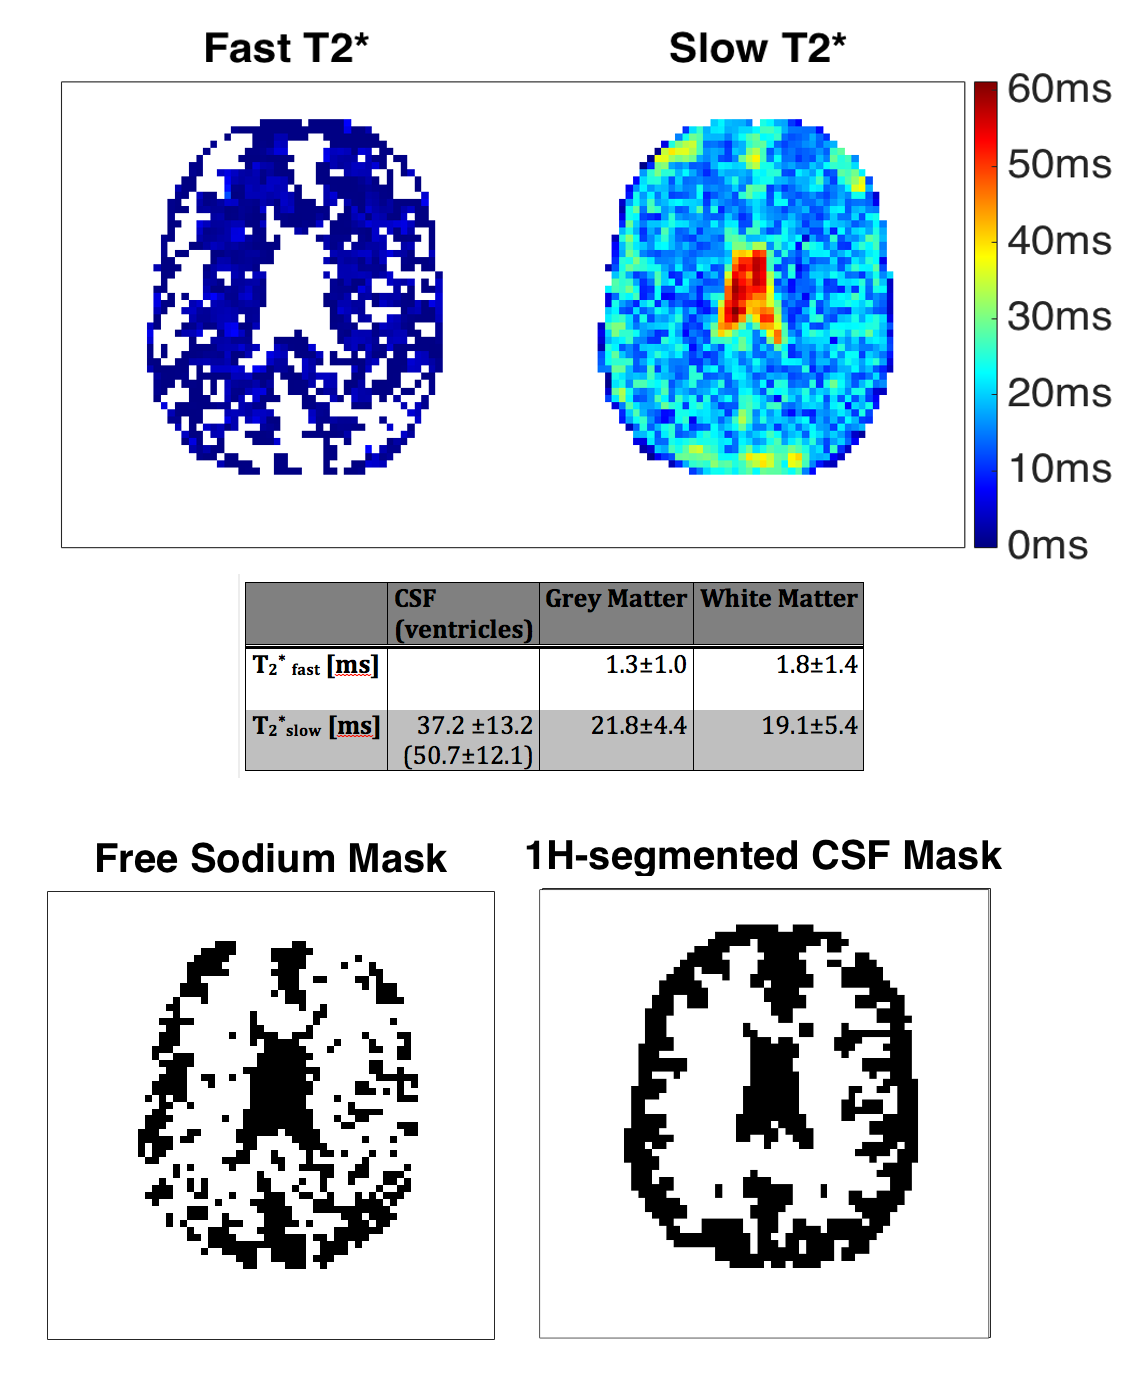
Upper row: In-vivo T2* maps with mean fitting parameter for segmented tissue shown in table underneath. For slow decaying voxel (T2*>30ms) mono-exponential fits were applied and the respective voxel was classified as 'free sodium'. 'Holes' in the T2*fast map indicate areas with only slow mono-exponential decay characteristics, i.e. no fast decaying component.
Bottom row: 'Free sodium' mask shows good agreement with CSF segmentation from MP2RAGE 1H-weighted image.