2956
Proof of concept for the separation of free and bound sodium in human brain through two-TE acquisitions at 3T1Radiology, New York University, New York, NY, United States, 2Siemens Medical Solutions USA, New York, NY, United States
Synopsis
In human brain, intracellular sodium ions (Na+) are in slow and restricted motion due to their binding to negatively-charged macromolecules while their extracellular counterparts are in fast and unrestricted motion. This difference in motion properties leads to changes in bi-exponential transverse decay of free and bound sodium ions, which have been explored previously as a means to separate free and bound sodium. In this study, a new approach is proposed to separate free and bound sodium using single-quantum sodium images, without the SNR and SAR limitations as encountered in the triple-quantum filtering approach.
INTRODUCTION
In human brain, intracellular sodium ions (Na+) exhibit slow and restricted motion due to their binding to negatively-charged macromolecules while the vast majority of their extracellular counterparts experience fast and unrestricted motion.1 This difference in motion properties for intra/extracellular sodium ions leads to changes in their bi-exponential transverse decay, which have been explored previously as a means to separate intra and extracellular components of brain sodium signal.2 Separation of free
and bound sodium signal is, therefore, a key technical hurdle for the quantification of
intracellular sodium concentration and its application for the study of cell ion homeostasis during pathologies such as brain tumors, multiple sclerosis (MS), epilepsy, bipolar disorder, and mild traumatic brain injury (mTBI). Current approaches, such as triple-quantum
filtering (TQF),3 inversion recovery (IR),4 and short-T2
imaging (sT2),5 are challenging in a clinical
setting because of their low signal-to-noise ratio (SNR), large specific absorption
rate (SAR), and/or incomplete suppression of free
sodium signal. In this study, we demonstrate a new approach for the separation of free and bound sodium through the use of a robust, of pixel-wise relaxographic analysis. Our initial results demonstrate good concordance with the results obtained using TQF techniques, albeit without their SNR and SAR limitations. METHODS
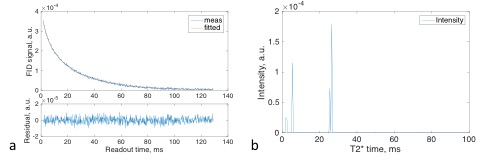
Bound sodium nuclei have a bi-exponential T2 decay in tissue with 60% of the signal decaying through a short component (T2bs ~3ms) and 40% through a long component (T2bl ~25ms). Free sodium, on the other hand, exhibits a mono-exponential T2 decay (T2fr ≥ T2bl) (Eq. 1).1 We hypothesize that this distinct behavior in T2 decay may be used to separate free and bound sodium using single-quantum sodium (23Na) images of multiple echo times (TE). Eq. 2 details our approach for two TEs, where α and β are signal intensities of free and bound sodium at a voxel, which are to be determined using SQ images acquired at "pre-optimized" echo times TE1 and TE2. In our implementation, T2 decay is replaced with T2* decay and the values of (T2*fr, T2*bs, T2*bl) are estimated from a separate FID acquisition on whole brain. After separation, α and β are converted voxel-by-voxel into volume-fraction-weighted sodium concentrations, vfrCfr and vbdCbd, where vfr+vbd=1, through an integrated calibration.5 In addition, total sodium concentration, CTotal, is calculated from total signal intensity at a voxel, namely α+β.
Eq. [1a] $$$Y_{bd}(t)=0.6exp(-t/T_{2bs})+0.4exp(-t/T_{2bl})$$$
Eq. [1b] $$$Y_{fr}(t)=1.0exp(-t/T_{2fr})$$$.
Eq. [2a] $$$y(r,t)=\alpha(r)Y_{fr}(t)+\beta(r)Y_{bd}(t)$$$.
Eq. [2b] $$$\bf \it y=Fx$$$, with $$$\alpha\geq0$$$, $$$\beta\geq0$$$.
Eq. [2c] $$$\bf \it y\equiv\left(\begin{array}{c}y(TE1)\\y(TE2)\end{array}\right)$$$, $$$\bf \it x\equiv\left(\begin{array}{c}\alpha\\\beta\end{array}\right)$$$, $$$\bf \it F\equiv\left(\begin{array}{c}Y_{fr}(TE1),\ Y_{bd}(TE1) \\Y_{fr}(TE2),\ Y_{bd}(TE2)\end{array}\right)$$$.
EXPERIMENTS
Sodium MRI scans were performed on phantoms and human
subjects on clinical scanners at 3T; a Magnetom Prisma (Siemens Healthcare) using a custom-built 8-channel
dual-tuned 1H-23Na Tx/Rx head coil,6 and a Magnetom Tim
Trio (Siemens Healthcare) using a commercial dual-tuned 1H-23Na volume head
coil (Advanced Imaging Research Inc., Cleveland)). In the phantom study, three 10% w/w agar tubes of sodium concentrations 90-150mM and one saline water tube of 150mM
sodium were used. In the human study, seven patients (2 bipolar, 3 epilepsy, 1
MS, and 1 mTBI; age 33±16yr in 18-59yr; 3/4 M/F)
were scanned, with an approved IRB. The twisted projection imaging (TPI)
sequence 7 was used for maximizing SNR, with FOV=220mm, matrix
size=64, 3D isotropic, TR=100ms, TE1/TE2=0.5/5ms, θ=90°, averages=8 (subjects) or 4 (phantoms), and
TA=99sec (1 TE-image at 1 average). The images were reconstructed offline with
custom-developed programs in C++. The separation was performed in MATLAB
(R2015b, The MathWorks) using the non-negative least squares (NNLS) algorithm.8
After corrections for B1+/- inhomogeneity associated with the array coil, a
calibration factor was determined using an internal marker of vitreous fluid at
145mM.9RESULTS AND DISCUSSION
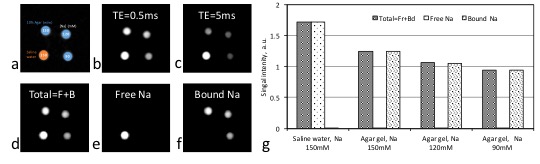
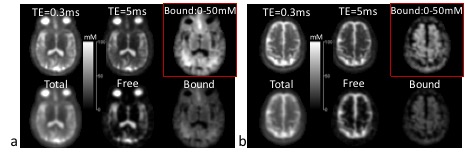
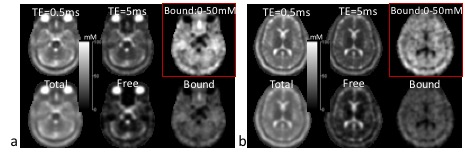
Fig. 1 shows the FID signal and T2* spectrum from a subject’s brain, and demonstrates the feasibility of estimating values of (T2*fr, T2*bs, T2*bl) in human brain. Fig. 2 shows the images of free and bound sodium in the phantoms. These demonstrated that high separation accuracy can be achieved for the free (99.9%) and bound (99.8%) sodium components. Figs. 3 and 4 are two representative results from the patient study, that provide further evidence of the accurate separation of free sodium in the vitreous fluid (99.5±0.9%) and ventricle CSF (96.9±2.4%) in the free sodium images, in contrast to 0.5±0.9% and 3.1±2.3% in the bound sodium images. These results collectively demonstrated evidence for the feasibility of our approach for the separation of free and bound sodium in human brain.Acknowledgements
This work was financially supported in part by NIH grants R01 MH088370, R01 CA111996 and R01NS082436.References
1. Jaccard G, Wimperis S, Bodenhausen G. Multiple-quantum NMR spectroscopy of S=3/2 spins in isotropic phase: A new probe for multiexponential relaxation. J Chem Phys 1986; 85: 6282-6293.
2. Winter PM, Bansal N. Triple-quantum-filtered 23Na NMR spectroscopy of subcutaneously implanted 9L gliosarcoma in the rat in the presence of TmDOTP5-. J Magn Reson 2001; 152:70-78.
3. Hancu I, Boada FE, Shen GX. Three-dimensional triple-quantum-filtered (23)Na imaging of in vivo human brain . Magn Reson Med. 1999 Dec;42(6):1146-54.
4. Kline RP, Wu EX, Petrylak DP, Szabolcs M, Alderson PO, Weisfidt ML, Cannon P, Katz J. Rapid in vivo monitoring of chemotherapeutic response using weighted sodium magnetic resonance imaging. Clin Cancer Res 2000; 6:2146-2156.
5. Qian Y, Panigrahy A, Laymon CM, Lee VK, Drappatz J, Lieberman FS, Boada FE, Mountz JM. Short-T2 imaging for quantifying concentration of sodium (23 Na) of bi-exponential T2 relaxation. Magn Reson Med 2015; 74:162-174.
6. Wiggins GC, Brown R, Lakshmanan K. High-performance radiofrequency coils for (23)Na MRI: brain and musculoskeletal applications NMR Biomed 2016; 29(2):96-106.
7. Boada FE, Gillen JS, Shen GX, Chang SY, Thulborn KR. Fast three dimensional sodium imaging. Magn Reson Med 1997; 37:706–715.
8. Lawson CL, Hanson RJ. Solving least squares problems. Prentice-Hall, 1974, Chapter 23, p. 161.
9. Kokavec J, Min SH, Tan MH, et al. Biochemical analysis of the living human vitreous. Clin Exp Ophthalmol 2016; 44(7):597-609.
Figures