2954
Quantification of Cerebral Metabolic Rates of 17O-Labeled Glucose in Mouse Brain with Dynamic 17O-MRS1Dept. of Radiology, Medical Physics, Medical Center-University of Freiburg, Germany, Freiburg, Germany, 2German Cancer Consortium (DKTK), Heidelberg, Germany, Heidelberg, Germany, 3German Cancer Research Center (DKFZ), Heidelberg, Germany, Heidelberg, Germany, 4NUKEM Isotopes Imaging GmbH, 5Bruker BioSpin GmbH, 6Faculty of Medicine, University of Tübingen, Germany, 7Institute of Physics, University of Freiburg, Germany
Synopsis
We studied the chemical exchange kinetics of 17O-labeled glucose at the C1 and the C6 position with dynamic 17O-MRS. A profile likelihood analysis is performed to determine identifiability and confidence intervals of the metabolic rate CMRGlc. The exchange experiments confirm that the C6-17OH label is transferred via glycolysis exclusively by the enzyme enolase into the metabolic end product H217O, while C1-17OH ends up in water via direct hydrolysis as well as via glycolysis. From H217O-concentration time-courses cerebral metabolic rates of CMRGlc = 0.05‑0.08 µmol/g/min are obtained which are in of the same order of magnitude as 18F-FDG PET.
Introduction
Malignant
tumors predominately gain energy by anaerobic glycolysis 1. Currently, the clinical gold standard to assess glucose metabolism is
positron emission tomography (PET) which uses the radioactively labeled [18F]-fluordeoxyglucose
(FDG). Recently, we have performed dynamic 17O-MRS of 17O-labeled
glucose for the first time to follow up glycolysis in mouse brain 2.
The purpose of this study was to further investigate
the dynamics of glucose labeled with 17O at the C1 (Glc-1, 68 %
labeled) and the C6 position (Glc-6, 43 % labeled) in vivo using dynamic 17O-MRS at ultra-high field. Two
representative in vivo Glc-6 data sets were acquired as described in 2, and profile likelihood analysis (PL) was performed 3–6 to reliably determine metabolic rates of
glucose consumption (CMRGlc) from the recorded time dependent course
of the H217O resonances using a pharmacokinetic model.Material and Methods
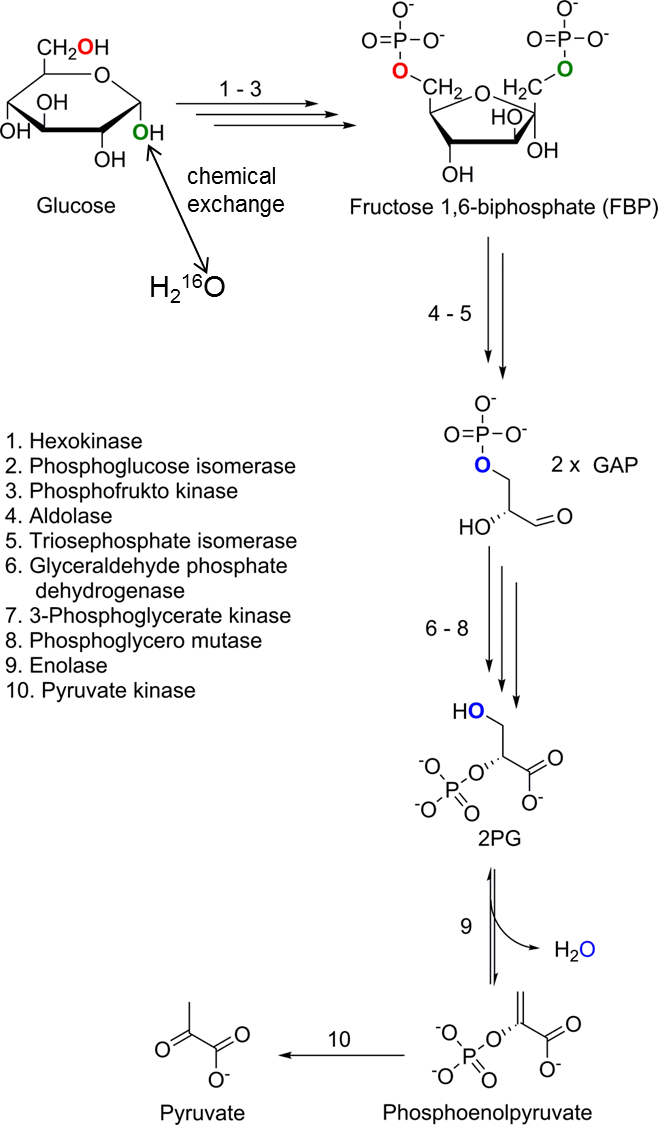
The 1-OH group at the anomeric C1 carbon of glucose (Glc-1) undergoes a known temperature and pH-dependent and concentration-independent chemical exchange with unlabeled water in aqueous solution7,8. Under physiological conditions the OH-group at the C6 position (Glc-6) cannot be replaced via chemical exchange in aqueous solutions, and no enzyme-catalyzed reaction is reported in the literature to substitute the C6-OH group in mammalians. However, recently we could show2 that the C6-OH label is transferred in the glycolytic downstream by the enzyme enolase into the metabolic end product H217O (Figure 1).
Exchange Measurements
To corroborate exchange dynamics, in a phantom experiment two 55 mM aqueous solutions of Glc-1 and Glc‑6 dissolved in phosphate-buffered saline PBS (pH = 7.4, Sigma Aldrich) were prepared. Dynamic 17O-MRS was performed of the solutions with a 500 MHz spectrometer (Avance III 500, Bruker Biospin) over up to 200 min. Each spectrum was measured with an FID sequence at a body temperature (37°C) with the following parameters: 90°-pulse duration Tpulse = 21.5 µs, acquisition delay 10 µs, TE = 21 µs, TR = 50 ms, spectral band width BW = 31.25 kHz (461 ppm). Within the acquisition time of Tacq = 33 ms each FID was sampled with 2048 points and a dwell time of 16 µs. In total, 1024 FID signals were averaged per spectrum resulting in a measurement time of 1 min.
Model Fit and Profile Likelihood Analysis
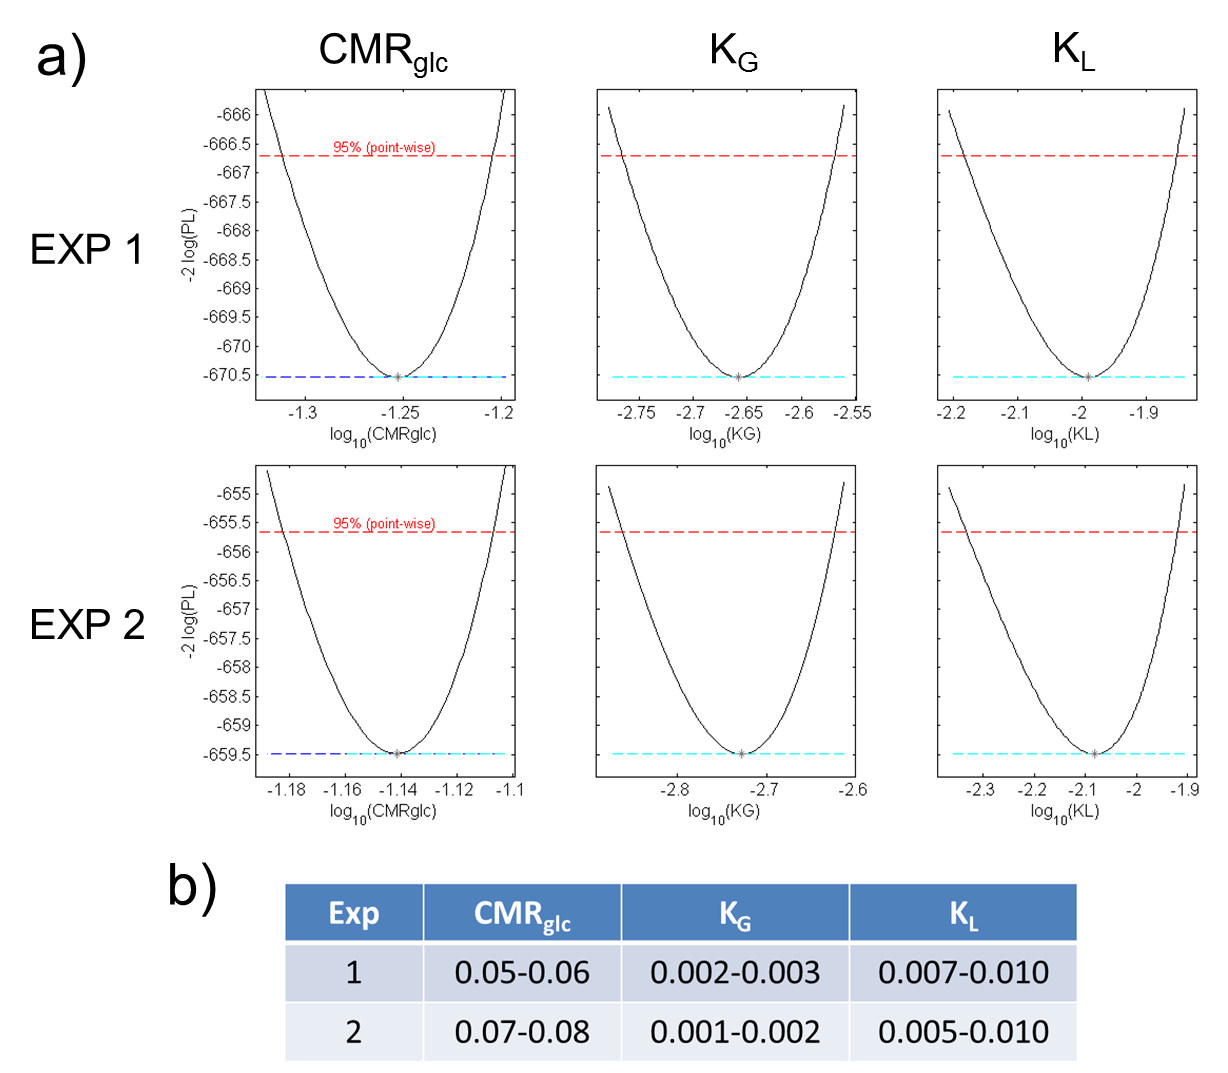
With the exchange rates of the phantom experiments it was investigated whether CMRGlc can be reliably determined from dynamic 17O MRS data. For this, a pharmacokinetic model was used 9 that requires an input function with model parameters α and ρ. These parameters were estimated from glucose tolerance tests 10 in mice after intravenous injection of unlabeled glucose. A profile likelihood analysis was then performed to assess whether CMRGlc can be determined reliably from the time course of the H217O-resonances; for this, it was considered that 1mol Glc-6 is converted into 1mol H217O during glucose metabolism.
Results and Discussion
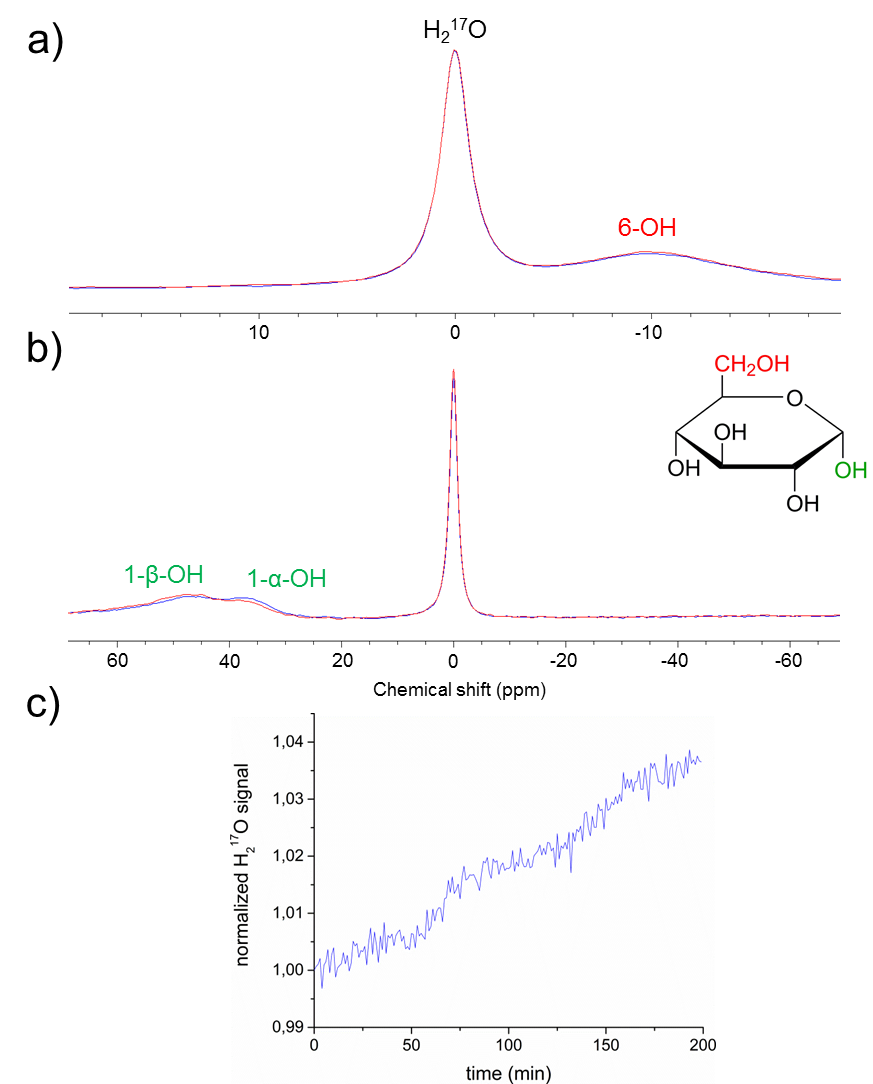
In
the dynamic Glc-6 experiment (Figure 2a) neither a signal increase of the H217O-resonance
nor a decrease of the 6-OH resonance is observed which proves that exchange of
hydroxyl groups at C-6 is kinetically inhibited, whereas in the Glc-1 exchange
experiment (Figure 2b,c) a signal increase of 3.5 % is observed within
a measurement time of 200 min. Thus, the C6-OH label will show up in water in vivo via glycolysis exclusively, while C1-OH ends up in H217O
via either direct hydrolysis or glycolysis. Moreover this result indicates that
the in vivo conversion rate of Glc-1
into H217O due to chemical exchange with water in blood
is expected to be less than the metabolic rate 2.
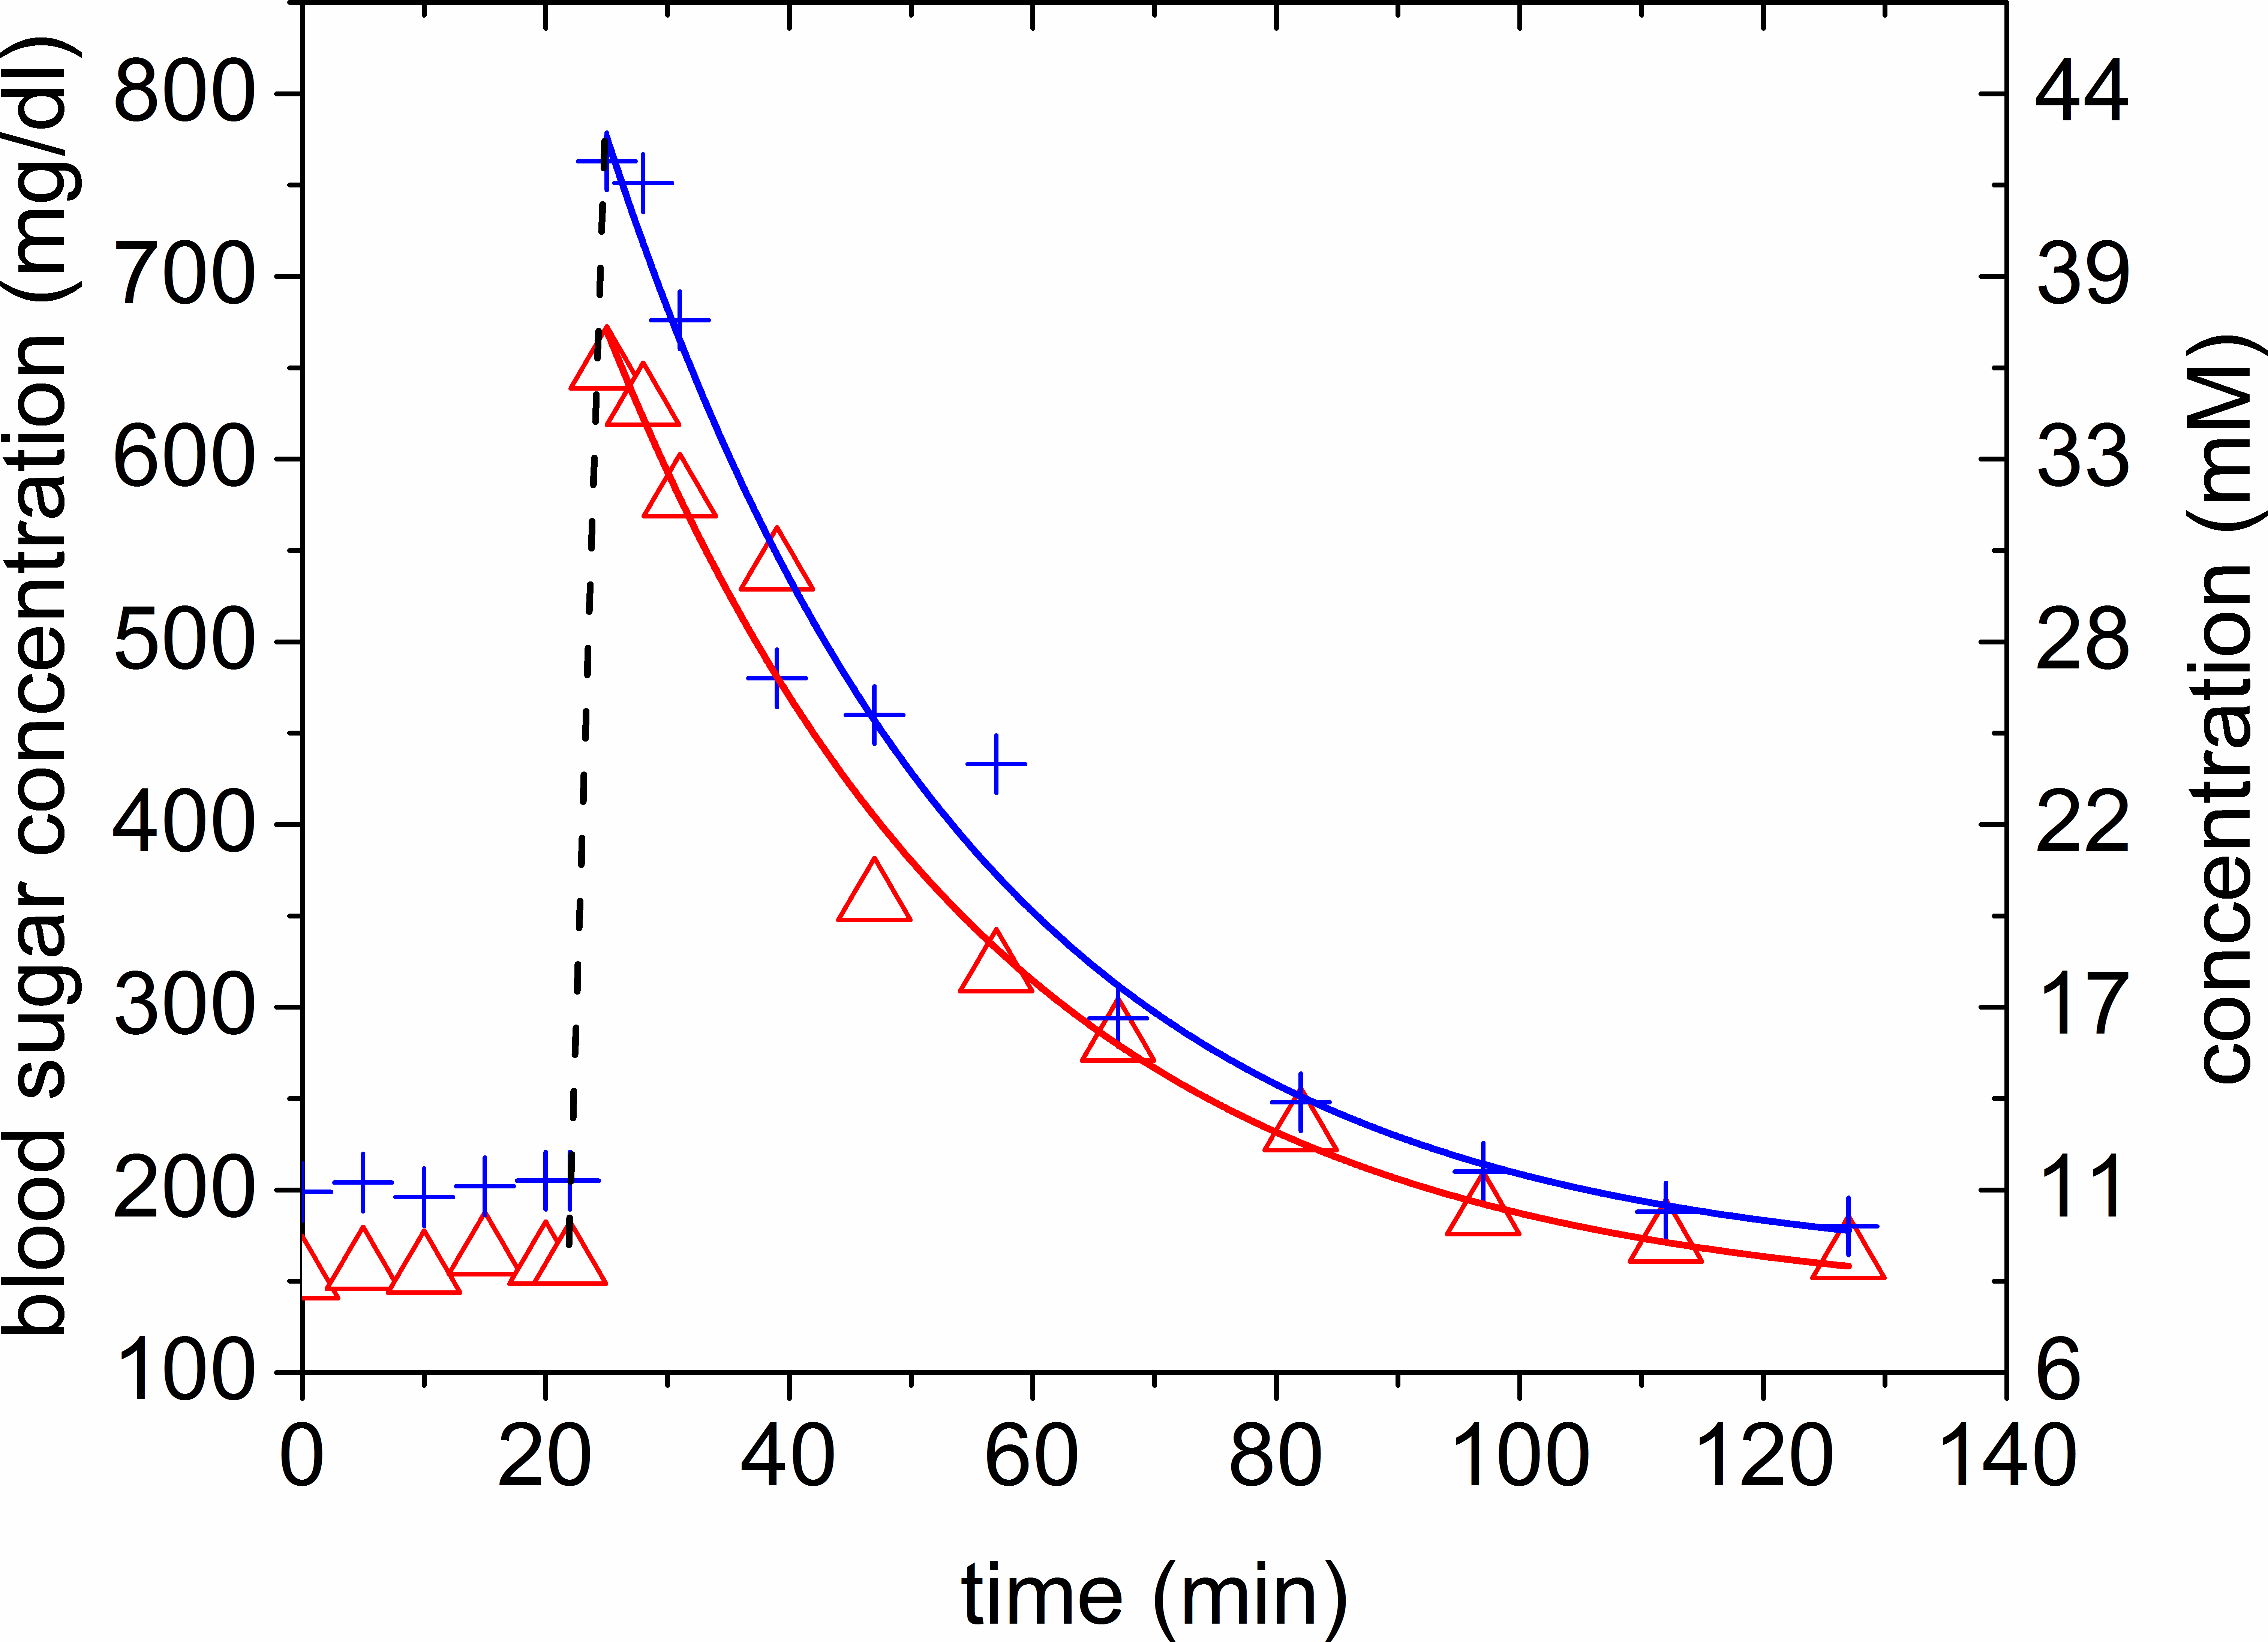
As
described in 11, α was estimated to 0.32 from the Glc-6 enrichment
k = 43 %, the baseline and maximum concentration of the blood
sugar measurements. The exponential fit to the blood sugar measurement yielded
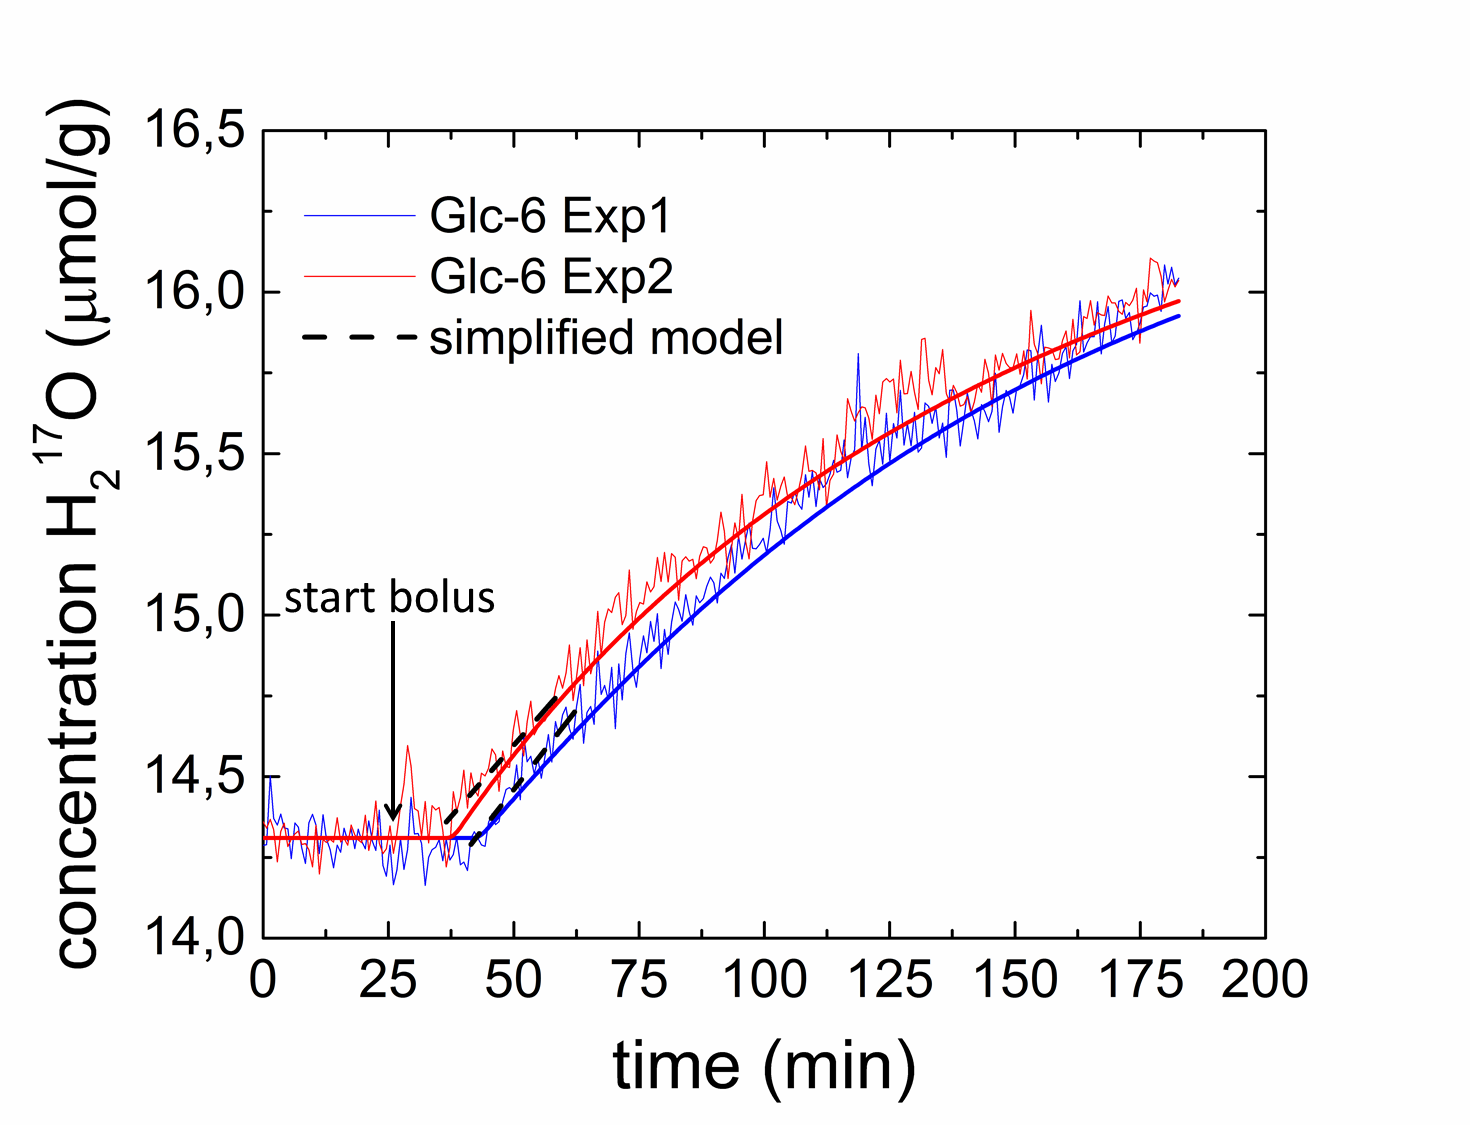
ρ-values of 0.033 /0.031 min-1 (Figure 3). In the PL analysis
CMRGlc rates in the range of 0.05‑0.08 µmol/g/min were obtained (Fig. 5a,b) from the
H217O-concentration-time courses (Figure 4). Note that similar
metabolic rates of CMRGlc = 0.06 µmol/g/min are obtained
using a simplified model as proposed in 12. The deviations from the literature value 13 0.26 ± 0.10
µmol/g/min (18F-FDG PET, mouse,
1.0 % isoflurane anaesthesia) might be due to imperfections of the pharmacokinetic model and
uncertainties of α and ρ-values.
Outlook
Although 17O-labeled glucose is
currently less cost-effective than enriched 13C-glucose, oxygen-17 is
a promising tracer to investigate novel metabolic pathways, which might provide
enhanced sensitivity compared to established 13C-MRS methods 14. In a
future step dynamic 17O-MRS will be applied in a mouse model to
monitor the glucose turnover in tumors.Acknowledgements
Support from NUKEM Isotopes Imaging GmbH is gratefully acknowledgedReferences
1. O. Warburg, On the origin of cancer cells, Science. 123 (1956) 309–314.
2. R. Borowiak, R. Wilfried,
D. Kurzhunov, C. Schuch, J. Leupold, T. Lange, M. Reisert, A. Krafft, E. Fischer, M. Bock, Initial investigation of
glucose metabolism in mouse brain using 17O-glucose and dynamic 17O-MRS, In
proceedings of 24rd Annunal Meeting of ISMRM Singapore 2015, p. 3964.
3. D. Kurzhunov, R. Borowiak, H. Hass, P. Wagner, A.J. Krafft, J. Timmer, M. Bock, Quantification of oxygen metabolic rates in Human brain with dynamic 17O MRI: Profile likelihood analysis, Magn. Reson. Med. 2017.
4. A. Raue, C. Kreutz, T. Maiwald, J. Bachmann, M. Schilling, U. Klingmüller, J. Timmer, Structural and practical identifiability analysis of partially observed dynamical models by exploiting the profile likelihood, Bioinformatics. 25 (2009) 1923–1929.
5. A. Raue, B. Steiert, M. Schelker, C. Kreutz, T. Maiwald, H. Hass, J. Vanlier, C. Tönsing, L. Adlung, R. Engesser, W. Mader, T. Heinemann, J. Hasenauer, M. Schilling, T. Höfer, E. Klipp, F. Theis, U. Klingmüller, B. Schöberl, J. Timmer, Data2Dynamics: a modeling environment tailored to parameter estimation in dynamical systems, Bioinformatics. 31 (2015) 3558–3560.
6. A.C. Hindmarsh, P.N. Brown, K.E. Grant, S.L. Lee, R. Serban, D.E. Shumaker, C.S. Woodward, SUNDIALS: Suite of nonlinear and differential/algebraic equation solvers, ACM Trans Math Softw. 31 (2005) 363–396.
7. J.M. Risley, R.L. Van Etten, Kinetics of oxygen exchange at the anomeric carbon atom of D-glucose and D-erythrose using the oxygen-18 isotope effect in carbon-13 nuclear magnetic resonance spectroscopy, Biochemistry (Mosc.). 21 (1982) 6360–6365.
8. T.L. Mega, S. Cortes, R.L. Van Etten, The oxygen-18 isotope shift in carbon-13 nuclear magnetic resonance spectroscopy. 13. oxygen exchange at the anomeric carbon of D-glucose, D-mannose, and D-fructose, J. Org. Chem. 55 (1990) 522–528.
9. I.C. Atkinson, K.R. Thulborn, Feasibility of mapping the tissue mass corrected bioscale of cerebral metabolic rate of oxygen consumption using 17-oxygen and 23-sodium MR imaging in a human brain at 9.4 T, NeuroImage. 51 (2010) 723–733.
10. S. Andrikopoulos, A.R. Blair, N. Deluca, B.C. Fam, J. Proietto, Evaluating the glucose tolerance test in mice, Am. J. Physiol. - Endocrinol. Metab. 295 (2008) E1323–E1332.
11. S.M. Fitzpatrick, H.P. Hetherington, K.L. Behar, R.G. Shulman, The flux from glucose to glutamate in the rat brain in vivo as determined by 1H-observed, 13C-edited NMR spectroscopy, J. Cereb. Blood Flow Metab. 10 (1990) 170–179.
12. N. Zhang, X.-H. Zhu, H. Lei, K. Ugurbil, W. Chen, Simplified Methods for Calculating Cerebral Metabolic Rate of Oxygen Based on 17O Magnetic Resonance Spectroscopic Imaging Measurement during a Short 17O2 Inhalation, J. Cereb. Blood Flow Metab. 24 (2004) 840–848.
13. H. Toyama, M. Ichise, J.-S. Liow, K.J. Modell, D.C. Vines, T. Esaki, M. Cook, J. Seidel, L. Sokoloff, M.V. Green, R.B. Innis, Absolute quantification of regional cerebral glucose utilization in mice by 18F-FDG small animal PET scanning and 2-14C-DG autoradiography, J. Nucl. Med. 45 (2004) 1398–1405.
14. R.A. de Graaf, P.B. Brown, D.L. Rothman, K.L. Behar, Natural abundance 17O NMR spectroscopy of rat brain in vivo, J. Magn. Reson. 193 (2008) 63–67.
Figures