2951
High Resolution Dynamic 31P-MRSI of Ischemia-Reperfusion in Rat Hindlimb at 9.4T Using SPICE1Department of Biomedical Engineering, Case Western Reserve University, Cleveland, OH, United States, 2Case Center for Imaging Research, Case Western Reserve University, Cleveland, OH, United States, 3Beckman Institute for Advanced Science and Technology, University of Illinois at Urbana-Champaign, Urbana, IL, United States, 4Department of Electrical and Computer Engineering, University of Illinois at Urbana-Champaign, Urbana, IL, United States, 5Gordon Center for Medical Imaging, NMMI, Department of Radiology, Massachusetts General Hospital, MA, United States, 6Department of Radiology, Harvard Medical School, MA, United States, 7Department of Radiology, Case Western Reserve University, Cleveland, OH, United States, 8Department of Physiology and Biophysics, Case Western Reserve University, Cleveland, OH, United States
Synopsis
Dynamic 31P-MRSI serves as a non-invasive tool to assess mitochondrial oxidative capacity in skeletal muscle during ischemia-reperfusion or exercise-recovery. However, 31P-MRSI with high spatial resolution requires long acquisition times which render dynamic measurements impractical. In this study, we adapted a recently proposed low-rank tensor-based method for high-resolution dynamic 31P-MRSI in preclinical studies. We present results from an in vivo ischemia-reperfusion experiment on a rat hindlimb with 15 s nominal temporal resolution and 0.75×0.75×1.6 mm3 nominal spatial resolution, demonstrating the potential of the method for assessing mitochondrial function in different muscle types in small animal models.
Introduction
Monitoring the depletion and resynthesis of phosphocreatine (PCr) during ischemia-reperfusion allows the assessment of mitochondrial oxidative capacity in the muscle. Dynamic 31P-MRS/MRSI is often used in ischemia-reperfusion studies to obtain non-invasive measurements of changes in phosphate metabolite concentrations1-3. The major limitation of standard 31P-MRSI methods is their low spatial resolution, which is typically on the order of a cubic centimeter in clinical studies. In small animal models, it is desirable to achieve a resolution of a cubic millimeter to observe the variation between muscle groups. Several methods have been developed to provide increased spatial resolution4-8, but at the cost of reduced temporal resolution, or spectral resolution and bandwidth. To retain the ability to measure mitochondrial oxidative capacity, the temporal resolution must be high enough to measure the PCr recovery rate during reperfusion (typically about 30 s), and estimation of metabolite concentrations and intracellular pH requires a spectral bandwidth/resolution of ~30 ppm/0.1 ppm.
In this work we have adapted a recently proposed low-rank tensor-based method for high-resolution dynamic 31P-MRSI9 to small animal models. We present results from an in vivo experiment on a rat hindlimb (15 s nominal temporal resolution, 0.75×0.75×1.6 mm3 nominal spatial resolution, 37 ppm/0.14 ppm spectral bandwidth/resolution) to demonstrate the potential of the method for observing spatiospectral variation during ischemia-reperfusion.
Methods
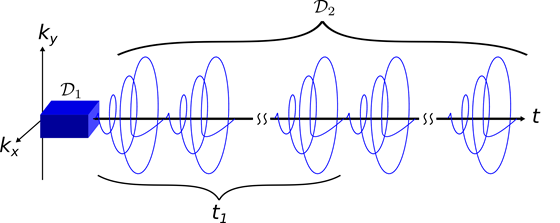
Data Acquisition: Two sets of data, $$$\mathcal{D}_1$$$ and $$$\mathcal{D}_2$$$, were acquired using a SPICE acquisition$$$^{9-11}$$$ shown in Fig. 1. $$$\mathcal{D}_1$$$ was acquired with an 8x8x6 matrix size, 6 kHz readout bandwidth, 256 samples per readout, and 8 averages. $$$\mathcal{D}_2$$$ was acquired with a 16x16x12 matrix size (stack of uniform density spirals), 111.1 kHz readout bandwidth, 3.96 ms echo-spacing, 20 echoes, and 15 averages. For both acquisitions, the FOV was 24x24x20 mm$$$^3$$$, TR/TE was 160/0.69 ms and the flip angle was 17 degrees.The acquisition parameters of $$$\mathcal{D}_1$$$ were designed to ensure it captured the spectral variation in the rat leg at the needed bandwidth and spectral resolution. $$$\mathcal{D}_2$$$ was designed to provide only limited spectral information while capturing the spatial and temporal variation during the ischemia-reperfusion. Taken separately, neither data set contained adequate information, however by fitting the data to the partially separable model as described by Ma et al.$$$^{9}$$$, an image with high spatial, spectral and temporal resolution can be reconstructed.
Data Processing: In this work we performed image reconstruction by solving the following optimization problem:$$\begin{align}\{\hat{\upsilon}_m(\mathbf{x},t)\}_{m=1}^M = &\ \arg\min\limits_{\{\upsilon_m\}_{m=1}^M} \left\Vert \mathbf{d} - \mathcal{F}\left\{ \sum_{m=1}^M \upsilon_{m}\left(\mathrm{x},t\right) \hat{\phi}_m\left(f\right) \right\}\right\Vert_2^2 +\mathrm{R}\left(\{\upsilon_m(\mathbf{x},t)\}_{m=1}^M\right) \\& \mbox{s.t.}\quad \upsilon_m\left(\mathrm{x},t\right) = \sum_{p=1}^{P_m} \mu_{p}\left(x\right) \omega_{p}\left(t\right),\end{align}$$where $$$\mathbf{x}$$$, $$$t$$$, $$$f$$$, are the spatial, temporal, and spectral coordinates, $$$\{\hat{\phi}_m\left(f\right)\}_{m=1}^{M}$$$ is the estimate of spectral subspace obtained from $$$\mathcal{D}_1$$$, $$$\mathcal{F}$$$ is the encoding operator, $$$\mathrm{R}\left(\cdot\right)$$$ is a regularization function which included a smoothness penalty in both space and time, and the model orders $$$M$$$ and $$$\{P_m\}_{m=1}^M$$$ were determined from an SVD-based analysis of the data. The final reconstructed image was then computed as $$$\rho(\mathbf{x},t,f) = \sum_{m=1}^M \hat{\upsilon}_{m}\left(\mathrm{x},t\right) \hat{\phi}_m\left(f\right)$$$.
In vivo MRI Experiments: In vivo data from a rat was acquired on a 9.4T Bruker scanner. The rat was anesthetized and ischemia was induced by inflating a cuff placed around the animal's thigh. A Bruker 1H volume coil was used for shimming and the acquisition of anatomical reference images. A custom-built 31P saddle coil was placed around the calf muscles to acquire MRSI data. $$$\mathcal{D}_1$$$ was acquired at baseline for ~8 min, and $$$\mathcal{D}_2$$$ was acquired during 10 min ischemia and 5 min reperfusion. The total experiment time was approximately 23 minutes.
Results
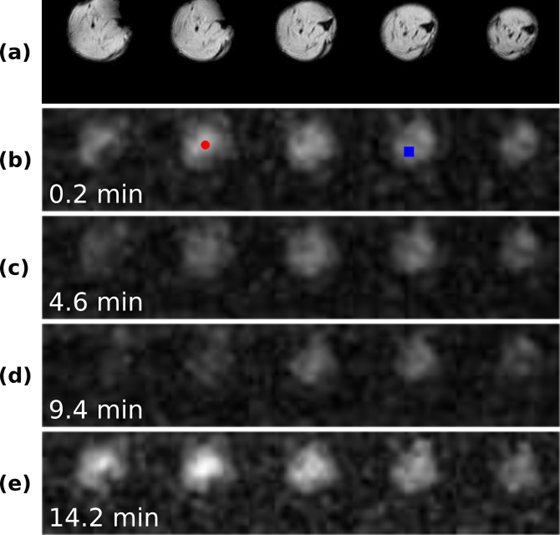
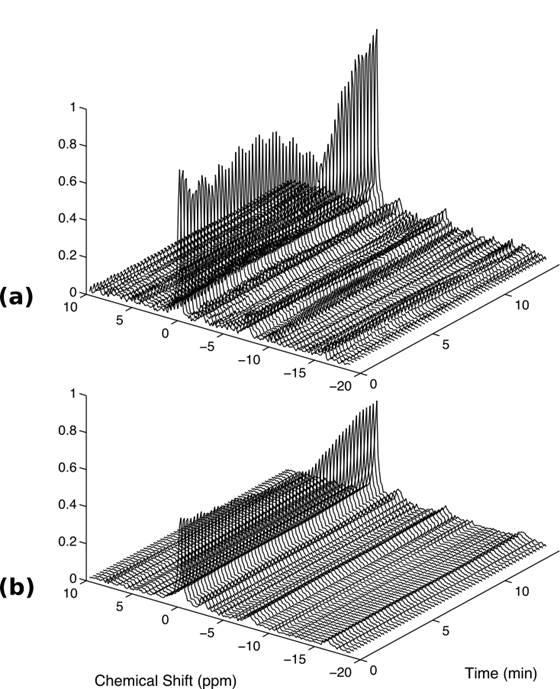
Fig. 2a shows the center five slices of the anatomical reference images of the rat leg. The corresponding PCr maps during ischemia (Figs. 2b-d) and reperfusion (Fig. 2e) shows that PCr pool was significantly reduced during ischemia and rapidly replenished upon reperfusion. Dynamic spectra from two pixels in different muscle groups showed varied kinetics during ischemia-reperfusion (Fig. 3). These results demonstrate that our method was able to capture both the temporal dynamics and spatial variation of the image while maintaining good spectral quality. The dynamic behavior of the PCr spatiospectral distribution agrees well with previous experiments reported in the literature1-3.Conclusions
We have applied a recently proposed 3D dynamic 31P-MRSI method for observing the changes in phosphate metabolites in a rat hindlimb with high spatial resolution. Preliminary results demonstrate the potential of this method to provide an unprecedented combination of SNR, spatial, and temporal resolution for in vivo quantification of PCr depletion and recovery during ischemia-reperfusion. Combined with appropriate quantification techniques, this method may allow the assessment of the heterogeneity in mitochondrial oxidative capacity in rodent models of various metabolic diseases.Acknowledgements
This work was supported in part by the National Institutes of Health (NIH-1RO1- EB013695, NIH-R21EB021013-01, and NIH-R21HL126215).References
1. S. Morikawa, C. Kido, and T. Inubushi, Observation of rat hind limb skeletal muscle during arterial occlusion and reperfusion by 31P MRS and 1H MRI. Man. Reason. Imag. 1991; 9:269-274.
2. S. Morikawa, T. Inubushi, and K. Kito, Heterogeneous metabolic changes in the calf muscle of the rat during ischemia-reperfusion: in vivo analysis by 31P nuclear magnetic resonance chemical shift imaging and 1H magnetic resonance imaging. Cardiovasc. Surg. 1993; 1:337-342.
3. Y. Liu, X. Mei, J. Li, N. Lai, and X. Yu, Mitochondrial function assessed by 31P MRS and BOLD MRI in non-obese type 2 diabetic rats. Physiol. Rep. 2016; 4(15): 12890
4. S. C. Forbes, J. M. Slade, R. M. Francis, and R. A. Meyer, Comparison of oxidative capacity among leg muscles in humans using gated 31P 2-D chemical shift imaging. 2009; 22:1063-1071.
5. R. L. Greenman, X. Wang, and H. A. Smithline, Simultaneous acquisition of phosphocreatine and inorganic phosphate images for Pi:PCr ratio mapping using a RARE sequence with chemically selective interleaving. Magn. Reson. Imag. 2011; 29:1138-1144.
6. R. Brown, O. Khegai, and P. Parasoglou, Magnetic resonance imaging of phosphocreatine and determination of BOLD kinetics in lower extremity muscles using a dual-frequency coil array. Sci. Rep. 2016; 6:30568.
7. A. I. Schmid, M. Meyerspeer, S. D. Robinson, et al., Dynamic PCr and pH imaging of human calf muscles during exercise and recovery using 31P gradient-echo MRI at 7 Tesla. Magn. Reson. Med. 2016; 75:2324-2331.
8. L. Valkovic, M. Chmelík, M. Meyerspeer, et al. Dynamic 31P MRSI with spiral readout for quantification of mitochondrial capacity in muscles of the calf during plantar flexion exercise at 7T. Proc. Intl. Soc. Mag. Reson. Med. 2016; 1107.
9. C. Ma, F. Lam, Qiang Ning, et al., High-resolution dynamic 31P-MRSI using high-order partially separable functions. Proc. Intl. Soc. Mag. Reson. Med. 2016; 0875.
10. J. He, Q. Liu, A. G. Christodoulou, et al., Accelerated high-dimensional MR imaging with sparse sampling using low-rank tensors. 2016; 35(9):2119-2129.
11. F. Lam, C. Ma, B. Clifford, C. L. Johnson, and Z.-P. Liang, High-resolution 1H-MRSI of the brain using SPICE: data acquisition and image reconstruction. Man. Reson. Med. 2016; 76(4):1059 — 1070.
Figures