2948
Investigation of Lithium Distribution in the Rat Brain ex vivo using Lithium-7 Magnetic Resonance Imaging at 17 Tesla1INSERM UMR-S 1144, Universités Paris-Descartes & Paris-Diderot, Paris, France, 2Neurospin, CEA, Université Paris-Saclay, Gif-sur-Yvette, France, 3APHP, GH Saint-Louis-Lariboisière-Fernand Widal, Laboratoire de Toxicologie biologique, Paris, France, 4Inserm UMR-S 894, Université Paris-Descartes, Paris, France, 5APHP, GH Saint-Louis-Lariboisière-Fernand Widal, Réanimation Médicale et Toxicologique, Paris, France
Synopsis
Lithium (Li) is the first-line mood stabilizer to treat bipolar disorder patients. However, its mechanisms of action and transport across the blood-brain barrier remain poorly understood. In this study, we aimed at mapping ex vivo the cerebral Li distribution of rats treated for 28 days with Li2CO3 using 7Li-MRI at 17.2 Tesla. Using a phantom replacement approach, MRI-derived Li concentrations were calculated and validated by comparison to inductively coupled plasma-mass spectrometry (ICP-MS) measurements. Lithium distributions were uneven (normalized lithium content ranging from 0.7 to 1.4) and symmetrical with consistently lower concentrations in the metencephalon and higher ones in the cortex.
Introduction
Lithium (Li) is the first-line mood stabilizer to treat bipolar disorder patients [1]. However, its mechanisms of action and transport across the blood-brain barrier remain poorly understood. Lithium-7 magnetic resonance imaging (7Li-MRI) provides a non-invasive method to determine brain Li concentrations and regional distribution [2-6]. In this study, we aimed to map ex vivo the cerebral Li distribution of rats using 7Li-MRI at 17.2 Tesla. Using a phantom replacement approach, MRI-derived Li concentrations were calculated and validated by comparison to inductively coupled plasma-mass spectrometry (ICP-MS) measurements [7].Methods
Ten adult male rats (Janvier Labs, France) were treated for 28 days with Li2CO3 diluted in tap water (800 or 1200 mg/L solutions) in order to reach plasma Li levels in the human therapeutic range [7]. On day 28, rats were anesthetized using isoflurane to draw blood samples, exsanguinated, and then brain fixation was performed with 4% paraformaldehyde (PFA). The rats were decapitated and their heads immersed in a 50mL Falcon tube filled with Fluorinert FC40 (3M Electronic Liquids, USA) prior to NMR acquisitions.
Later, the brains were extracted from the skull and sectioned into six different regions of interest (ROI): the olfactory bulb, frontal cortex, parieto-occipital cortex, diencephalon cerebellum, and brainstem. These brain samples were dissolved in nitric acid and Li content measured using inductively coupled plasma-mass spectrometry (ICP-MS) and compared to MRI results.Li-NMR data were acquired with a horizontal 17.2 T MRI scanner (Bruker, Germany) using a home-made dual-resonance 1H/7Li surface coil.
After acquisition of a 3D T2*-weighted anatomical image and a few non-localized free induction decay (FID) 7Li spectra for RF power calibration, a 3D Turbo-Spin-Echo 7Li image was acquired (TE/TR = 12/4000 ms, inter-echo = 12 ms, turbo-factor = 8, resolution 2x2x4 mm3, 1024 averages) for 36 hours.
We employed a phantom replacement approach [8] for quantification, using a Li gel 50mL phantom (10 mmol/L in 4% agarose). Since the phantom and heads were positioned the same relative to the 1H/7Li coil, this approach allowed us to reasonably compensate for the large B1 inhomogeneities. Image analysis was carried out using Matlab (Mathworks, USA) and in particular the Statistical Parametric Mapping (SPM8) software [9]. Anatomical and 7Li MRI images were aligned for all animals. Brain masks were calculated and applied to the reference 7Li image. The masked reference image was then fitted using a 5th degree polynomial 3D function and the masked raw 7Li MRI was divided by this mathematical model of the 7Li reference image. Differential T1- and T2-weighting between ex vivo and phantom 7Li images were accounted for at this stage (correction factor of 1.33).
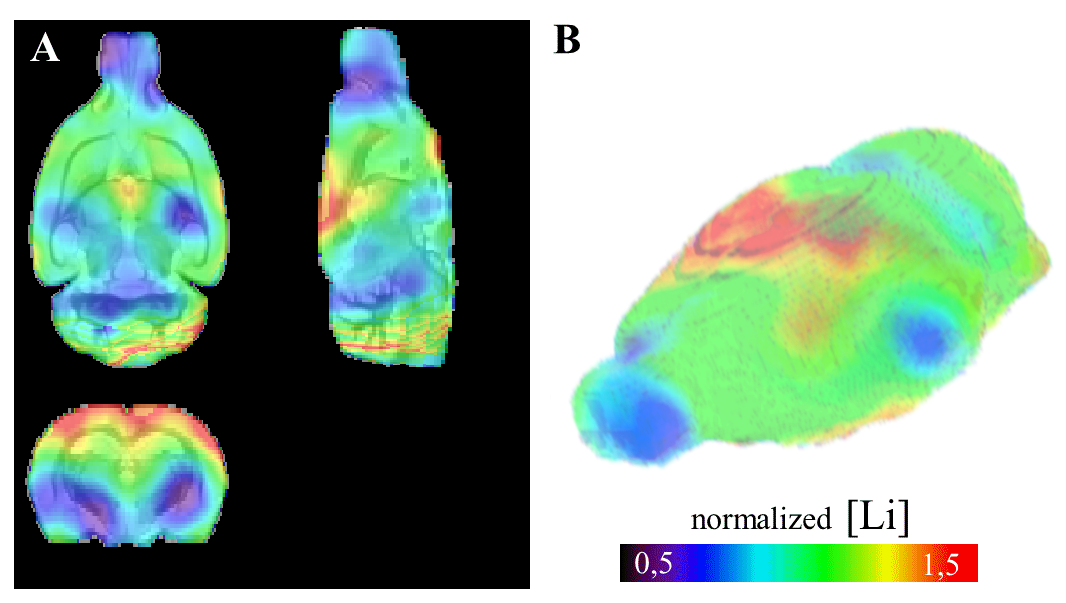
After co-registration of our Li concentration maps to a high-resolution home-made rat brain template, average Li concentrations were calculated for all six ROI, and brain Li concentration maps were scaled to a whole-brain mean of 1 and averaged (Figure 1).
Results
Brain Li distribution was uneven (normalized Li content ranging from 0.7 to 1.4) but symmetrical, with consistently lower concentrations in the metencephalon and higher ones in the cortex. Individual 7Li-MRI (Figure 2) exhibited a good sensibility despite the modest brain Li content, the maximum normalized signal-to-noise ratio being estimated as 4.2 107 mol-1.min-1/2 and the sensitivity threshold at 0.03 mmol/L. Our MRI-derived Li concentrations were validated by comparison to the ICP-MS measurements (Figure 3, [Li]MRI = 1.12*[Li]MS, R=0.94). The average brain-to-plasma Li ratio was 0.34 ± 0.07.Discussion
Our results are in agreement with previous 7Li NMR studies [2-6]. While our Li concentrations are well correlated with ICP-MS values (R=0.94), some remaining discrepancies may be attributed to residuals errors in the polynomials fits of our external reference Li image. Based on additional experiments (data not shown), our relatively low brain-to-plasma Li ratios could be linked to a partial wash-out of extracellular Li during the PFA fixation bath.Conclusion
To the best of our knowledge, this study is the first comprehensive report on brain Li distribution using quantitative 7Li-MRI in rats. Compared to previous studies using analysis techniques such as radiographic dielectric track registration, atomic absorption and mass spectroscopy [7,10-12], our MRI approach allows a quantitative and retrospective exploration of brain Li distribution without any extensive tissue manipulation or precise dissection. In the future, further technical developments should help us to achieve better spatial or temporal resolutions, opening the way for more ambitious studies to better understand Li pharmacodynamics.Acknowledgements
No acknowledgement found.References
1. Das Gupta R, Guest JF. Annual cost of bipolar disorder to UK society. Br J Psychiatry 2002;180:227-233
2. Komoroski RA. Biomedical applications of 7Li NMR. NMR Biomed 2005;18:67-73.
3. Machado-Vieira R, Otaduy MC, Zanetti MV, De Sousa RT, Dias VV, Leite CC, Forlenza OV, Busatto GF, Soares JC, Gattaz WF. A selective association between central and peripheral lithium levels in remitters in bipolar depression: a 3T-(7)Li magnetic resonance spectroscopy study. Acta Psychiatr Scand 2016;133:214-220.
4. Renshaw PF, Haselgrove JC, Leigh JS, Chance B. In vivo nuclear magnetic resonance imaging of lithium. Magn Reson Med 1985;2:512-516.
5. Komoroski RA, Lindquist DM, Pearce JM. Lithium compartmentation in brain by 7Li MRS: effect of total lithium concentration. NMR Biomed 2013;26:1152-1157.
6. Ramaprasad S, Ripp E, Pi J, Lyon M. Pharmacokinetics of lithium in rat brain regions by spectroscopic imaging. Magn Reson Imaging 2005;23:859-863.
7. Hanak AS, Chevillard L, El Balkhi S, Risède P, Peoc'h K, Mégarbane B. Study of blood and brain lithium pharmacokinetics in the rat according to three different modalities of poisoning. Toxicol Sci 2015;143:185-195.
8.Soher BJ, van Zijl PC, Duyn JH, Barker PB. Quantitative proton MR spectroscopic imaging of the human brain. Magn Reson Med 1996;35:356-363.
9. http://www.fil.ion.ucl.ac.uk/spm/software/spm8/
10. Nelson SC, Herman MM, Bensch KG, Barchas JD. Localization and quantitation of lithium in rat tissue following intraperitoneal injections of lithium chloride. II. Brain. J Pharmacol Exp Ther 1980;212:11-15.
11. Ebadi MS, Simmons VJ, Hendrickson MJ, Lacy PS. Pharmacokinetics of lithium and its regional distribution in rat brain. Eur J Pharmacol 1974;27:324-329.
12. Sandner G, Di Scala G, Oberling P, Abbe JC, Stampfler A, Sens JC. Distribution of lithium in the rat brain after a single administration known to elicit aversive effects. Neurosci Lett 1994;166:1-4.
Figures